HAL Id: hal-00823583
https://hal.archives-ouvertes.fr/hal-00823583
Submitted on 20 May 2013
HAL is a multi-disciplinary open access
archive for the deposit and dissemination of
sci-entific research documents, whether they are
pub-lished or not. The documents may come from
teaching and research institutions in France or
abroad, or from public or private research centers.
L’archive ouverte pluridisciplinaire HAL, est
destinée au dépôt et à la diffusion de documents
scientifiques de niveau recherche, publiés ou non,
émanant des établissements d’enseignement et de
recherche français ou étrangers, des laboratoires
publics ou privés.
RUBIX, A Framework for Improving Data Integration
with Linked Data
Ahmad Assaf, Aline Senart, Eldad Louw, Corentin Follenfant, David
Trastour, Raphaël Troncy
To cite this version:
Ahmad Assaf, Aline Senart, Eldad Louw, Corentin Follenfant, David Trastour, et al.. RUBIX, A
Framework for Improving Data Integration with Linked Data. WOD ’12 Proceedings of the First
International Workshop on Open Data, May 2012, France. pp.13-21, �10.1145/2422604.2422607�.
�hal-00823583�
RUBIX: A Framework for Improving Data
Integration with Linked Data
Ahmad Assaf
†, Eldad Louw
†, Aline Senart
†, Corentin Follenfant
†,
Raphaël Troncy
‡and David Trastour
††
SAP Research, SAP Labs France SAS 805 avenue du Dr. Maurice Donat, BP 1216
06254 Mougins Cedex, France [email protected]
‡
EURECOM
2229 route des crètes, 06560 Sophia Antipolis, France [email protected]
ABSTRACT
With today’s public data sets containing billions of data items, more and more companies are looking to integrate external data with their traditional enterprise data to improve business intelligence analysis. These distributed data sources however exhibit heterogeneous data formats and terminologies and may contain noisy data. In this paper, we present RUBIX, a novel framework that enables business users to semi-automatically perform data integration on potentially noisy tabular data. This framework offers an extension to Google Refine with novel schema matching algorithms leveraging Freebase rich types. First experiments show that using Linked Data to map cell values with instances and column headers with types improves significantly the quality of the matching results and therefore should lead to more informed decisions.
Categories and Subject Descriptors
H.3.5 [Information Storage and Retrieval]: Content Analysis and Indexing, Information Search and Retrieval, On-line Information Services.
General Terms
Algorithms, Measurement, Experimentation
Keywords
Business Intelligence, Data Integration, Semantic Web, Data Mashup, Instance Matching, Linked Data,
1. INTRODUCTION
Companies have traditionally performed business analysis based on transactional data stored in legacy relational databases. The enterprise data available for decision makers was typically relationship management or enterprise resource planning data [2]. However social media feeds, weblogs, sensor data, or data published by governments or international organizations are nowadays becoming increasingly available [3].
The quality and amount of structured knowledge available make it now feasible for companies to mine this huge amount of public data and integrate it in their next-generation enterprise information management systems. Analyzing this new type of data within the context of existing enterprise data should bring
them new or more accurate business insights and allow better recognition of sales and market opportunities [4].
These new distributed sources, however, raise tremendous challenges. They have inherently different file formats, access protocols or query languages. They possess their own data model with different ways of representing and storing the data. Data across these sources may be noisy (e.g. duplicate or inconsistent), uncertain or be semantically similar yet different [5]. Integration and provision of a unified view for these heterogeneous and complex data structures therefore require powerful tools to map and organize the data.
In this paper, we present RUBIX, a framework that enables business users to semi-automatically combine potentially noisy data residing in heterogeneous silos. Semantically related data is identified and appropriate mappings are suggested to users. On user acceptance, data is aggregated and can be visualized directly or exported to Business Intelligence reporting tools. RUBIX is composed of a set of extensions to Google Refine server and a plug-in to its user interface [6]. Google Refine was selected for its extensibility as well as good cleansing and transformation capabilities [7].
We first map cell values with instances and column headers with types from popular data sets from the Linked Open Data Cloud. To perform the matching, we use the Auto Mapping Core (also called AMC [8]) that combines the results of various similarity algorithms. The novelty of our approach resides in our exploitation of Linked Data to improve the schema matching process. We developed specific algorithms on rich types from vector algebra and statistics. The AMC generates a list of high-quality mappings from these algorithms allowing better data integration.
First experiments show that Linked Data increases significantly the number of mappings suggested to the user. Schemas can also be discovered if column headers are not defined and can be improved when they are not named or typed correctly. Finally, data reconciliation can be performed regardless of data source languages or ambiguity. All these enhancements allow business users to get more valuable and higher-quality data and consequently to take more informed decisions.
The rest of the paper is organized as follows. Section 2 presents some related work. Section 3 describes the framework that we have designed for business users to combine data from heterogeneous sources. Section 4 validates our approach and shows the value of the framework through experiments. Finally, Section 5 concludes the paper and discusses future work.
Permission to make digital or hard copies of all or part of this work for personal or classroom use is granted without fee provided that copies are not made or distributed for profit or commercial advantage and that copies bear this notice and the full citation on the first page. To copy otherwise, or republish, to post on servers or to redistribute to lists, requires prior specific permission and/or a fee.
WOD '12, May 25 2012, Nantes, France
2. RELATED WORK
While schema matching has always been an active research area in data integration, new challenges are faced today by the increasing size, number and complexity of data sources and their distribution over the network. Data sets are not always correctly typed or labeled and that hinders the matching process.
In the past, some work has tried to improve existing data schemas [9] but literature mainly covers automatic or semi-automatic labeling of anonymous data sets through Web extraction. Examples include [10] that automatically labels news articles with a tree structure analysis or [11] that defines heuristics based on distance and alignment of a data value and its label. These approaches are however restricting label candidates to Web content from which the data was extracted. [12] goes a step further by launching speculative queries to standard Web search engines to enlarge the set of potential candidate labels. More recently, [1] applies machine learning techniques to respectively annotate table rows as entities, columns as their types and pairs of columns as relationships, referring to the YAGO ontology. The work presented aims however at leveraging such annotations to assist semantic search queries construction and not at improving schema matching.
With the emergence of the Semantic Web, new work in the area has tried to exploit Linked Data repositories. The authors of [13] present techniques to automatically infer a semantic model on tabular data by getting top candidates from Wikitology [14] and classifying them with the Google page ranking algorithm. Since the authors’ goal is to export the resulting table data as Linked Data and not to improve schema matching, some columns can be labeled incorrectly, and acronyms and languages are not well handled [13]. In the Helix project [15], a tagging mechanism is used to add semantic information on tabular data. A sample of instances values for each column is taken and a set of tags with scores are gathered from online sources such as Freebase [16]. Tags are then correlated to infer annotations for the column. The mechanism is quite similar to ours but the resulting tags for the column are independent of the existing column name and sampling might not always provide a representative population of the instance values.
3. PROPOSITION
Google Refine (formerly Freebase Gridworks) is a tool designed to quickly and efficiently process, clean and eventually enrich large amounts of data with existing knowledge bases such as Freebase. The tool has however some limitations: it was initially designed for data cleansing on only one data set at a time, with no possibility to compose columns from different data sets. Moreover, Google Refine has some strict assumptions over the input of spreadsheets which makes it difficult to identify primitive and complex data types.
The AMC is a novel framework that supports the construction and execution of new matching components or algorithms. AMC contains several matching components that can be plugged and used, like string matchers (Levenshtein, JaroWinkler … etc.), data types matchers and path matchers. It also provides a set of combination and selection algorithms to produce optimized results (weighted average, average, sigmoid … etc.).
In this section, we describe in detail our framework allowing data mashup from several sources. We first present our framework architecture, then the activity flow and finally our approach to schema matching.
3.1 Framework Architecture
Google Refine makes use of a modular web application framework similar to OSGi called Butterfly [17]. The server-side written in Java maintains states of the data (undo/redo history, long-running processes, etc.) while the client-side implemented in Javascript maintains states of the user interface (facets and their selections, view pagination, etc.). Communication between the client and server is done through REST web services.
As depicted in Figure 1, our framework leverages Google Refine and defines three new Butterfly modules to extend the server’s functionality (namely Match, Merge and Aggregate modules) and one JavaScript extension to capture user interaction with these new data matching capabilities.
3.2 Activity Flow
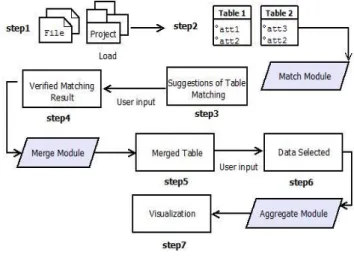
This section presents the sequence of activities and interdependencies between these activities when using our framework. Figure 2 gives an outline of these activities.
The data sets to match can be contained in files (e.g. csv, Excel spreadsheets, etc.) or defined in Google Refine projects (step 1). The inputs for the match module are the source and target files and/or projects that contain the data sets. These projects are imported into the internal data structure (called schema) of the AMC [18] (step 2). The AMC then uses a set of built-in algorithms to calculate similarities between the source and target schemas on an element basis, i.e. column names in the case of spreadsheets or relational databases. The output is a set of similarities, each containing a triple consisting of source schema element, target element, and similarity between the two.
Figure 2. Activity Flow
Figure 1. Framework Architecture
These results are presented to the user in tabular form (step 3) such that s/he can check, correct, and potentially complete the mappings (step 4).
Once the user has completed the matching of columns, the merge information is sent back to Google Refine, which calls the merge module. This module creates a new project, which contains a union of the two projects where the matched columns of the target project are appended to the corresponding source columns (step 5). The user can then select the columns that s/he wants to merge and visualize by dragging and dropping the required columns onto the fields that represent the x and y axes (step 6).
Once the selection has been performed, the aggregation module merges the filtered columns and the result can then be visualized (step 7). As aggregation operations can quickly become complex, our default aggregation module can be replaced by more advanced analytics on tabular data. The integration of such a tool is part of future work.
3.3 Schema Matching
Schema matching is typically used in business to business integration, metamodel matching, as well as Extract, Transform, Load (ETL) processes. For non-IT specialists the typical way of comparing financial data from two different years or quarters, for example, would be to copy and paste the data from one Excel spreadsheet into another one, thus creating reduncancies and potentially introducing copy-and-paste errors. By using schema matching techniques it is possible to support this process semi-automatically, i.e. to determine which columns are similar and propose them to the user for integration. This integration can then be done with appropriate business intelligence tools to provide visualisations.
One of the problems in performing the integration is the quality of data. The columns may contain data that is noisy or incorrect. There may also be no column headers to provide suitable information for matching. A number of approaches exploit the similarities of headers or similarities of types of column data. We propose a new approach that exploits semantic rich typing provided by popular datasets from the Linked Data cloud.
3.3.1 Data Reconciliation
Reconciliation enables entity resolution, i.e. matching cells with corresponding typed entities in case of tabular data. Google Refine already supports reconciliation with Freebase but requires confirmation from the user. For medium to large data sets, this can be very time-consuming. To reconcile data, we therefore first identify the columns that are candidates for reconciliation by skipping the columns containing numerical values or dates. We then use the Freebase search API to query for each cell of the source and target columns the list of typed entities candidates. Results are cached in order to be retrieved by our similarity algorithms.
3.3.2 Matching Unnamed and Untyped Columns
The AMC has the ability to combine the results of different matching algorithms. Its default built-in matching algorithms work on column headers and produce an overall similarity score between the compared schema elements. It has been proven that combining different algorithms greatly increases the quality of matching results [8] [19]. However, when headers are missing or ambiguous, the AMC can only exploit domain intersection and inclusion algorithms based on column data. We have therefore implemented three new similarity algorithms that leverage the rich
types retrieved from Linked Data in order to enhance the matching results of unnamed or untyped columns. They are presented below.
3.3.2.1 Cosine Similarity
The first algorithm that we implemented is based on vector algebra. Let be the vector of ranked candidate types returned by Freebase for each cell value of a column. Then:
∑
⃗⃗
where is the score of the entry and ⃗⃗ is the type returned by Freebase. The vector notation is chosen to indicate that each distinct answer determines one dimension in the space of results. Each cell value has now a weighted result set that can be used for aggregation to produce a result vector for the whole column. The column result is then given by:
∑
We compare the result vector of candidate types from the source column with the result vector of candidate types from the target column. Let be the result vector for the target column, then the similarity between the columns pair can be calculated using the absolute value of the cosine similarity function:
‖ ‖ ‖ ‖| |
3.3.2.2 Pearson Product-Moment Correlation
Coefficient (PPMCC)
The second algorithm that we implemented is PPMCC, a statistical measure of the linear independence between two variables [20]. In our method, x is an array that represents the total scores for the source column rich types, y is an array that represents the mapped values between the source and the target columns. The values present in x but not in y are represented by zeros. We have:
[{ } { } { } { }]
[{ } { } { } { }]
Where are different rich type values retrieved from Freebase, are the sum of scores for each corresponding r occurrence in the source column, and
are the sum of scores for each corresponding r
occurrence in the target column.
The input for PPMC consists of two arrays that represent the values from the source and target columns, where the source column is the column with the largest set of rich types found. For example:
[ ]
[ ]
Then the sample correlation coefficient (r) is calculated using:
∑ ̅ ̅ √∑ ̅
√∑ ̅
∑ ( ̅ ) ( ̅)
Where ( ̅) ̅and are the standard score, sample mean and sample standard deviation, respectively.
3.3.2.3 Spearman’s Rank Correlation Coefficient
The last algorithm that we implemented to match unnamed and untyped columns is Spearman’s rank correlation coefficient [21]. It applies a rank transformation on the input data and computes PPMCC afterwards on the ranked data. In our experiments we used Natural Ranking with default strategies for handling ties and NaN values. The ranking algorithm is however configurable and can be enhanced by using more sophisticated measures.
3.3.3 Column Labeling
We showed in the previous section how to match unnamed and untyped columns. Column labeling is however beneficial as the results of our previous algorithms can be combined with traditional header matching techniques to improve the quality of matching.
Rich types retrieved from Freebase are independent from each other. We need to find a method that will determine normalized score for each type in the set by balancing the proportion of high scores with the lower ones. We used Wilson score interval for a Bernoulli parameter that is presented in the following equation:
( ̂ ⁄ ⁄√ [ ̂ ̂ ⁄ ⁄ ] ⁄ ) ( ⁄⁄ ) ⁄
Here ̂ is the average score for each rich type, n is the total number of scores and ⁄ is the score level; in our case it is 1.96 to reflect a score level of 0.95.
3.3.4 Handling Non-String Values
So far, we have covered several methods to identify the similarity between “String” values, but how about other numeral values such as dates, money, distance, etc.? For this purpose, we have implemented some basic type identifier that can recognize dates, money, numerical values, numerals used as identifiers. This will help us in better match corresponding entries. Adjusting AMC’s combination algorithms can be of great importance at this stage. For example, assigning weights to different matchers and tweaking the configuration can yield more accurate results.
4. EXPERIMENTS
We present in this section results from experiments we conducted using the different methods described above. To appreciate the value of our approach, we have used a real life scenario that exposes common problems faced by the management in SAP. The data we have used come from two different SAP systems: the Event tracker and the Travel Expense Manager.
The Event Tracker provides an overview of events (Conferences, Internal events, etc.) that SAP Research employees contribute to or host. The entries in this system contain as much information as necessary to give an overview of the activity like the activity type and title, travel destination, travel costs divided into several sub categories (conference fees, accommodation, transportation and others), and duration related information (departure, return dates). Entries in the Event Tracker are generally entered in batches as
employees fill in their planned events that they wish to attend or contribute to at the beginning of each year. Afterwards, managers can either accept or reject these planned events according to their allocated budget.
On the other hand, the Travel Expense Manager contains the actual expenses data for the successfully accepted events. This system is used by employees to enter their actual trip details in order to claim their expenses. It contains more detailed information and aggregated views of the events, such as the total cost, duration calculated in days, currency exchange rates and lots of internal system tags and identifiers.
Matching reports from these two systems is of great benefit to managers to organize and monitor their allocated budget. They mainly want to:
1. Find the number of the actual (accepted) travels compared with the total number of entered events. 2. Calculate the deviation between the estimated and
actual cost of each event.
However, matching from these two sources can face several difficulties that can be classified in two categories: column headers and cells. Global labels (or column headers as we are dealing with spreadsheet files) can have the following problems:
Missing labels: importing files into Google Refine with empty headers will result in assigning that column a dummy name by concatenating the word “column” with a number starting from 0.
Dummy labels or semantically unrelated names: this is a common problem especially from the data coming from the Travel Expense Manager. This can be applied to columns that are labeled according to the corresponding database table (i.e. lbl_dst to denote destination label). Moreover, column labels do not often convey the semantic type of the underlying data.
The second category of difficulties is at cell (single entry) level: Detecting different date formats: we have found out that
dates field coming from the two systems have different formats. Moreover, the built-in type detection in Google Refine converts detected date into another third format. Entries from different people can be made in different
languages.
Entries in the two systems can be incomplete, an entry can be shortened automatically by the system. For example, selecting a country in the Travel Expense Manager will result in filling out that country code in the exported report (i.e. France = FR).
Inaccurate entries: this is one of the most common problems. Users enter sometimes several values in some fields that correspond to the same entity. For example, in the destination column, users can enter the country, the airport at the destination, the city or even the exact location of the event (i.e. office location).
The data used in our evaluation consists of around 60 columns and more than 1000 rows. Our source data set will be the data coming from Event Tracker, and our target data set will be the data from the Travel Expense Manager.
By manually examining the two data sets, we have found out that most of the column headers in the source table exist and adequately present the data. However, we have noticed few missing labels in the target table and few ambiguous column headers. We have detected several entries in several languages:
the main language is English but we have also identified French, German. Destination field had entries in several formats: we have noticed airport names, airports by their IATA code, country codes, and cities.
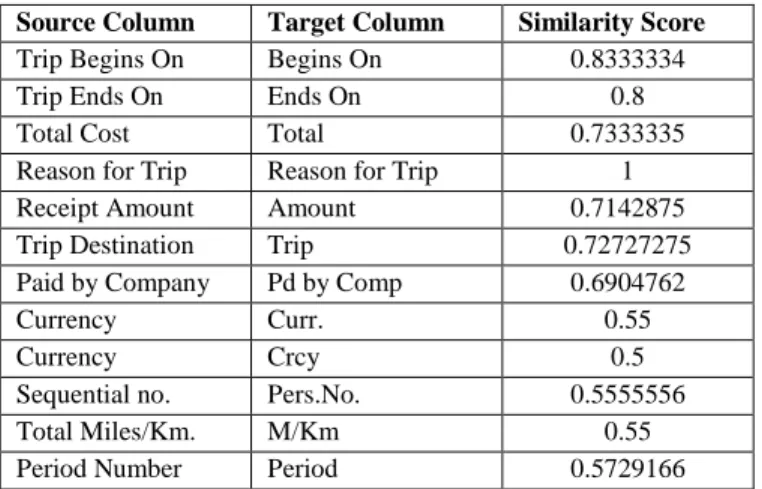
Running AMC with its default matchers returns the matching results shown in Table 1.
Source Column Target Column Similarity Score Trip Begins On Begins On 0.8333334 Trip Ends On Ends On 0.8 Total Cost Total 0.7333335 Reason for Trip Reason for Trip 1 Receipt Amount Amount 0.7142875 Trip Destination Trip 0.72727275 Paid by Company Pd by Comp 0.6904762 Currency Curr. 0.55
Currency Crcy 0.5
Sequential no. Pers.No. 0.5555556 Total Miles/Km. M/Km 0.55 Period Number Period 0.5729166
Table 1. Similarity Scores Using the AMC Default Matching Algorithms
The AMC has produced a total of 12 mappings, 10 of those were valid matches (validated manually).
The AMC has perfectly matched the two columns labeled “Reason for Trip” using name and data type similarity calculations (the type here was identified as a String). Moreover, it has computed several similarities for columns based on the pre-implemented String matchers that were applied on the column headers and the primitive data types of the cells (Integer, Double, Float, etc.). However, there is no alignment found between the other columns since their headers are not related to each other, although the actual cell values can be similar. AMC’s default configuration has a threshold of 50%, so any similarity score below that will not be shown.
The Cosine Similarity algorithm combined with the AMC default matchers produces the results shown in Table 2.
Source Column Target Column Similarity Trip Begins On Begins On 0.8584657 Trip Ends On Ends On 0.84179896 Total Cost Total 0.799537 Reason for Trip Reason for Trip 0.79654884 Receipt Amount Amount 0.7910053 Trip Number Trip 0.76388884 Paid by Company Pd by Comp 0.76322746 Currency Curr. 0.72125995 Currency Crcy 0.72125995 Sequential no. Pers.No. 0.6973545 Total Miles/Km M/Km 0.69287604
tr_dst 0.6667874
Name of employee Last/First Name 0.5860022
or applicant
Period Number Period 0.5729166
Table 2. Similarity Scores Using the AMC Default Matching Algorithms + Cosine Similarity Method
We notice that we have an increased number of mappings 14 (+2), 13 of them are valid matches. The similarity score for several matches has also improved. For example, the “tr_dst” column is now aligned to the blank header. This shows that our approach allows performing schema matching on columns with no headers. For simplicity reason we have used the default combination algorithm for AMC which is an average of the applied algorithms (AMC’s native and Cosine). We should also note that we have configured AMC’s matchers to identify a “SIMILARTY_UNKOWN” value for columns that could not be matched successfully, which will allow other matchers to perform better. For example, our semantic matchers will skip columns that do not convey semantic meaning thus not affecting the score of other matchers. Moreover, the relatively high similarity score of “tr_dst” column is explained by the fact that the native AMC matching algorithm has skipped that column as it does not have a valid header, and the results are solely those of the Cosine matcher. Likewise, the Cosine matcher skips checking the “Cost” columns as they contain numeric values, and the implemented numerical matchers with the AMC’s native matcher results are taken into account.
To further enhance these results, we plug in our numeral matcher in order to identify semantically related numeral values like date or money or IDs. The results with the combination of the numeral matcher are shown in table 3.
Source Column Target Column Similarity Trip Begins On Begins On 0.89384925 Trip Ends On Ends On 0.8813492 Total Cost Total 0.799537 Reason for Trip Reason for Trip 0.9592593 Receipt Amount Amount 0.84325397 Trip Number Trip 0.76388884 Paid by Company Pd by Comp 0.76322746 Currency Curr. 0.6708754 Currency Crcy 0.6708754 Sequential no. Pers.No. 0.6973545 Total Miles/Km M/Km 0.69287604 Name of employee or
applicant Last/First Name 0.5860022 Period Number Period 0.5729166
Delta 0.5448413
Travel Expense Type 0.53974116 Table 3. Similarity Scores Using the AMC Default Matching Algorithms + Cosine Similarity Method + Numeral matcher Plugging the numeral matcher has increased the number of matches found from the previous run to 15 (+1). However, the number of valid matches is 12 with an efficiency of 80%
compared to 93% before plugging the numeral matcher. We notice that the column “tr_dst” is not matched anymore. Nevertheless, we have noticed a 1.7% enhancement in the similarity scores computed for the matched columns. Looking at the overall results, plugging in the Cosine matcher without and with the numeral matcher has increased the quality of the matches by 7% and 9% respectively.
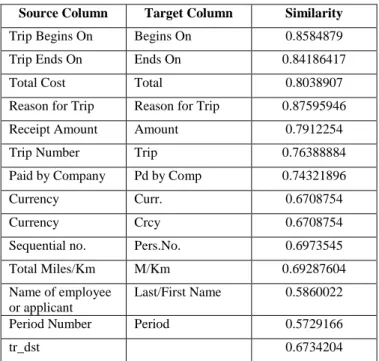
The (PPMCC) Similarity algorithm combined with the AMC default matchers produces the results shown in Table 4.
Source Column Target Column Similarity Trip Begins On Begins On 0.8584879 Trip Ends On Ends On 0.84186417 Total Cost Total 0.8038907 Reason for Trip Reason for Trip 0.87595946 Receipt Amount Amount 0.7912254 Trip Number Trip 0.76388884 Paid by Company Pd by Comp 0.74321896 Currency Curr. 0.6708754 Currency Crcy 0.6708754 Sequential no. Pers.No. 0.6973545 Total Miles/Km M/Km 0.69287604 Name of employee
or applicant
Last/First Name 0.5860022 Period Number Period 0.5729166
tr_dst 0.6734204
Table 4. Similarity Scores Using the AMC Default Matching Algorithms+ PPMCC Similarity Method
We notice again an increase in the number of matches compared to the AMC’s default configuration as now we have 14 (+2) matches, 13 of them are valid. In addition to that, we notice a general increase in the similarity scores to those produced by the default AMC’s algorithms.
Table 5 shows the results of the matching process after combining the Numeral matcher with PPMCC.
Source Column Target Column Similarity Trip Begins On Begins On 0.8940713 Trip Ends On Ends On 0.8816574 Total Cost Total 0.85332745 Reason for Trip Reason for Trip 0.9592593 Receipt Amount Amount 0.8438872 Trip Number Trip 0.82379955 Paid by Company Pd by Comp 0.82316905 Currency Curr. 0.73459923 Currency Crcy 0.73459923 Sequential no. Pers.No. 0.7746934 Total Miles/Km M/Km 0.7693292 Name of employee or Last/First Name 0.59110224
applicant
Delta 0.5448413
Travel Expense Type 0.53974116 Period Number Period 0.5729166 Table 5. Similarity Scores Using the AMC Default Matching Algorithms + PPMCC Similarity Method + Numeral matcher Plugging the numeral matcher has again increased the number of matches by one but again has a lower percentage of valid matches. Moreover, we noticed a significant increase in the similarity scores as the results with the numeral matchers increased the efficiency of the results by 6%. Looking at the overall results, plugging in the PPMCC matcher without and with the Numeral matcher has increased the quality of the matches by 12% and 6% respectively.
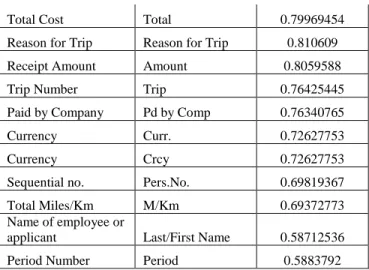
The Spearman Similarity algorithm combined with the AMC default matchers produces the results shown in Table 6.
Source Column Target Column Similarity Trip Begins On Begins On 0.8584657 Trip Ends On Ends On 0.84179896 Total Cost Total 0.799537 Reason for Trip Reason for Trip 0.80542034 Receipt Amount Amount 0.7910053 Trip Number Trip 0.76388884 Paid by Company Pd by Comp 0.76322746 Currency Curr. 0.7247269 Currency Crcy 0.7247269 Sequential no. Pers.No. 0.6973545 Total Miles/Km M/Km 0.69287604 Name of employee
or applicant
Last/First Name 0.5860022 Period Number Period 0.5729166
Table 6. Similarity Scores Using the AMC Default Matching Algorithms+ Spearman Similarity Method
We notice again an increase in the number of matches compared to the AMC’s default configuration as now we have 13 (+1) matches, 12 of them are valid. In addition to that we notice a general increase in the similarity scores to those produced by the default AMC’s algorithms. However, we notice that by plugging the Spearman method, the number of matches has decreased compared to the previous trials. After several experiments we have found that this method does not work well with noisy data sets. For instance, the similarity results returned by Cosine, Pearson’s and Spearman’s matchers for the {tr_dst, empty header} pair is much higher: 66%, 67% and 43% respectively. Table 7 shows the results of the matching process after combining the Numeral matcher with Spearman.
Source Column Target Column Similarity Trip Begins On Begins On 0.85636675 Trip Ends On Ends On 0.84389883
Total Cost Total 0.79969454 Reason for Trip Reason for Trip 0.810609 Receipt Amount Amount 0.8059588 Trip Number Trip 0.76425445 Paid by Company Pd by Comp 0.76340765 Currency Curr. 0.72627753 Currency Crcy 0.72627753 Sequential no. Pers.No. 0.69819367 Total Miles/Km M/Km 0.69372773 Name of employee or
applicant Last/First Name 0.58712536 Period Number Period 0.5883792 Table 7. Similarity Scores Using the AMC Default Matching
Algorithms + Spearman Similarity Method + Numeral matcher
Plugging in the Numeral matcher has slightly increased the similarity scores by an average of 0.03%. In general, plugging in the Spearman matcher without and with the Numeral matcher has increased the quality of the matches by around 8%.
To properly measure the impact of each algorithm, we have tested the three algorithms (Cosine, PPMCC and Spearman) alone by de-activating the AMC’s default matchers on the above data set. The results are shown in Figures 3 and 4. We have noticed that generally, the Cosine and PPMCC matchers perform well, resulting in more matching and better similarity score. However, Spearman performed less efficiently in finding more matches due to its inefficiency on noisy data sets.
To better evaluate the three algorithms, we have tested them on four different data sets extracted from the Travel Expense Manager and Event Tracker systems. We ensured that the different experiments will cover all the cases needed to properly evaluate the matcher dealing with all the problems mentioned earlier. The results of our findings are shown in Figure 5.
We have found that generally the Cosine method is the best performing algorithm compared to the other two especially when dealing with noisy data sets. This was noticed particularly in our fourth experiment as the Cosine algorithm performed around 20% better than the other two methods. After investigating the dataset, we have found that several columns contained noisy and unrelated data. For example, in a “City” column, we had values such as “reference book” or “NOT_KNOWN”.
To gain better similarity results we decided to combine several matching algorithms together. By doing so, we would benefit from the power of the AMC’s string matchers that will work on column headers and our numeral and semantic matchers. Table 8 shows the result of combining all the algorithms mentioned above.
Source Column Target Column Similarity Trip Begins On Begins On 0.92923284 Trip Ends On Ends On 0.92089945 Receipt Amount Amount 0.8955026 Total Cost Total 0.799537 Currency2 Curr. 0.7823203 Currency Crcy 0.77499205 Trip Country/Group Ctr2 0.767311 Trip Number Trip 0.76425445 Paid by Company Pd by Comp 0.76322746
tr_dst 0.73916584
Name of employee or
applicant Last/First Name 0.5747218 Table 8. Similarity Scores Using the Combination of all the
algorithms 0.7 0.72 0.74 0.76 0.780.8 0.82 With Numeral Without Numeral 11 12 13 14 15 Number Of Matches Number Of Valid Matches 0 0.2 0.4 0.6 0.8 1 1.2 Cosin PPMCC Spearman
Figure 5. Performance score of the three algorithms on four different data sets
Figure 4. The number of matches found by each algorithm
Figure 3. Performance score of the three algorithms
The combination of the above mentioned algorithms have enhanced generally the similarity scores for the group. Moreover, we notice that the column “Trip Country/Group” was matched with “Ctr2”. This match was not computed singularly by any of the previous algorithms. The total number of matches found was lower to those on the previous runs (11 matches). However, all these matches are valid with 100% efficiency with an average of 11% enhanced similarities.
We have found that combining matching algorithms resulted in increased valid matches and higher similarity scores. Several tuning methods can be applied in order to enhance the similarity score as well. Trying other combination algorithms instead of the naïve average will be an essential part of our future work.
5. CONCLUSION AND FUTURE WORK
In this paper, we presented RUBIX, a framework enabling mashup of potentially noisy enterprise and external data. The implementation is based on Google Refine and uses Freebase to annotate data with rich types. As a result, the matching process of heterogeneous data sources is improved. Our preliminary evaluation shows that for datasets where mappings were relevant yet not proposed, RUBIX provides higher quality matching results. Additionally, the number of matches discovered is increased when Linked Data is used in most datasets. We plan in future work to evaluate RUBIX on larger datasets using rigorous statistical analysis [22]. We also consider integrating additional linked open data sources of semantic types such as DBpedia [23] or YAGO [24] and evaluate our matching results against instance-based ontology alignment benchmarks such as [25] or [26]. Another future work will be to generalize our approach on data schemas to data classification. The same way the AMC helps identifying the best matches for two datasets, we plan to use it for identifying the best statistical classifiers for a sole dataset, based on normalized scores.
6. REFERENCES
[1] Girija Limaye, Sunita Sarawagi, and Soumen Chakrabarti, "Annotating and Searching Web Tables Using Entities, Types and Relationships," Proceedings of the VLDB
Endowment, vol. III, no. 1, pp. 1338-1347, September 2010.
[2] Michael James Hernandez, Database design for mere
mortals: a hands-on guide to relational database design.:
Addison-Wesley, 2003.
[3] Danah Boyd and Kate Crawford, "Six Provocations for Big Data," Computer and Information Science, vol. 123, no. 1, 2011.
[4] Steve LaValle, Eric Lesser, Rebecca Shockley, Michael S. Hopkins, and Nina Kruschwitz, "Big Data, Analytics and the Path from Insights to Value," MIT Sloan Management
Review, vol. 52, no. 2, 2011.
[5] C. Kavitha, G. Sudha Sadasivam, and Sangeetha N. Shenoy, "Ontology Based Semantic Integration of Heterogeneous Databases," European Journal of Scientific Research, vol. 64, no. 1, pp. 115-122, 2011.
[6] Google Code. Google Refine. [Online].
http://code.google.com/p/google-refine/
[7] Christian Bizer, Tom Heath, and Tim Berners-Lee, "Linked Data - The Story So Far," International Journal on Semantic
Web and Information Systems, vol. 5, no. 3, pp. 1-22, 2009.
[8] Eric Peukert, Julian Eberius, and Rahm Erhard, "A Self-Configuring Schema Matching System," in 28th IEEE
International Conference on Data Engineering, 2012.
[9] Renee J. Miller and Periklis Andritsos, "On Schema Discovery," IEEE Data Engineering Bulletin, vol. 26, no. 3, pp. 40-45, 2003.
[10] Davy de Castro Reis, Paulo B. Golgher, Altigran S. da Silva, and Alberto H. F. Laender, "Automatic Web News Extraction Using Tree Edit Distance," in 13th International
Conference on World Wide Web, 2004.
[11] Jiying Wang and Fred Lochovsky, "Data Extraction and Label Assignment for Web Databases," in 12th International
Conference on World Wide Web, 2003.
[12] Altigran S. da Silva, Denilson Barbosa, M. B. Joao Cavalcanti, and A. S. Marco Sevalho, "Labeling Data Extracted from the Web," in International Conference on the
Move to Meaningful Internet Systems, 2007.
[13] Tim Finin, Zareen Syed, Varish Mulwad, and Anupam Joshi, "Exploiting a Web of Semantic Data for Interpreting Tables," in Web Science Conference, 2010.
[14] Tim Finin, Zareen Syed, James Mayfield, Paul McNamee, and Christine Piatko, "Using Wikitology for Cross-Document Entity Coreference Resolution," in AAAI Spring
Symposium on Learning by Reading and Learning to Read,
2009.
[15] Oktie Hassanzadeh et al., "Helix: Online Enterprise Data Analytics," in 20th International World Wide Web
Conference - Demo Track, 2011.
[16] Metaweb Technologies. Freebase. [Online].
http://www.freebase.com/
[17] Google Code. Smilie Butterfly. [Online].
http://code.google.com/p/simile-butterfly/
[18] Eric Peukert, Julian Eberius, and Erhard Rahm, "AMC - A Framework for Modelling and Comparing Matching Systems as Matching Processes," in International Conference on Data
Engineering - Demo Track, 2011.
[19] Umberto Straccia and Raphael Troncy, "oMAP: Combining Classifiers for Aligning Automatically OWL Ontologies," in
6th International Conference on Web Information Systems Engineering, 2005, pp. 133-147.
[20] Charles J. Kowalski, "On the Effects of Non-Normality on the Distribution of the Sample Product-Moment Correlation Coefficient," Journal of the Royal Statistical Society, vol. 21, no. 1, pp. 1-12, 1972.
[21] Sarah Boslaugh and Paul Andrew Watters, Statistics in a
Nutshell.: O'Reilly Media, 2008.
[22] Tom Fawcett, "An Introduction to ROC Analysis," Journal
of Pattern Recognition Letters, vol. 27, no. 8, 2006.
[23] Soren Auer et al., "DBpedia: A Nucleus for a Web of Open Data," in 6th International and 2nd Asian Semantic Web
Conference , 2007.
[24] Fabian M. Suchanek, Gjergji Kasneci, and Gerhard Weikum, "Yago: a Core of Semantic Knowledge," in 16th
International Conference on World Wide Web, 2007.
[25] (2012) Instance Matching at OAEI. [Online].
http://www.instancematching.org/oaei/
[26] Alfio Ferrara. ISLab Instance Matching Benchmark. [Online]. http://islab.dico.unimi.it/iimb/