HAL Id: hal-01889864
https://hal.archives-ouvertes.fr/hal-01889864
Submitted on 8 Oct 2018
HAL is a multi-disciplinary open access
archive for the deposit and dissemination of sci-entific research documents, whether they are pub-lished or not. The documents may come from teaching and research institutions in France or abroad, or from public or private research centers.
L’archive ouverte pluridisciplinaire HAL, est destinée au dépôt et à la diffusion de documents scientifiques de niveau recherche, publiés ou non, émanant des établissements d’enseignement et de recherche français ou étrangers, des laboratoires publics ou privés.
Can the MIQ-RS questionnaire be used to estimate the
performance of a MI-based BCI?
Sébastien Rimbert, Nathalie Gayraud, Maureen Clerc, Stéphanie Fleck,
Laurent Bougrain
To cite this version:
Sébastien Rimbert, Nathalie Gayraud, Maureen Clerc, Stéphanie Fleck, Laurent Bougrain. Can the MIQ-RS questionnaire be used to estimate the performance of a MI-based BCI?. 2018 Seventh Inter-national BCI Meeting, May 2018, Pacific Grove, United States. �hal-01889864�
Can the MIQ-RS questionnaire be used to estimate the
performance of a MI-based BCI?
S. Rimbert*1,2, N. Gayraud3, M. Clerc3, S. Fleck4, L. Bougrain2,1
1Inria, Villers-lès-Nancy, F-54600, France;
2Université de Lorraine, LORIA, UMR 7503, Vandœuvre-lès-Nancy, F-54000, France. 3Inria Sophia Antipolis-Méditerranée and Université Côte d’Azur, France.
4Université de Lorraine-PErSEUs EA 7312, Île du Saulcy Metz, F-57045, France.
*E-mail: sebastien.rimbert@inria.fr
Introduction:
Predicting a subject's ability to use the interface with good accuracy is one of the major issues in the motor Brain-Computer interface (BCI) domain. A few recent studies show that subjective questionnaires could be used to predict the performance of motor imagery (MI) based BCI. Indeed, the Kinesthetic and Visual Imagery Questionnaire (KVIQ), could allow a better predictability of BCI-illiterate cases [1]. Another more recent questionnaire called the Motor Imagery Questionnaire Revised-Second Edition (MIQ-RS) is a suitable option for examining MI ability [2]. In 2016, Marchesotti et al. found that the representation of subjective behaviour, calculated using the MIQ-RS questionnaire, and the control of the BCI were intimately linked [3]. However, in these studies [1, 3], the performance of the classifier was calculated for a right-hand MI versus a left-hand MI task. In this abstract, we classify between resting state and imagined movement, which is a relevant classification task in BCI research [4]. The aim of this study is to answer the following question for a resting state versus MI classification task: can the MIQ-RS be used to estimate the performance of an MI-based BCI?
Material, Methods and Results:
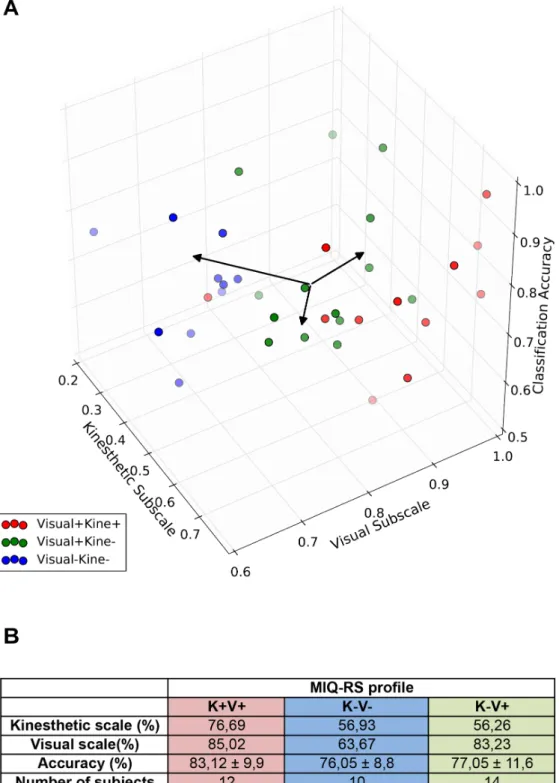
36 right-handed healthy subjects (12 females; aged 31.3 years ± 14.4) were tested for their perception level of their visual and kinesthetic MI ability via the MIQ-RS questionnaire. EEG signals were recorded with a Biosemi Active Two 32-channel EEG system during a MI task (i.e. a single closing of the right hand) in one session of 40 trials. The EEG signal was bandpassed using a Butterworth filter between 8 and 30 Hz and segmented into 3.5 second trials. A Riemannian-based Tangent Space classification method [5] coupled with a Logistic Regression classifier was used to generate classification results in a 4-fold cross validation scheme. We computed the correlation between the classification results and both the kinesthetic (K) and the visual scores (V). The recovered Pearson correlation coefficient was equal to ρ = 0.02, (p-value = 0.87) in the first comparison, and ρ = -0.12 (p-value = 0.47) in the second. Moreover, we performed a Principal Component Analysis over the aforementioned three features (Figure 1A) whose analysis produced no indication of any correlation between them. Finally, we observed 3 different profiles according to users’ MIQ-RS values (identified K+ and/or V+ if their score is over 70%, K- and/or V- otherwise). We computed the average accuracy of each class (Figure 1B) and performed Welch’s t-test to verify the statistical significance of the differences between the average classification results. We obtained the following p-values: 0.118 between K+V+ and K-V+; 0.714 between K+V+ and K-V-; and 0.048 between K-V- and K-V+. Finally, we computed the Event-Related Spectral Perturbation (ERSP) between 5-30 Hz within each group using the EEGlab toolbox and we again compared the differences between groups. The obtained p-values were all superior to 0.01.
Discussion:
Our results revealed no correlation between the classification results and the MIQ-RS scores, contrary to those suggested by [1, 3]. While the classification results and ERSPs differ upon grouping the subjects according to their MIQ-RS profiles, we found no statistical significance (at p-value < 0.01).
Significance:
Our results demonstrate that the MIQ-RS questionnaire cannot be used to estimate the performance of a MI-BCI based on distinguishing between resting state and right-hand MI tasks.
References
[1] A. Vuckovic, BA. Osuagwu, “Using a motor imagery questionnaire to estimate the performance of a Brain–Computer Interface based on object oriented motor imagery”, Clinical Neurophysiology, Vol 124, pp 1586-1595. 2013.
[2] A. J. Butler et al. “The Movement Imagery Questionnaire-Revised, Second Edition (MIQ-RS) Is a Reliable and Valid Tool for Evaluating Motor Imagery in Stroke Populations”, eCAM. 2012
[3] S. Marchesotti et al. “Quantifying the role of motor imagery in brain-machine interfaces”, Sci. Rep. 6. 2016.
[4]G. Townsend, B. Graimann, and G. Pfurtscheller, “Continuous EEG classification during motor imagery-simulation of an asynchronous BCI. IEEE Transactions on Neural Systems and Rehabilitation Engineering,” 12(2), 258-265. 2004
[5] A. Barachant, S. Bonnet, M. Congedo and C. Jutten, “Riemannian geometry applied to BCI classification” in LVA ICA. Springer, Berlin, Heidelberg, pp. 629-636. 2010.
Figure 1: (A) Principal Component Analysis performed over 36 right-handed healthy subjects for the classification accuracy, the kinesthetic subscale and the visual subscale. The explained variance ratio of each component is 41%, 34% and 25% (B) Kinesthetic scale, visual scale, accuracy and number of