HAL Id: hal-02543889
https://hal.univ-cotedazur.fr/hal-02543889
Submitted on 15 Apr 2020
HAL is a multi-disciplinary open access
archive for the deposit and dissemination of sci-entific research documents, whether they are pub-lished or not. The documents may come from teaching and research institutions in France or abroad, or from public or private research centers.
L’archive ouverte pluridisciplinaire HAL, est destinée au dépôt et à la diffusion de documents scientifiques de niveau recherche, publiés ou non, émanant des établissements d’enseignement et de recherche français ou étrangers, des laboratoires publics ou privés.
Unified Theory of Acceptance and Use of Technology 2
Model: Instrument Validation Study
Meggy Hayotte, Pierre Therouanne, Laura Gray, Karine Corrion, Fabienne
d’Arripe-Longueville
To cite this version:
Meggy Hayotte, Pierre Therouanne, Laura Gray, Karine Corrion, Fabienne d’Arripe-Longueville. The French eHealth Acceptability Scale Using the Unified Theory of Acceptance and Use of Technology 2 Model: Instrument Validation Study. Journal of Medical Internet Research, JMIR Publications, 2020, �10.2196/16520�. �hal-02543889�
Original Paper
The French eHealth Acceptability Scale Using the Unified Theory
of Acceptance and Use of Technology 2 Model: Instrument
Validation Study
Meggy Hayotte1, MSc; Pierre Thérouanne2, PhD; Laura Gray1, PhD; Karine Corrion1, PhD; Fabienne
d'Arripe-Longueville1, PhD
1Laboratoire Motricité Humaine Expertise Sport Santé, Université Côte d'Azur, Nice, France 2
Laboratoire d'Anthropologie et de Psychologie Cliniques, Cognitives et Sociales, Université Côte d'Azur, Nice, France Corresponding Author:
Meggy Hayotte, MSc
Laboratoire Motricité Humaine Expertise Sport Santé Université Côte d'Azur
261 Boulevard du Mercantour Nice, 06200 France Phone: 33 4 89 15 39 52 Email: meggy.hayotte@etu.univ-cotedazur.fr
Abstract
Background: Technology-based physical activity suggests new opportunities for public health initiatives. Yet only 45% of
technology interventions are theoretically based, and the acceptability mechanisms have been insufficiently studied. Acceptability and acceptance theories have provided interesting insights, particularly the unified theory of acceptance and use of technology 2 (UTAUT2). In several studies, the psychometric qualities of acceptability scales have not been well demonstrated.
Objective: The aim of this study was to adapt the UTAUT2 to the electronic health (eHealth) context and provide a preliminary
validation of the eHealth acceptability scale in a French sample.
Methods: In line with the reference validation methodologies, we carried out the following stages of validating the scale with
a total of 576 volunteers: translation and adaptation, dimensionality tests, reliability tests, and construct validity tests. We used confirmatory factor analysis to validate a 22-item instrument with 7 subscales: Performance Expectancy, Effort Expectancy, Social Influence, Facilitating Conditions, Hedonic Motivation, Price Value, and Habit.
Results: The dimensionality tests showed that the bifactor confirmatory model presented the best fit indexes: χ2173=434.86
(P<.001), χ2/df=2.51, comparative fit index=.97, Tucker-Lewis index=.95, and root mean square error of approximation=.053 (90% CI .047-.059). The invariance tests of the eHealth acceptability factor structure by sex demonstrated no significant differences between models, except for the strict model. The partial strict model demonstrated no difference from the strong model. Cronbach alphas ranged from .77 to .95 for the 7 factors. We measured the internal reliability with a 4-week interval. The intraclass correlation coefficients for each subscale ranged from .62 to .88, and there were no significant differences in the t tests from time 1 to time 2. Assessments for convergent validity demonstrated that the eHealth acceptability constructs were significantly and positively related to behavioral intention, usage, and constructs from the technology acceptance model and the theory of planned behavior.
Conclusions: The 22-item French-language eHealth acceptability scale, divided into 7 subscales, showed good psychometric
qualities. This scale is thus a valid and reliable tool to assess the acceptability of eHealth technology in French-speaking samples and offers promising avenues in research, clinical practice, and marketing.
(J Med Internet Res 2020;22(4):e16520) doi: 10.2196/16520
KEYWORDS
Introduction
Background
Technology-based interventions to promote healthy behavior have been an emerging field of research for the past 10 to 20 years [1,2]. Among the healthy behaviors that are promoted, technology-based physical activity has brought to light new opportunities for public health interventions [3]. Several studies have evaluated the prospects of technologies such as exergames and active videogames [4], virtual reality [5], wearable physical activity trackers [6], website-delivered physical activity interventions [7], mobile phone apps [8,9], and video conferencing [10]. Electronic health (eHealth) physical activity promotion technologies have been designed not only for healthy adults [8], but also for vulnerable people in health care contexts, including cancer survivors [11,12], those in need of treatment for overweight and obesity [13,14] or cardiac rehabilitation [15], and older people [16,17]. All these technologies are popular (ie, positive assessment by many), with promising and reported positive outcomes [11-17]. However, the phenomena of usage cessation and losses to follow-up (ie, the law of attrition) are common problems [18]. Moreover, only 45% of the technology interventions are theoretically based, and the acceptability mechanisms have been insufficiently studied [1,19].
Acceptability and acceptance theories have provided interesting insights [20,21] into why some tools are chosen, accepted, and used more than others. The literature on acceptability and acceptance has emerged in different fields (eg, ergonomics, social psychology, management science) [22]. However, the acceptability and acceptance concepts have not been formally defined [23], and the distinction between the two has been based on the temporality of usage [21]. Acceptability refers to the a priori perceived use, whereas acceptance refers to the actual use [22]. Based on the proposed definitions [23], we define acceptability in this paper as the psychological antecedents of the behavioral intention to use technology without experience of the system. In the field of social psychology, the theory of reasoned action and the theory of planned behavior (TPB) [24,25] hold that attitudes and representations determine behavioral intention and real behavior [22]. These theories are the foundation for the technology acceptance model (TAM) [26], the most frequently used model in health informatics [27]. Nevertheless, several extensions have been proposed—TAM2 [28] and TAM3 [29]—revealing that the original TAM was not optimal in eHealth [27]. The unified theory of acceptance and use of technology (UTAUT), particularly its extension, UTAUT2, is today the most complete model, as it combines theory of reasoned action, TAM, a motivational model, TPB, a combined TPB and TAM, a model of personal computer use, diffusion of innovations theory, and social cognitive theory [29-31]. The UTAUT2 comprises 26 items divided into 8 constructs: Performance Expectancy (PE, 3 items), Effort Expectancy (EE, 4 items), Social Influence (SI, 3 items), Facilitating Conditions (FC, 4 items), Hedonic Motivation (HM, 3 items), Price Value (PV, 3 items), Habit (HT, 3 items), and Behavioral Intention (BI, 3 items).
Acceptability assessments in several studies in eHealth contexts have been based on tools without or with only partially demonstrated psychometric qualities [32,33]. However, to ensure the quality of future research, it is necessary to have scales with validated psychometric qualities [34]. The UTAUT model can be considered as a relevant framework for assessing the acceptability of eHealth, particularly for patient-centered assessment [20]. Yet, for theoretically based technologies in the health and wellness field, only 2 studies have been based on the UTAUT model [1], and 2 were conducted in France [27]. The scarcity French studies [1,27] may be due to the absence of validated scales in French to evaluate acceptability. To our knowledge, validated scales in the French language have been based on the TAM model [35] or on other definitions of acceptability in which the concept of acceptability is merged with the definition of usability [22,36]. The UTAUT2 [31] has already been translated into other languages (eg, German [37], Turkish [38], and Portuguese [39]) and has proven its validity; however, the psychometric qualities of the scales have been only partially demonstrated.
Objective
The aims of this study were to adapt the UTAUT2 [31] to the eHealth context and to validate this version, which we called the eHealth acceptability scale, in French-speaking samples. This validated tool would allow for the development of further studies in this field.
Methods
Study Design
In line with the guidelines for scale validation from Vallerand et al [40] and Boateng et al [41], we conducted successive stages: translation and adaptation, dimensionality tests, reliability tests, and construct validity tests.
We managed the administration of the scale using LimeSurvey CE, version 2.06+ (LimeSurvey CE). We distributed the scale link by email or face-to-face at the end of students’ courses. We also distributed the link by email to health professionals and adults registered for adapted physical activity. In addition, we posted the link online via social media networks.
Study Population
We recruited participants in various categories of the general population: students (studying sports, psychology, management, and computer science at a university in the South of France), health professionals (in the field of obesity), and adults with health conditions (ie, diabetes, cardiovascular disease, and obesity) registered for adapted physical activity sessions. To conduct the successive stages of validation, we divided the participants into 5 sample groups.
This study was approved by the French National Commission for Information Technology and Civil Liberties (authorization no: UCA-E18-00), and all participants gave their electronic consent before participation.
Measures
Sociodemographics
The sociodemographic information, provided by all participants after they had completed the scale items, included their sex, year of birth, education level, and professional status.
eHealth Acceptability Scale
The UTAUT2 [31], originally developed in English in the field of mobile internet use, has 2 sections, 1 for the UTAUT2 scale comprising 26 items divided into 8 constructs, and the other for assessing the usage frequency of various apps for mobile internet. According to the definition we chose, acceptability corresponds to the psychological antecedents of the behavioral intention to use technology without experience of the system. Based on this definition, we excluded BI from the eHealth acceptability scale.
We produced this French adaptation of the UTAUT2 scale using the back-translation method [42]. Original items were translated individually by 4 researchers in the field of psychology and compiled to obtain a single French version. This French version was back-translated by 4 researchers unaware of the original version. The back-translators were subsequently asked to compare their own translation with the original to specify the differences. Differences were noted for 2 items, which were adjusted with the same procedure until all back-translators concluded that there was no difference. We then used a committee approach to replace mobile internet with a global expression that would include all the eHealth apps. We chose information and communication technologies for health, abbreviated as ICT for health, in reference to the wording used in a similar French questionnaire [36].
The preliminary version of the eHealth acceptability scale comprised 23 items divided into 7 subscales: PE (3 items), EE (4 items), SI (3 items), FC (4 items), HM (3 items), PV (3 items), and HT (3 items). Participants answered on a 7-point scale with labeled anchors ranging from 1, “strongly disagree,” to 7, “strongly agree.” We chose this 7-point scale because the participants were not familiar with the study context [43]. We administered this preliminary version of the eHealth acceptability scale to samples 1 to 3 and its adjusted form after the first confirmatory factor analysis (CFA) to samples 4 and 5. Sample 5 participants completed the scale a second time after 4 weeks for the test-retest reliability assessments.
Behavioral Intention
BI comes from the original UTAUT2 [31]. The 3 items were translated following the same procedure described above. The participants in all samples answered on a 7-point scale with labeled anchors ranging from 1, “strongly disagree,” to 7, “strongly agree.” BI was theoretically positively related to the constructs of the eHealth acceptability scale.
Usage
We measured usage in all samples as the frequency of eHealth technology use on a 7-point scale ranging from 1, “never,” to 7, “many times per day,” for 5 technologies: mobile health apps, forums or social networks for health, videos for health management, exergames or active video games, and health
trackers. Usage was theoretically positively related to the constructs of the eHealth acceptability scale, especially FC and HT [31].
Technology Acceptance Model Constructs
Perceived Ease of Use (PEOU, 5 items), extracted from the TAM [26,35], was theoretically positively related to the constructs of the eHealth acceptability scale, especially EE [30]. This subscale was measured on a 7-point scale with labeled anchors ranging from 1, “strongly disagree,” to 7, “strongly agree.” Only the sample 4 participants completed this subscale to test for convergent validity.
Theory of Planned Behavior Constructs
Subjective Norms (SN, 3 items) and Perceived Behavioral Control (PBC, 5 items) extracted from the TPB [44,45] were theoretically positively related to the constructs of the eHealth acceptability scale, especially SI and FC [30]. These subscales were measured on 7-point scales with labeled anchors ranging from 1, “strongly disagree,” to 7, “strongly agree.” Only the sample 4 participants completed these subscales to test for convergent validity.
Statistical Analyses
We performed all statistical analyses with IBM SPSS version 23 (IBM Corporation) and IBM SPSS Amos version 23 (IBM Corporation). We examined the missing data trends. The cutoff for an acceptable percentage of missing data has not been well established in the literature [46]. However, 5% is considered inconsequential [47], and the risk of statistical bias is considered when the rate is higher than 10% [48]. In our global sample, the missing rate was under 10%. For structural equation modeling, the maximum likelihood estimation and the multiple imputation for handling missing data presented close to equivalent good properties [49]. We applied the maximum likelihood estimations (considered the standard for structural equation models [46]) to be used in Amos v23.
Tests of Dimensionality
We ran tests of dimensionality using maximum likelihood estimation CFA in structural equation modeling according to several models [50]. We used the following indicators to assess competence of the model fit [51-54]: chi-square (significant values P≤.05), chi-square over degrees of freedom (significant values ≤3.00), comparative fit index (CFI; value >.90), Tucker-Lewis index (TLI; value >.90), root mean square error of approximation (RMSEA; value <.08), and the 90% confidence interval of RMSEA (ranging from .00 to .08). We computed invariance of the eHealth acceptability scale between the sexes according to Gregorich’s methodology [55]. In the CFA framework, we tested a hierarchy of hypotheses to increasingly constrain the model. These hypotheses included configural (ie, no constraint), metric (ie, equal loads), strong (ie, equal covariances), and strict (ie, equal residuals) factorial invariance multigroup comparisons [55]. In addition to the previous indicators, we used the Akaike information criterion, expected cross-validation index, delta χ²/df (Δχ²/df), delta CFI (ΔCFI), and delta RMSEA (ΔRMSEA). Nonsignificant Δχ²/df,
CFI differences <.01, and RMSEA differences <.015 indicated that the invariance hypothesis was not rejected [51,56].
Tests of Reliability
We calculated Cronbach alpha coefficients [57] to assess the internal consistency of each subscale; a value >.70 is considered satisfactory and a value >.60 is considered marginally acceptable [58]. We measured the test-retest reliability twice with an acceptable interval of 4 weeks [59] and a minimum sample size of 50 as recommended [60]. Data analyses involved the calculation of intraclass correlation coefficients (ICCs), the 95% confidence interval of the ICCs, and paired-sample t tests. We expected ICCs >.60 and the absence of significant differences in the t tests [40].
Tests of Construct Validity
We used Pearson correlation coefficients to measure the association between variables for the analysis of convergent
validity. A significant correlation of .30 between the scale and each of the other theoretically appropriate measures was required [61].
Results
Study Population
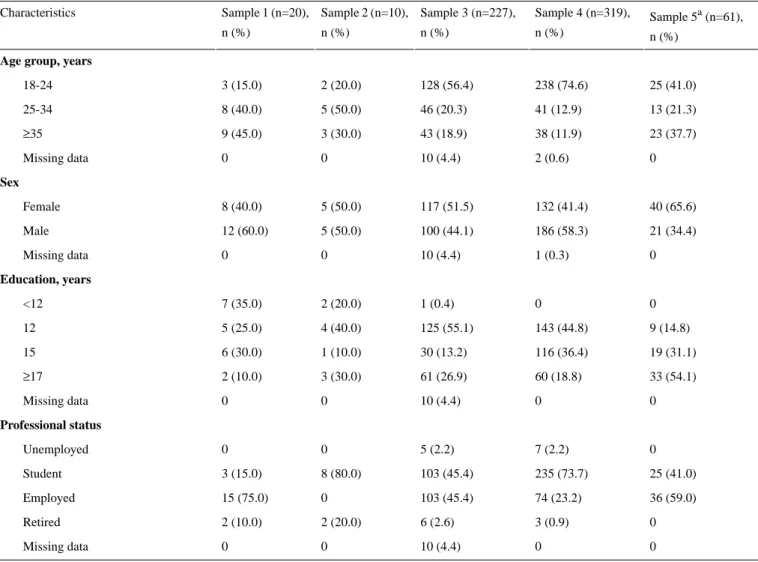
To conduct the successive stages of validation, we divided the participants into 5 samples. Samples 1 (n=20), 2 (n=10), 3 (n=227), and 4 (n=319) were independent groups, and sample 5 (n=61) was a subgroup of sample 4. The global sample included 576 volunteers, mainly students (n=349, 60.6%), with 53.5% men (n=303) and a mean age of 26.8 (SD 10.9) years. We excluded 18 volunteers because they had never used eHealth technology. Table 1 presents detailed participant characteristics for each sample.
Table 1. Sociodemographic characteristics in each sample (N=576).
Sample 5a (n=61), n (%) Sample 4 (n=319), n (%) Sample 3 (n=227), n (%) Sample 2 (n=10), n (%) Sample 1 (n=20), n (%) Characteristics
Age group, years
25 (41.0) 238 (74.6) 128 (56.4) 2 (20.0) 3 (15.0) 18-24 13 (21.3) 41 (12.9) 46 (20.3) 5 (50.0) 8 (40.0) 25-34 23 (37.7) 38 (11.9) 43 (18.9) 3 (30.0) 9 (45.0) ≥35 0 2 (0.6) 10 (4.4) 0 0 Missing data Sex 40 (65.6) 132 (41.4) 117 (51.5) 5 (50.0) 8 (40.0) Female 21 (34.4) 186 (58.3) 100 (44.1) 5 (50.0) 12 (60.0) Male 0 1 (0.3) 10 (4.4) 0 0 Missing data Education, years 0 0 1 (0.4) 2 (20.0) 7 (35.0) <12 9 (14.8) 143 (44.8) 125 (55.1) 4 (40.0) 5 (25.0) 12 19 (31.1) 116 (36.4) 30 (13.2) 1 (10.0) 6 (30.0) 15 33 (54.1) 60 (18.8) 61 (26.9) 3 (30.0) 2 (10.0) ≥17 0 0 10 (4.4) 0 0 Missing data Professional status 0 7 (2.2) 5 (2.2) 0 0 Unemployed 25 (41.0) 235 (73.7) 103 (45.4) 8 (80.0) 3 (15.0) Student 36 (59.0) 74 (23.2) 103 (45.4) 0 15 (75.0) Employed 0 3 (0.9) 6 (2.6) 2 (20.0) 2 (10.0) Retired 0 0 10 (4.4) 0 0 Missing data
aSample 5 was a subsample of sample 4.
Translation and Adaptation
We performed the first content clarity analysis on sample 1 (n=20), which revealed an acceptable clarity score (mean range from 4.40 to 7.00; mean 6.22, SD 0.71). Only 3 items (ie, EE2, SI2, and SI3) obtained a score of less than 5, which we rephrased
according to participants’ suggestions. We performed a second content clarity analysis on sample 2 (n=10) regarding the 3 rephrased items. The clarity score increased for 2 items (SI2: mean range 4.40 to 6.20; SI3: mean range 4.90 to 6.20) but decreased for the third (EE2: mean range 4.65 to 3.30). We retained the 2 items with increased clarity scores in their
rephrased form and the item with a decreased clarity score in its original translated wording. Multimedia Appendix 1 shows the preliminary pool of 23 items with their mean clarity scores.
Tests of Dimensionality
We conducted a first maximum likelihood CFA on sample 3 (n=227) with the 23-item and 7-factor model. Standardized factor loadings were all higher than the recommended value of .50 [62], except for item FC4, for which the factor loading was .27. As a result, we removed item FC4. We conducted a second CFA using sample 4 (n=319) with the 22-item (ie, without FC4 item) and 7-factor correlated model (χ2188=471.80, P<.001). Fit
indexes were as follows: χ²/df=2.51, CFI=.94, TLI=.91, and RMSEA=.069 (90% CI 0.061-0.077), revealing an acceptable
model fit, with good standardized factor loadings for all items (ie, ≥0.63).
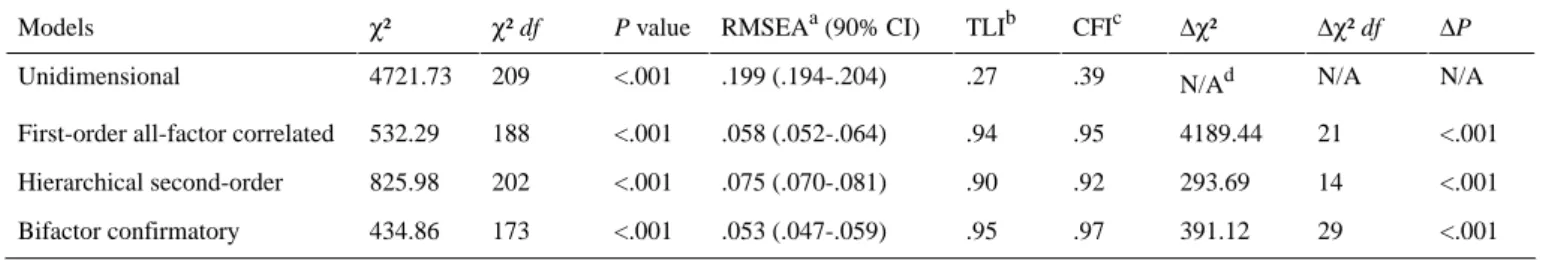
Based on the recommendations of Myers et al [50], we examined several models to assess the dimensionality of the scale, using samples 3 and 4 merged (n=546). Table 2 presents model fit indexes for each model. First, the unidimensional model did not present good fit indexes. Second, the first-order all-factor correlated model presented good fit indexes, as previously demonstrated. Third, the hierarchical second-order model presented acceptable fit indexes. Fourth, the bifactor confirmatory model presented the best fit indexes: χ²173=434.86
(P<.001), χ²/df=2.51, CFI=.97, TLI=.95, and RMSEA=.053 (90% CI .047-.059). These results sustained the possibility of extracting a global acceptability score from the scale.
Table 2. Fit indexes of the structural equation models (n=546).
ΔP Δχ² df Δχ² CFIc TLIb RMSEAa (90% CI) P value χ² df χ² Models N/A N/A N/Ad .39 .27 .199 (.194-.204) <.001 209 4721.73 Unidimensional <.001 21 4189.44 .95 .94 .058 (.052-.064) <.001 188 532.29 First-order all-factor correlated
<.001 14 293.69 .92 .90 .075 (.070-.081) <.001 202 825.98 Hierarchical second-order <.001 29 391.12 .97 .95 .053 (.047-.059) <.001 173 434.86 Bifactor confirmatory
aRMSEA: root mean square error of approximation. bTLI: Tucker-Lewis index.
cCFI: comparative fit index. dN/A: not applicable.
We tested the invariance of the scale factorial structure following Gregorich’s recommendations [55], with samples 3 and 4 merged (n=535; 11 without sex information). The invariance tests were based on multigroup comparisons: female group (n=249) and male group (n=286). Each group presented good fit indexes for the CFA model (Table 3). We tested invariance in the 22-item 7-factor correlated model. Dimensional, metric,
strong, and strict models presented good fit indexes (ie, CFI, TLI, and RMSEA) with significant chi-square P values (ie,
P<.001). No significant differences between models were
reported, except for the strict model (Table 3). A partial strict model, unconstrained for error of measurement for items EE2 and HM1, showed good fit indexes with no significant difference from the strong model.
Table 3. Fit indexes of structural modeling to assess sex invariance (n=535). ΔRMSEA ΔCFI ΔP Δχ² df Δχ² AICe ECVId CFIc TLIb RMSEAa P value χ² df χ² Models N/A N/A N/A N/A N/Af 601.42 2.11 .94 .93 .067 <.001 188 427.42 Male (n=286) N/A N/A N/A N/A N/A 504.71 2.04 .96 .96 .055 <.001 188 330.71 Female (n=249) N/A N/A N/A N/A N/A 1018.12 1.91 .95 .94 .044 <.001 376 758,12 Dimensionalg 0.001 0 .520 13 12.09 1004.21 1.88 .95 .94 .043 <.001 389 770.21 Metrich 0.001 0 .304 28 31.30 979.51 1.84 .95 .95 .042 <.001 417 801.51 Strongi 0.002 0.012 <.001 22 114.26 1049.77 1.97 .94 .94 .045 <.001 439 915.77 Strictj 0.002 0.011 .370 41 43.40 1015.86 1.91 .94 .94 .044 <.001 438 908.84 Partial strictk a
RMSEA: root mean square error of approximation.
bTLI: Tucker-Lewis index. c
CFI: comparative fit index.
dECVI: expected cross-validation index. e
AIC: Akaike information criterion.
fN/A: not applicable. g No invariance. hEqual loads. i Equal covariances. jEqual residuals. k
Equal residuals except for items EE2 and HM1.
Tests of Reliability
Cronbach alphas ranged from .77 to .95 in samples 3 and 4 (n=546) for the 7 eHealth acceptability factors (ie, αPE=.84;
αEE=.88; αSI=.95; αFC=.78; αHM=.92; αPV=.86; αHT=.77) and
were .93 for BI and .60 for usage.
We measured test-retest reliability in sample 5 (n=61) twice with an acceptable interval of 4 weeks [59]. Table 4 presents the results of the ICC and t tests. The ICCs for each construct ranged from .62 to .88. Thus, there were no significant differences in the t tests from time 1 to time 2.
Table 4. Descriptive statistics for the test-retest reliability in sample 5 (n=61).
P value ICCb (95% CI) P value t testa Score, mean (SD) Items Time 2 Time 1 <.001 .88 (.80-.93) .09 t60=1.74 4.46 (1.40) 4.67 (1.45) Performance Expectancy <.001 .74 (.57-.84) .23 t60=–1.22 5.60 (1.16) 5.43 (1.14) Effort Expectancy <.001 .77 (.62-.86) .39 t60=0.87 3.52 (1.66) 3.67 (1.39) Social Influence <.001 .62 (.38-.78) .97 t60=–0.04 5.83 (1.09) 5.82 (0.92) Facilitating Conditions <.001 .80 (.67-.88) .65 t60=0.46 5.10 (1.21) 5.16 (1.29) Hedonic Motivation <.001 .62 (.36-.77) .83 t60=–0.22 4.45 (1.11) 4.42 (1.14) Price Value <.001 .77 (.61-.86) .94 t60=–0.07 3.28 (1.40) 3.27 (1.35) Habit aPaired-sample t test.
bICC: intraclass correlation coefficient.
Tests of Construct Validity
We assessed convergent validity using Pearson correlation coefficients in sample 4 (n=319). BI was related to the eHealth acceptability subscales in the expected directions, even though the effect sizes were small for EE, FC, and PV. Usage was
related to HT as expected, but not with FC. PEOU, SN, and PBC were related to the eHealth acceptability subscales in the expected directions. We observed additional significant correlation coefficients between constructs. Table 5 presents the complete matrix.
Table 5. Matrix of Pearson correlations in sample 4 (n=319)a,b. SNm PBCl PEOUk Usage BIj HTi PVh HMg FCf SIe EEd PEc Items N/A N/A N/A N/A N/A N/A N/A N/A N/A N/A N/A N/An PE N/A N/A N/A N/A N/A N/A N/A N/A N/A N/A N/A .33 EE N/A N/A N/A N/A N/A N/A N/A N/A N/A N/A .14 .54 SI N/A N/A N/A N/A N/A N/A N/A N/A N/A .12 .62 .12 FC N/A N/A N/A N/A N/A N/A N/A N/A .40 .21 .47 .40 HM N/A N/A N/A N/A N/A N/A N/A .28 .28 .19 .23 .24 PV N/A N/A N/A N/A N/A N/A .22 .30 N/A .54 .21 .57 HT N/A N/A N/A N/A N/A .65 .22 .45 .22 .52 .27 .58 BI N/A N/A N/A N/A .46 .50 N/A .28 .12 .30 .24 .43 Usage N/A N/A N/A .17 .26 .19 .31 .36 .59 .15 .64 .21 PEOU N/A N/A .51 .32 .41 .31 .30 .30 .49 .22 .43 .31 PBC N/A .31 .24 .36 .55 .52 .25 .24 .13 .71 .13 .47 SN
aSignificant correlations between subscales (ie, >.30) [61] are shown in italics. bShows only correlations with P<.05.
cPE: Performance Expectancy. dEE: Effort Expectancy. eSI: Social Influence. fFC: Facilitating Conditions. gHM: Hedonic Motivation. hPV: Price Value. iHT: Habit.
jBI: Behavioral Intention. kPEOU: Perceived Ease of Use. lPBC: Perceived Behavioral Control. mSN: Subjective Norms.
nN/A: not applicable.
Discussion
Principal Findings
This study aimed to fill a gap in the acceptability literature by providing a validated scale based on the UTAUT2 model [31] that would be suitable for eHealth contexts in French-speaking samples. The eHealth acceptability scale comprised 22 items divided into 7 subscales: PE (3 items), EE (4 items), SI (3 items), FC (3 items), HM (3 items), PV (3 items), and HT (3 items). The dimensionality tests showed that the first-order all-factor correlated model and the bifactor confirmatory model had good fit indexes. The results confirmed the possibility of both using the subscales individually and extracting a global score of acceptability. The internal consistency evaluated by Cronbach alphas was considered satisfactory [57] and thus was confirmed. The ICCs for each subscale were above .60 and there were no significant differences in the t test over a 4-week period. These results demonstrated the temporal stability of the eHealth acceptability scale. Although it might seem important to attain strict factorial invariance, practical experience suggests that this is almost unachievable [55]. The partial strict factorial invariance pointed to the sex invariance in our analysis. This conclusion
was one of the major findings, as it confirms that the eHealth acceptability scale can be used in male and female French-speaking samples.
Convergent validity assessments showed that subscales of the eHealth acceptability scale were significantly positively related to BI, usage, and the PEOU construct from the TAM [26], and significantly positively related to the SN and PCB constructs from the TPB [44]. These preliminary results need to be confirmed in future studies.
The strength of this scale validation was that it followed all the steps recommended by Boateng [41].
Limitations
Some limitations must nevertheless be acknowledged. One of these limitations, as in all rating scales, is the self-reported nature of the responses, which can be biased based on social desirability [63]. Another limitation is the homogeneity of the samples we used. Most of the participants were young and students. Few participants with low socioeconomic status were included, which limited generalizability. In populations that are not familiar with eHealth tools, it may be necessary to deliver specific education, notably by providing a description of the terms used. In addition, given the age distribution of our sample
(ie, centered on ages 18-34 years), we could not test the age invariance. Furthermore, the simultaneous modification of the language (ie, into French) and the context (ie, adaptation to eHealth) may have led to potential interactions and is a limitation. The study would probably have been stronger if we had validated a French-language instrument before changing the context.
Comparison With Prior Work
Compared with the English-language UTAUT2 model [31], the French eHealth acceptability scale comprised 22 items divided into 7 subscales: PE (3 items), EE (4 items), SI (3 items), FC (3 items), HM (3 items), PV (3 items), and HT (3 items), according to our analyses. We removed item FC4 for its inconsistency; the low loading was also observed to a lesser extent in the German translation [37], although not removed. The sex invariance demonstrated in our analysis was not provided in the original version [31], nor in the other translations [37,38].
Future Directions
In future studies, it will be necessary to test the constructs of the eHealth acceptability scale, which was based on the
UTAUT2 model, in French samples and to estimate the explained variance in BI and usage. In addition, evaluation of age invariance will be necessary. The suggested adaptation to the eHealth context could also be replicated in other languages. Specifically, an English validation of the eHealth acceptability scale would be of interest in order to provide a common tool across French- and English-speaking samples. This scale could be used in future research to identify acceptability correlates in different contexts. It could also be used in clinical practice before implementing a new technology in health care or in the field of marketing as new technologies are developed.
Conclusions
We designed a 22-item French-language eHealth acceptability scale, divided into 7 subscales. The scale demonstrated good psychometric qualities (ie, reliability, dimensionality, validity). With this preliminary validation, the scale can be used with men and women to assess the acceptability of eHealth technology in French-speaking samples and offers promising avenues in research, clinical practice, and marketing.
Acknowledgments
The authors sincerely thank Marie Barralis, Lise Arena, Valentin Montmirail, and Dirk Steiner for their contributions to the translations; the Centre Spécialisé Obésité PACA Est, Faculty of Physical Education and Sports Studies of Toulon University; and Valentine Filleul and Raphaëlle Ladune for their valuable assistance in collecting the data. We also thank all the participants. This study was supported by the French government, managed by the National Agency of Research as part of the UCAJEDI Future Investments project, reference number ANR-15-IDEX-01, as well as a PhD grant to MH from the Région Sud Provence-Alpes Côte d’Azur, France, and cosupported by the association Azur Sport Santé.
The institutions funding this work played no role in the study design; the collection, analysis, or interpretation of the data; writing the manuscript; or the decision to submit the paper for publication.
Conflicts of Interest
None declared.
Multimedia Appendix 1
Preliminary version of the eHealth acceptability scale and adapted items of the UTAUT2. [DOCX File , 34 KB-Multimedia Appendix 1]
References
1. Orji R, Moffatt K. Persuasive technology for health and wellness: state-of-the-art and emerging trends. Health Informatics J 2018 Mar;24(1):66-91. [doi: 10.1177/1460458216650979] [Medline: 27245673]
2. Lupton D. Health promotion in the digital era: a critical commentary. Health Promot Int 2015 Mar;30(1):174-183. [doi: 10.1093/heapro/dau091] [Medline: 25320120]
3. Lewis BA, Napolitano MA, Buman MP, Williams DM, Nigg CR. Future directions in physical activity intervention research: expanding our focus to sedentary behaviors, technology, and dissemination. J Behav Med 2017 Feb;40(1):112-126. [doi: 10.1007/s10865-016-9797-8] [Medline: 27722907]
4. Sween J, Wallington SF, Sheppard V, Taylor T, Llanos AA, Adams-Campbell LL. The role of exergaming in improving physical activity: a review. J Phys Act Health 2014 May;11(4):864-870 [FREE Full text] [doi: 10.1123/jpah.2011-0425] [Medline: 25078529]
5. Howard MC. A meta-analysis and systematic literature review of virtual reality rehabilitation programs. Comput Hum Behav 2017 May;70:317-327. [doi: 10.1016/j.chb.2017.01.013]
6. Bunn JA, Navalta JW, Fountaine CJ, Reece JD. Current state of commercial wearable technology in physical activity monitoring 2015-2017. Int J Exerc Sci 2018;11(7):503-515 [FREE Full text] [Medline: 29541338]
7. Vandelanotte C, Spathonis KM, Eakin EG, Owen N. Website-delivered physical activity interventions a review of the literature. Am J Prev Med 2007 Jul;33(1):54-64. [doi: 10.1016/j.amepre.2007.02.041] [Medline: 17572313]
8. Jee H. Review of researches on smartphone applications for physical activity promotion in healthy adults. J Exerc Rehabil 2017 Feb;13(1):3-11 [FREE Full text] [doi: 10.12965/jer.1732928.464] [Medline: 28349027]
9. Mollee JS, Middelweerd A, Kurvers RL, Klein MCA. What technological features are used in smartphone apps that promote physical activity? A review and content analysis. Pers Ubiquit Comput 2017 Jul 5;21(4):633-643. [doi:
10.1007/s00779-017-1023-3]
10. Hakala S, Rintala A, Immonen J, Karvanen J, Heinonen A, Sjögren T. Effectiveness of physical activity promoting technology-based distance interventions compared to usual care. Systematic review, meta-analysis and meta-regression. Eur J Phys Rehabil Med 2017 Dec;53(6):953-967. [doi: 10.23736/S1973-9087.17.04585-3] [Medline: 28466628] 11. Gell NM, Grover KW, Humble M, Sexton M, Dittus K. Efficacy, feasibility, and acceptability of a novel technology-based
intervention to support physical activity in cancer survivors. Support Care Cancer 2017 Apr;25(4):1291-1300. [doi: 10.1007/s00520-016-3523-5] [Medline: 27957621]
12. Rabin C, Dunsiger S, Ness KK, Marcus BH. Internet-based physical activity intervention targeting young adult cancer survivors. J Adolesc Young Adult Oncol 2011 Dec;1(4):188-194 [FREE Full text] [doi: 10.1089/jayao.2011.0040] [Medline: 23610737]
13. Raaijmakers LCH, Pouwels S, Berghuis KA, Nienhuijs SW. Technology-based interventions in the treatment of overweight and obesity: a systematic review. Appetite 2015 Dec;95:138-151. [doi: 10.1016/j.appet.2015.07.008] [Medline: 26165415] 14. Chaplais E, Naughton G, Thivel D, Courteix D, Greene D. Smartphone interventions for weight treatment and behavioral change in pediatric obesity: a systematic review. Telemed J E Health 2015 Oct;21(10):822-830. [doi: 10.1089/tmj.2014.0197] [Medline: 26290954]
15. Beatty AL, Fukuoka Y, Whooley MA. Using mobile technology for cardiac rehabilitation: a review and framework for development and evaluation. J Am Heart Assoc 2013;2(6):e000568 [FREE Full text] [doi: 10.1161/JAHA.113.000568] [Medline: 24185949]
16. Muellmann S, Forberger S, Möllers T, Bröring E, Zeeb H, Pischke CR. Effectiveness of eHealth interventions for the promotion of physical activity in older adults: a systematic review. Prev Med 2018 Mar;108:93-110. [doi:
10.1016/j.ypmed.2017.12.026] [Medline: 29289643]
17. Valenzuela T, Okubo Y, Woodbury A, Lord SR, Delbaere K. Adherence to technology-based exercise programs in older adults: a systematic review. J Geriatr Phys Ther 2018;41(1):49-61. [doi: 10.1519/JPT.0000000000000095] [Medline: 27362526]
18. Eysenbach G. The law of attrition. J Med Internet Res 2005;7(1):e11 [FREE Full text] [doi: 10.2196/jmir.7.1.e11] [Medline: 15829473]
19. Petit A, Cambon L. Exploratory study of the implications of research on the use of smart connected devices for prevention: a scoping review. BMC Public Health 2016 Dec 11;16:552. [doi: 10.1186/s12889-016-3225-4] [Medline: 27401769] 20. Harst L, Lantzsch H, Scheibe M. Theories predicting end-user acceptance of telemedicine use: systematic review. J Med
Internet Res 2019 May 21;21(5):e13117 [FREE Full text] [doi: 10.2196/13117] [Medline: 31115340]
21. Bobillier Chaumon ME. [The situated acceptance of ICT in/for the activity: towards a clinical use]. Psychol Travail Organ 2016 Mar;22(1):4-21. [doi: 10.1016/j.pto.2016.01.001]
22. Alexandre B, Reynaud E, Osiurak F, Navarro J. Acceptance and acceptability criteria: a literature review. Cogn Technol Work 2018 Jan 24;20(2):165-177. [doi: 10.1007/s10111-018-0459-1]
23. Adell E, Varhalyi A, Nilsson L. The definition of acceptance and acceptability. In: Horberry T, Regan MA, Stevens A, editors. Driver Acceptance of New Technology: Theory, Measurement and Optimisation. London, UK: CRC Press; 2018. 24. Fishbein M, Ajzen I. Belief, Attitude, Intention, And Behavior: An Introduction To Theory And Research. Reading, MA:
Addison-Wesley; 1975.
25. Ajzen I, Fishbein M. Understanding Attitudes and Predicting Social Behavior. Englewood Cliffs, NJ: Prentice-Hall; 1980. 26. Davis FD. Perceived usefulness, perceived ease of use, and user acceptance of information technology. MIS Q 1989
Sep;13(3):319. [doi: 10.2307/249008]
27. Rahimi B, Nadri H, Lotfnezhad Afshar H, Timpka T. A systematic review of the technology acceptance model in health informatics. Appl Clin Inform 2018 Dec;9(3):604-634 [FREE Full text] [doi: 10.1055/s-0038-1668091] [Medline: 30112741] 28. Venkatesh V, Davis FD. A theoretical extension of the technology acceptance model: four longitudinal field studies. Manage
Sci 2000 Feb;46(2):186-204. [doi: 10.1287/mnsc.46.2.186.11926]
29. Venkatesh V, Bala H. Technology acceptance model 3 and a research agenda on interventions. Decis Sci 2008 May;39(2):273-315. [doi: 10.1111/j.1540-5915.2008.00192.x]
30. Chang A. UTAUT and UTAUT 2: a review and agenda for future research. Winners 2012 Sep 28;13(2):10. [doi: 10.21512/tw.v13i2.656]
31. Venkatesh V, Thong JYL, Xu X. Consumer acceptance and use of information technology: extending the unified theory of acceptance and use of technology. MIS Q 2012;36(1):157. [doi: 10.2307/41410412]
32. Direito A, Tooley M, Hinbarji M, Albatal R, Jiang Y, Whittaker R, et al. Tailored daily activity: an adaptive physical activity smartphone intervention. Telemed J E Health 2019 May 07. [doi: 10.1089/tmj.2019.0034] [Medline: 31063038]
33. Schneider KL, Ferrara J, Lance B, Karetas A, Druker S, Panza E, et al. Acceptability of an online health videogame to improve diet and physical activity in elementary school students: “Fitter Critters”. Games Health J 2012 Aug;1(4):262-268 [FREE Full text] [doi: 10.1089/g4h.2012.0009] [Medline: 24761317]
34. Howard MC, Jayne BS. An analysis of more than 1,400 articles, 900 scales, and 17 years of research: the state of scales in cyberpsychology, behavior, and social networking. Cyberpsychol Behav Soc Netw 2015 Mar;18(3):181-187. [doi: 10.1089/cyber.2014.0418] [Medline: 25751050]
35. Février F, Jamet E, Rouxel G. Quel outil d'évaluation de l'acceptabilité des nouvelles technologies pour des études francophones? New York, NY: ACM Press; 2008 Presented at: 20th Conference on l'Interaction Homme-Machine; September 2-5, 2008; Metz, France p. 199-204. [doi: 10.1145/1512714.1512753]
36. Brangier É, Hammes S. [How to measure the human-technology-organization relationship?]. Perspect Interdisc Travail Santé 2007;9(2):71-78. [doi: 10.4000/pistes.1466]
37. Harborth D, Pape S. German translation of the unified theory of acceptance and use of technology 2 (UTAUT2) questionnaire. SSRN J 2018 Mar 28. [doi: 10.2139/ssrn.3147708]
38. Yilmaz B, Kavanoz S. The validity and reliability of Turkish version of unified theory of acceptance and use of technology. J Turk Stud 2017 Jan 01;12(32):127-146. [doi: 10.7827/TurkishStudies.12064]
39. Macedo IM. Predicting the acceptance and use of information and communication technology by older adults: an empirical examination of the revised UTAUT2. Comput Hum Behav 2017 Oct;75:935-948. [doi: 10.1016/j.chb.2017.06.013] 40. Vallerand RJ. Toward a methodology for the transcultural validation of psychological questionnaires: implications for
research in the French language. Can Psychol 1989;30(4):662-680. [doi: 10.1037/h0079856]
41. Boateng GO, Neilands TB, Frongillo EA, Melgar-Quiñonez HR, Young SL. Best practices for developing and validating scales for health, social, and behavioral research: a primer. Front Public Health 2018;6:149 [FREE Full text] [doi: 10.3389/fpubh.2018.00149] [Medline: 29942800]
42. Brislin RW. The wording and translation of research instruments. In: Lonner WJ, Berry JW, editors. Field Methods in Cross-Cultural Research. Thousand Oaks, CA: Sage Publications, Inc; 1986:137-164.
43. Chyung SYY, Roberts K, Swanson I, Hankinson A. Evidence-based survey design: the use of a midpoint on the Likert scale. Perform Improv 2017 Nov 20;56(10):15-23. [doi: 10.1002/pfi.21727]
44. Ajzen I. The theory of planned behavior. Organ Behav Hum Decis Processes 1991 Dec;50(2):179-211. [doi: 10.1016/0749-5978(91)90020-T]
45. Gagné C, Godin G. Les Théories Sociales Cognitives: Guide pour la Mesure des Variables et le Développement de Questionnaire. Sainte-Foy, QC: Groupe de recherche sur les aspects psychosociaux de la santé, Université Laval; 1999. 46. Dong Y, Peng CJ. Principled missing data methods for researchers. Springerplus 2013 Dec;2(1):222 [FREE Full text] [doi:
10.1186/2193-1801-2-222] [Medline: 23853744]
47. Schafer JL. Multiple imputation: a primer. Stat Methods Med Res 1999 Mar;8(1):3-15. [Medline: 10347857]
48. Bennett DA. How can I deal with missing data in my study? Aust N Z J Public Health 2001 Oct;25(5):464-469. [Medline: 11688629]
49. Allison PD. Missing data techniques for structural equation modeling. J Abnorm Psychol 2003 Nov;112(4):545-557. [doi: 10.1037/0021-843X.112.4.545] [Medline: 14674868]
50. Myers ND, Martin JJ, Ntoumanis N, Celimli S, Bartholomew KJ. Exploratory bifactor analysis in sport, exercise, and performance psychology: a substantive-methodological synergy. Sport Exerc Perform Psychol 2014;3(4):258-272. [doi: 10.1037/spy0000015]
51. Byrne BM. Factor analytic models: viewing the structure of an assessment instrument from three perspectives. J Pers Assess 2005 Aug;85(1):17-32. [doi: 10.1207/s15327752jpa8501_02] [Medline: 16083381]
52. Chen F, Curran PJ, Bollen KA, Kirby J, Paxton P. An empirical evaluation of the use of fixed cutoff points in RMSEA test statistic in structural equation models. Sociol Methods Res 2008 Jan 01;36(4):462-494 [FREE Full text] [doi:
10.1177/0049124108314720] [Medline: 19756246]
53. Hoyle RH, Panter AT. Writing about structural equation models. In: Hoyle RH, editor. Structural Equation Modeling: Concepts, Issues, and Applications. Thousand Oaks, CA: Sage Publications, Inc; 1995:158-176.
54. Hu L, Bentler PM. Cutoff criteria for fit indexes in covariance structure analysis: conventional criteria versus new alternatives. Struct Equation Modeling 1999 Jan;6(1):1-55. [doi: 10.1080/10705519909540118]
55. Gregorich SE. Do self-report instruments allow meaningful comparisons across diverse population groups? Testing measurement invariance using the confirmatory factor analysis framework. Med Care 2006 Nov;44(11 Suppl 3):S78-S94 [FREE Full text] [doi: 10.1097/01.mlr.0000245454.12228.8f] [Medline: 17060839]
56. Vandenberg RJ, Lance CE. A review and synthesis of the measurement invariance literature: suggestions, practices, and recommendations for organizational research. Organ Res Methods 2016 Jun 29;3(1):4-70. [doi: 10.1177/109442810031002] 57. Cronbach LJ. Coefficient alpha and the internal structure of tests. Psychometrika 1951 Sep;16(3):297-334. [doi:
10.1007/BF02310555]
58. Taber KS. The use of Cronbach’s alpha when developing and reporting research instruments in science education. Res Sci Educ 2017 Jun 7;48(6):1273-1296. [doi: 10.1007/s11165-016-9602-2]
59. Marx RG, Menezes A, Horovitz L, Jones EC, Warren RF. A comparison of two time intervals for test-retest reliability of health status instruments. J Clin Epidemiol 2003 Aug;56(8):730-735. [doi: 10.1016/s0895-4356(03)00084-2] [Medline: 12954464]
60. Altman DG. Practical Statistics For Medical Research (Chapman & Hall/CRC Texts In Statistical Science). London, UK: Chapman & Hall/CRC; 1990.
61. Machin D, Campbell MJ, Tan SB, Tan SH. Sample Size Tables for Clinical Studies. Third edition. Oxford, UK: Wiley-Blackwell; 2008.
62. Hair JF, Black WC, Babin BJ, Anderson RE. Multivariate Data Analysis: Pearson New International Edition. Harlow, UK: Pearson Education Limited; 2014.
63. Phillips DL, Clancy KJ. Some effects of “social desirability” in survey studies. Am J Sociol 1972 Mar;77(5):921-940. [doi: 10.1086/225231]
Abbreviations
BI: Behavioral Intention
CFA: confirmatory factor analysis CFI: comparative fit index EE: Effort Expectancy eHealth: electronic health FC: Facilitating Conditions HM: Hedonic Motivation HT: Habit
ICC: intraclass correlation coefficient PBC: Perceived Behavioral Control PE: Performance Expectancy PEOU: Perceived Ease of Use PV: Price Value
RMSEA: root mean square error of approximation SI: Social Influence
SN: Subjective Norms
TAM: technology acceptance model TLI: Tucker-Lewis index
TPB: theory of planned behavior
UTAUT: unified theory of acceptance and use of technology
Edited by G Eysenbach; submitted 06.10.19; peer-reviewed by A Saptono, U Öberg; comments to author 10.11.19; revised version received 22.11.19; accepted 15.12.19; published 15.04.20
Please cite as:
Hayotte M, Thérouanne P, Gray L, Corrion K, d'Arripe-Longueville F
The French eHealth Acceptability Scale Using the Unified Theory of Acceptance and Use of Technology 2 Model: Instrument Validation Study
J Med Internet Res 2020;22(4):e16520 URL: https://www.jmir.org/2020/4/e16520
doi: 10.2196/16520
PMID:
©Meggy Hayotte, Pierre Thérouanne, Laura Gray, Karine Corrion, Fabienne D'Arripe-Longueville. Originally published in the Journal of Medical Internet Research (http://www.jmir.org), 15.04.2020. This is an open-access article distributed under the terms of the Creative Commons Attribution License (https://creativecommons.org/licenses/by/4.0/), which permits unrestricted use, distribution, and reproduction in any medium, provided the original work, first published in the Journal of Medical Internet Research, is properly cited. The complete bibliographic information, a link to the original publication on http://www.jmir.org/, as well as this copyright and license information must be included.