HAL Id: hal-02117311
https://hal.archives-ouvertes.fr/hal-02117311
Submitted on 2 Mar 2020
HAL is a multi-disciplinary open access
archive for the deposit and dissemination of sci-entific research documents, whether they are pub-lished or not. The documents may come from teaching and research institutions in France or abroad, or from public or private research centers.
L’archive ouverte pluridisciplinaire HAL, est destinée au dépôt et à la diffusion de documents scientifiques de niveau recherche, publiés ou non, émanant des établissements d’enseignement et de recherche français ou étrangers, des laboratoires publics ou privés.
Deciphering the phylogeny of violets based on
multiplexed genetic and metabolomic approaches
Justine Chervin, Thierry Talou, Marjorie Audonnet, Bernard Dumas, Laurent
Camborde, Marie-Thérèse Esquerre-Tugaye, Christophe Roux, Guillaume
Cabanac, Guillaume Marti
To cite this version:
Justine Chervin, Thierry Talou, Marjorie Audonnet, Bernard Dumas, Laurent Camborde, et al.. Deciphering the phylogeny of violets based on multiplexed genetic and metabolomic approaches. Phy-tochemistry, Elsevier, 2019, 163, pp.99-110. �10.1016/j.phytochem.2019.04.001�. �hal-02117311�
OATAO is an open access repository that collects the work of Toulouse researchers and makes it freely available over the web where possible
Any correspondence concerning this service should be sent
to the repository administrator: tech-oatao@listes-diff.inp-toulouse.fr
This is an author’s version published in: http://oatao.univ-toulouse.fr/24875
To cite this version:
Chervin, Justine and Talou, Thierry and Audonnet, Marjorie and Dumas,
Bernard and Camborde, Laurent and Esquerré-Tugayé, Marie-Thérèse and Roux, Christophe and Cabanac, Guillaume and Marti, Guillaume Deciphering the
phylogeny of violets based on multiplexed genetic and metabolomic approaches.
(2019) Phytochemistry, 163. 99-110. ISSN 0031-9422 Official URL:
https://www.sciencedirect.com/science/article/pii/S0031942219300202
Page 1 sur 36
This is the accepted version of a paper in Phytochemistry, 163, pp. 99-110 that appeared online on April 28, 2019 at https://doi.org/10.1016/j.phytochem.2019.04.001.
Deciphering the phylogeny of violets
based on multiplexed genetic and
metabolomic approaches
Justine Chervin1,2,3, Thierry Talou1, Marjorie Audonnet2, Bernard Dumas2, Laurent Camborde2,
Marie-Thérèse Esquerré-Tugayé2, Christophe Roux², Guillaume Cabanac4, Guillaume Marti3*.
1 Laboratoire de Chimie Agro-industrielle, LCA, Université de Toulouse, INRA, Toulouse, France ;
justine.chervin@ensiacet.fr, thierry.talou@ensiacet.fr,
2 Laboratoire de Recherche en Sciences Végétales [LRSV], UMR 5546, UPS/CNRS, Toulouse, France ;
dumas@lrsv.ups-tlse.fr, esquerre@lrsv.ups-tlse.fr, camborde@lrsv.ups-tlse.fr, roux@lrsv.ups-tlse.fr, marjorie.audonnet@laposte.net
3 UMR 152 PharmaDEV, Université de Toulouse, IRD, UPS, Toulouse, France; guillaume.marti@univ-tlse3.fr, 4 UMR 5505 IRIT, Université de Toulouse, UPS, Toulouse, France ; guillaume.cabanac@univ-tlse3.fr
Page 2 sur 36 Abstract
Molecular phylogenetics based on nucleotide sequence comparisons has profoundly influenced plant taxonomy. A comprehensive chemotaxonomical approach based on GC-MS and UHPLC-HRMS profiling was evaluated for its ability to characterize a large collection of plants all in the violet family Violaceae (n = 111) and thus decipher the taxonomy. A thorough identification of violets is challenging due to their natural hybridization and phenotypic variability. Phylogenetic inference performed on ribosomal internal transcribed spacer sequences using maximum likelihood and neighbor-joining distance methods allowed the clear identification of 58% of the collection. Metabolomic approaches with multivariate data analysis were performed on SPME/GC-MS chromatograms of volatile compounds emitted by fresh mature flowers and on UHPLC-HRMS/MS leaf extracts for non-volatile compounds. Interestingly, molecular and biochemical approaches provided separate classifications while highlighting several common clusters. The profiling of secondary metabolites was proved most suitable for the classification of hundreds of extracts. The combination of phylogenetic and chemotaxonomic approaches, allowed the classification of 96% of the entire collection. A correlation network revealed specific chemotaxonomic biomarkers, in particular flavonoids, coumarins and cyclotides. Overall, our pioneering approach could be useful to solve misclassification issues within collections of close plant species.
Highlight
• Genetic-based phylogeny allowed the classification of 58 % of the violet collection (n = 111)
• GC-MS from native flowers volatile did not improve significantly the classification. • UHPLC-MS profiling of lyophilized leaf samples significantly expands the
classification rate to reach 96% of the entire collection
• Chemotaxonomic markers of each violet species were annotated
Keywords:
Biomarkers; Chemotaxonomy; GC-MS; Metabolomic, Phylogeny; UHPLC-HRMS; Violets. Abbreviations
Diode array detector (DAD) Electrospray iononisation (ESI)
Page 3 sur 36 Headspace solid-phase microextraction (HS-SPME)
Internal transcribed spacer (ITS)
Orthogonal partial least square discriminant analysis (OPLS-DA) Pair of bases (pb)
Polymerase Chain Reaction (PCR) Principal component analysis (PCA) Quality control (QC)
Page 4 sur 36 1 Introduction
The Violaceae family of plants contains 23 genera and approximately 900 species distributed all over the world. Its three largest genera represent 98% of its species, including Viola with approximately 600 species. This genus is separated into two main groups (sections) widely distributed in the Northern Hemisphere (Ballard et al. 1999): violets in the Viola section and pansies in the Melanium section (Yockteng et al. 2003). Viola are perennial herbs with very short stems, often stolons and typically zygomorphous flowers.
The delimitation of Viola species into sections and subsections can be problematic in particular when using morphological characteristics. This is due to hybridization, which is relatively common in vascular plants and has a large impact on speciation events (Erben 1996). Such hybridization can contribute to rapid diversification of many plant lineages with karyotypic and genomic changes (Arnold 2006) but can also lead to the demise of rare species (Todesco et al. 2016). Hybridization may reduce a population's growth rate by the production of hybrid seed, which is produced at the expense of conspecific (pure) seed when they competed with them for resources or they possess better vigor and fertility than parents, for instance (Levin et al.1996). In the past, taxonomists have studied the phylogeny of Viola based on anatomical characteristics (Marcussen et al. 2012), chromosome numbers (Clausen 1927), nuclear ribosomal sequences (Ballard et al. 1999) (Mereda et al. 2011) and chloroplast DNA as complementary tools in particular to detect maternal lineages (Cennamo et al. 2011). Within nuclear ribosomal sequences, internal transcribed spacer (ITS) regions are highly popular in phylogenetic studies (Álvarez 2003) and have been efficiently used to differentiate plant species. Indeed, they are easily amplified by polymerase chain reaction (PCR) using universal primers (Baldwin et al. 1995) and the nucleotide sequences of ITS1 and ITS2 regions are highly polymorphic between species.
The French National collection of violets held in Toulouse (France) comprises 111 plants individuals from all over the world (Asia, America, and Europe), each characterized by its phenotypic traits like flower shape and color and to a lesser extent leaf shape. Although they all possess vernacular names, only 21% have been scientifically identified with respect to taxa. Their rigorous classification was therefore necessary to allow better identification and discrimination. A first strategy was to identify species and cultivars according to ITS regions known to be conserved. However, due to hybridization between violets, distinction of individuals based on phenotype and ITS alone is often insufficient and complementary methods such as chloroplast genome comparison are necessary. To improve the resolution of the
Page 5 sur 36 genotypic characterization of our collection, we conducted chemotaxonomic studies using a metabolomic approach with the aim of facilitating the analyses of large datasets via the association of potential biomarkers to specific genotypes (Cox et al. 2014). Our first chemotaxonomic study investigated volatiles of fresh native flowers at maturity using headspace solid-phase microextraction coupled to gas chromatography with mass spectrometry (HS-SPME-GC-MS). The second analyzed the secondary metabolites of ethanolic leaf extracts by ultra-high performance liquid chromatography-high resolution mass spectrometry (UHPLC-HRMS).
2 Results
2.1 Phylogenetic analysis
The whole ITS region (500 bp) was amplified for the 85 plant individuals of the French collection of violets and sequenced. In this way, 80 well-defined sequences were obtained. Other violets were either not sequenced (N = 26) or presented non-exploitable sequences (N = 9), likely due to the presence of heterozygotes and intra-individual polymorphism as suggested by the presence of double peaks for some nucleotide sites. For 31 violets, only a few double peaks along the whole sequence were observed, thus the two sequences were studied separately by manually substituting nucleotides and identification performed for both. In each case, the same species but sometimes different isolates were obtained, revealing the significant hybridization between violets of the same species. Sequence alignment (see Supplementary Fig. S1) highlighted few differences: twenty nucleotide sites were polymorphic in ITS 1 and 12 in ITS 2. Alignment of experimental sequences was made with references of GenBank database from the National Center for Biotechnology Information (NCBI), a curated non-redundant public nucleotide sequence database used internationally as a standard for genome annotation (Pruitt 2004) used in previous pansies (Yockteng et al. 2003) and violet (Conesa at al. 2008) studies. It provided a similarity score and a no-doubt-identification was decided above 99%. This was the case for 64 violets (58% of the whole collection): two were referenced as V.
subs Rostratae Kupffer (namely V. labradorica and V. grypoceras) (Marcussen et al. 2010),
two as V. alba Besser, six as V. suavis Bieberstein, twelve as V. sp Hearn cult 33, one as V.
verecunda A Gray, one as V. mandshurica Becker and forty as V. odorata Linneaus.
Clear defined sequences (N = 80) were compared by a distance based reconstruction method to identify clades with a bootstrap threshold value of 80%. Six clades of various sizes were highlighted and seemed to correlate with specific species (Supplementary Fig. S2). Fifty-five
Page 6 sur 36 percent of the sequences grouped together in one clade, around 15% in each of two clades and 5% in each of the remaining three. Therefore, while the collection presented some genotype variability, the majority of the violets were found to possess similar DNA sequences.
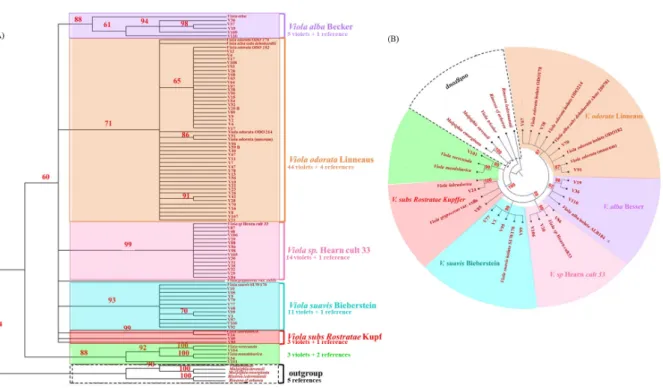
Comparisons were then made with references found in GenBank nucleotides database to reconstruct maximum parsimony (Fig. 1 A) and the maximum likelihood phylogenetic trees, the latter built with few selected sequences of distinct clades for visual quality (Fig. 1 B). These references were: Viola alba isolate ALB184 V6 (GenBank: EU413916), Viola sp Hearn cult33 (GenBank: DQ521291), Viola suavis isolate SUW170 V17 (GenBank: EU413930), Viola
mandshurica isolate TKM201586 (GenBank: KX394615), Viola alba subsp dehnhardtii clone
200781 (GenBank: EU430656), Viola odorata isolate ODO178 V11 (GenBank: EU413922), isolate ODO214 V8 (GenBank: EU413919), isolate ODO182 V3 (GenBank: EU413918). One
V. odorata botanically identified obtained for the Museum of Natural History of Toulouse was
also included and 99.7% correspondence with V. odorata from NCBI was obtained. Cladograms was thus obtained and Rinorea ledermannii as species of Violaceae was used to root the tree. As used previously, a bootstrap threshold value of 80% was fixed and same clades were highlighted in both trees with confirmed identifications made as V. odorata for the orange clade with 44 violets, V. alba for the purple clade with 5 violets, V. sp Hearn for the pink clade with 14 violets, V. suavis for the turquoise clade with 11 violets, and V. subs Rostratae for the red clade with 3 violets; an unidentified cluster in green with 3 violets was well separated from the other clades.
Fig. 1 Cladograms obtained with maximum parsimony (A) and maximum likelihood (B) method showing genetic relationship of selected experimental sequences and references based on ITS sequences. To improve the quality of the figure, only sequences of a few characteristic samples from each clade observed with distance model were selected for B. The outgroup is used to root the tree. Bootstrap values to study robustness are indicated in red (in colour).
It was quite interesting to also note certain similarities in terms of phenotypic traits of violets belonging to the same clade. A lavender and sometimes white double flower characterized V.
alba (Supplementary data Fig. S3 a) against mainly big dark purple and sometimes single
white flowers for V. sp Hearn (Fig. S3 b), small violet single flowers for V. subs Rostratae (Fig.S3 c) and single mauve flowers for V. suavis (Fig. S3 d). Nevertheless, such phenotypes cannot be described as species-specific since various colors and shapes were observed for different violets all belonging to V. odorata (Fig. S3 e), for example either lavender or white double flowers.
Besides, botanical studies based on morphological and anatomical (bracteoles and leaf epidermis) aspects were conducted on three characteristic violets belonging to each clade. For
Page 7 sur 36
V. subs Rostratae, both V. labradorica and V. grypoceras species were described. All violets
possess heart shape leave with either rounded or sharped extremity of various size. Average size of 3 to 4 cm were observed but bigger and smaller leaves were respectively noted for V. sp Hearn and violets belonging to V. subs Rostratae. Average flower size is around 1 to 2 cm and bigger and smaller flowers were as well observed for V. sp Hearn and V. subs Rostratae. Main anatomical divergences focused on the presence, shape and localization of glandular and non-glandular trichomes, the size of the anisocytic-type stomata bigger for V. sp Hearn and V.
labradorica as well as the shape of adjoining cells, either rounded or epidermal. Presence of
mucilage and hypertrophied epidermal cells were also of varying importance depending on the clade. Tables of resemblances and divergences can be noted in Supplementary Table S2. This study allowed the validation of species identification by comparison with literature (Bonnier et al. 1990) (Tutin et al. 1968)
Regarding the identification, data could be more precise than that obtained here, for example violet of Toulouse being identified as Viola alba (purple cluster). Indeed, in the literature it is known as Viola alba sups dehnhardtii (Malécot et al. 2007). In addition, violets belonging to
Viola odorata were distributed among the three previously quoted isolates (ODO178, ODO182
and ODO214), however, their sequences were highly analogous with 99% and even 100% similarity. This is indicative of the insufficiency of the ITS sequence for precise identification and the need for further methods such as chloroplast DNA in such cases. Indeed, chloroplast DNA markers showed variability among Viola and allowed the distinction of sections and subsections as in the analysis of Korean Viola (Yoo et al. 2010). Nevertheless, since the main goal of our study was to obtain a classification of violets into various clades limiting their identification to the species level was sufficient.
These genetic results were then used as a base model on which to apply a new strategy based on chemotaxonomic studies. From the dataset of violets analyzed by each of two methods (GC-MS and UHPLC-HR(GC-MS), genetically well-identified violets (N = 64 violets) were used as training set on which to build statistical models. The unidentified violets were used as a prediction set to try to classify them and attribute a potential identification (Fig. 2).
Fig. 2 Strategy of classification based on training and prediction sets. Pie charts show the distribution of results of classification (in colour).
Page 8 sur 36 2.2 HS-SPME-GC-MS
2.2.1 HS-SPME protocol optimization
A second order Doehlert design (Ferreira 2004) was used to optimize the release and the trapping of volatiles emitted by fresh flowers at maturity. Two time parameters were studied: the time leading up to volatile release and the adsorption time of volatiles trapped onto the SPME fiber. This optimization was undertaken with the violet of Toulouse at room temperature. Plants were kept under a bell-shaped hood to ensure non-degradation of the vegetal matter. Based on one report in the literature, the expertise domain was defined as: a time for volatile release between 20 and 80 min and an adsorption time between 15 and 45 min (Vercammen et al. 2000). The Doehlert matrix indicated nine experiments to perform with two repetitions at the center of the experimental domain (Supplementary Table S3). Two responses were observed, the number of peaks and their global integration (Supplementary Tables S4 and S5). The repeatability of the plan was confirmed by the repetition of the same order of magnitude: number of peaks 13 ± 1 and integration 21 ± 3. Method optimization was sought using the maximum final parameter values: 65 min to release the volatiles and 37 min for the adsorption. This theoretical maximum was experimentally confirmed by the analyses of three different plants on three days (Supplementary Table S6). For routine analyses, a proposed technical maximum of 60 min and 30 min was validated upon similar results to those of the theoretical maximum with a standard deviation of only 2% regarding the peak integration. This practical optimum was therein conserved.
2.2.2 HS-SPME-GC-MS-based metabolomic approach
HS-SPME-GC-MS profiles of all 39 analyzed flowering plants afforded 82 features (m/z-RT pairs).As a preliminary step, principal component analysis (PCA) was applied as an exploratory tool to provide an unsupervised overview of the GC-MS volatile fingerprints. Use of binary data based on the presence or absence of peaks in each sample was preferred to avoid intensity variability (Fig. 3). Indeed, analyses of the same violet of Toulouse throughout one season (February-March) provided quantitative but not qualitative variations and the identification of the same profile with only peak intensity variations (Supplementary Fig. S4). This PCA revealed a group composed of only violets belonging to V. sp Hearn that were well-separated from the four other clusters. This separation was dependent on PC1 while the other species were separated by PC2. This observation suggests that V. sp Hearn features volatile profiles that differ considerably from the other species which among themselves share common features.
Page 9 sur 36 Fig. 3 PCA score plot of GC-EIMS data from SPME flower extracts using binarized data (in colour).
We then applied a supervised orthogonal partial least square discriminant analysis (OPLS-DA) in order to try to classify the unidentified violets by projection and thus extend the classification of our collection. A base model was built with only violets identified genetically (N = 19 violets) (Fig. 4A) with distinction of five clusters related to specific species. V. sp Hearn cluster is separated by PC1 axis whereas the others by PC2 axis. The quality of model prediction was not satisfactory (R2Y = 0.93, Q2Y = 0.505, CV-ANOVA p-value = 0.59) and a permutation test did not assess its validity (Supplementary Fig. S5). This result could be explained by the overlapping of clusters relating to V. alba, V. odorata and V. suavis (Fig. 4B) clearly observed after prediction of unidentified violets (N = 20 violets). It suggests that these three species might share common features which did not allow their clear distinction compared to V. subs
Rostratae and V. sp Hearn which are both well separated in the variance plot. Prediction results
which were quite weak, as only ten violets in twenty (i.e., 50%) were projected and classified into the defined clusters, have to be taken with hindsight as projections in V. sp Hearn could be quite certain due to its good separation, but those in the three overlapping clusters remain hypothetical.
Fig. 4 OPLS-DA base model of GC-EIMS data (A) and prediction set of unidentified violets (B). Well-projected violets are indicated by a star (in colour).
2.2.3 Identification of violet species-specific volatile biomarkers
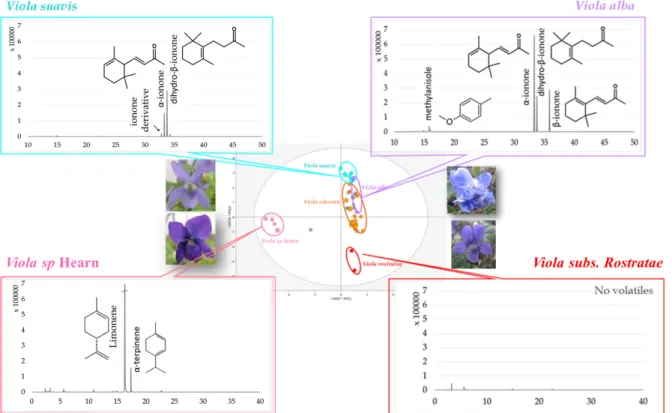
Despite the poor classification of violets with volatile analyses, some species-specific biomarkers were highlighted through database interrogation (Fig. 5). A profile with major amount of limonene (Supplementary Fig. S6.1 a) was revealed for violets belonging to V. sp Hearn with the presence of some terpenes such as α-terpinene (S6.1 b). Two ionone profiles enabled a distinction between violets belonging to V. alba and V. suavis. Regarding V. alba, the three ionones classically found for violets were noted, i.e. α-ionone (S6.1 c), β-ionone (S6.1 d) and dihydro-β-ionone (S6 e), as well as one methoxybenzene named methylanisole (S6.1 f). This latter is absent for V. suavis but we suspect the presence of other ionone derivatives near the area of well-identified ionones as two new peaks appeared. Finally, violets identified as V.
Page 10 sur 36 peaks, correlating to nearly no flower fragrance compared to the others. These profiles correlate well with our findings using the OPLS-DA base model, showing high levels of similarity between V. suavis and V. alba in view of the presence of ionones, in contrast to both V. sp Hearn, which while devoid of these compounds are rich in others, and V. subs Rostratae with no volatiles. These ionone profiles thus explain the well-defined clusters of V. sp Hearn and V.
subs Rostratae and the tendency for the others to merge.
Finally, the standard deviation reaching 7% between retention times of standards and compounds derived from violet extracts, as well as the strong similarity of the experimental mass spectra allowed the validation of all the proposed annotations obtained in silico with databases (Supplementary Fig. S6.2).
Fig. 5 Specific volatile profiles with identification of characteristic volatile biomarkers for each OPLS-DA cluster of GC-EIMS data. Stars indicate well-projected violets (in colour).
2.3 UHPLC-HRMS-based metabolomic approach
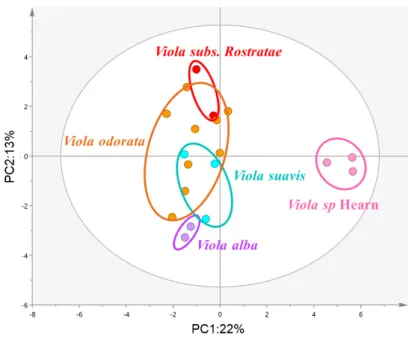
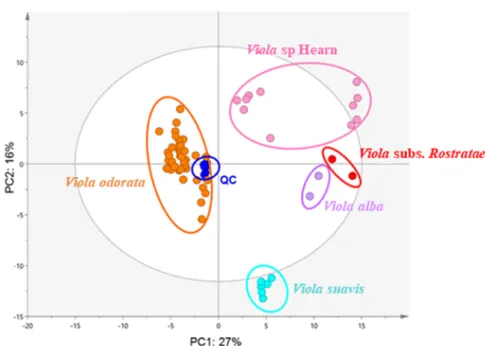
UHPLC-HRMS profiles of all 119 extracts (110 crude extracts, 1 botanical reference V. odorata and 8 QC samples prepared by pooling aliquots of all extracts) afforded 208 and 198 features in NI and PI modes respectively and 120 common features between both ionization modes. The analytical method was optimized so as to obtain as much information as possible in a satisfactory analysis time (about twenty minutes). The four most intense ions in each scan were fragmented to provide structural information and facilitate annotation of the compounds. As expected, PCA-X grouped QC near the plot center with violet extracts distributed around this central point (Fig. 6). Clusters correlated with species were highlighted according to genetic results. They matched with the five identified species: V. subs Rostratae, V. suavis, V. alba, V.
odorata, and V. sp Hearn. These results indicated then a stable chemical composition within
aerial parts of violets belonging to the same species. Moreover, it can be noticed the formation of two main groups based on PC1 with on the one hand V. odorata and on the other hand
V. suavis, V. sp Hearn, V. alba and V. subs Rostratae. According to this configuration, V. alba
and V. subs Rostratae seem to present similar profiles compared to the others, especially V.
odorata and V. suavis which are both well-separated from the other clusters suggesting they
Page 11 sur 36 Fig. 6 PCA score plot of UHPLC-HRMS-ESI-NI/PI combined dataset from violets leaf extracts (in colour).
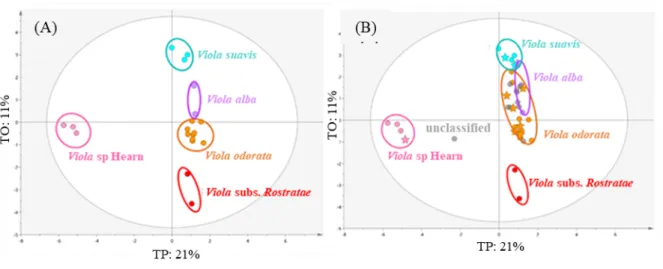
After PCA-X, we applied OPLS-DA analysis in order to try to classify the unidentified violets by projection and extend the classification of the collection. A base model was first built with only genetically-identified violets (N = 62 violets) (Fig. 7A). This model was quite well-defined (R2Y = 0.962, Q2Y = 0.822, CV-ANOVA p-value < 0.001) and validated by a permutation test (Supplementary Fig. S7). Unidentified violets (N = 46 violets) were then projected on the same model as prediction set. Forty-two out of the forty-six unknown violets were putatively identified by projection and thereby affiliated to clear-defined clusters characterized by specific chemical profiles and related to specific species (Fig. 7B). Three violets were associated with
V. alba, two with V. subs Rostratae, nine with V. sp Hearn, two with V. suavis and twenty-six
with V. odorata. Four violets remained totally separate from these clusters and could therefore be neither classified nor putatively identified.
In our previous genetic results, some violets were not clearly identified due to similarity scores under 99% but were then affiliated to one clade through distance model phylogeny. Upon comparison with the UHPLC-HRMS results, predictions correlated with genetic affiliation thus reinforcing the putative identification of these violets which allowed reaching the classification of 96 % of the collection. The four undefined violets were not well correlated to any specific cluster and regarding genetic results, two were not sequenced and the others revealed clear sequence with low identification scores. Thus 4% of our collection of violets remain unidentified.
Fig. 7 OPLS-DA base model of UHPLC-HRMS-ESI-NI/PI combined dataset (A) and prediction set of unidentified violets (B). Well projected violets are indicated by a star (in colour).
The stability of leaves metabolome over time was assessed by a kinetic study. Every two months, ten leaves of violet of Toulouse were collected and extracted as depicted in section 2.4. The PCA score plot (Supplementary Fig. S8) containing few selected extracts of each species representative of each cluster was built. All kinetic extracts of violet of Toulouse were distinctly projected within V. alba cluster. Thus, the model validity obtained at one precise moment of the season may be more generally interpreted as attested by these kinetic results.
To complete this study, phylogenetic reconstruction was tried by combining ITS sequence and LC-MS data through a parsimony method. Since no standardization method was found in the
Page 12 sur 36 literature to treat LC-MS data, the binary matrix was built on the average intensity as threshold, independently for each variable. Thus superior values were indexed with 1 against 0 on the contrary. All data were combined and the resulting combined tree (Supplementary Fig. S9) conducted to the observation of the majority of the groups identified in ITS phylogenetic tree. The only difference focused on the scission of V. odorata clade into two groups. Complementary hierarchical cluster analysis (HCA) of LCMS data highlighted the same organization as one branch related to V. odorata was noted with a separation into two groups (Supplementary Fig. S10). These results could be then explained by the presence of different varieties within V. odorata which seem highlighted by combination of data.
2.4 Annotation of UHPLC-HRMS chemotaxonomic biomarkers of violet species In an attempt to take our classification further and identify potential chemotaxonomic biomarkers, we built a correlation network (Fig. 8). This was composed of a set of nodes corresponding to UHPLC-HRMS peaks and correlated by edges using Spearman correlation. This correlation was based on the relative intensity of each peak in each extract. Compounds having the same pattern would thus be correlated together.
The network obtained was composed of around 250 nodes and allowed us to observe, as expected, clear clusters of metabolites specific to identified species. Non-discriminant metabolites shared by different and sometimes all species were also found plotted at the center of the network (Supplementary Fig. S11).
Fig. 8 Correlation network based on ESI-NI/PI combined dataset of UHPLC-HRMS performed on leaf extracts and identification of characteristic biomarkers. Color tag is based on species identification by genetic analysis. Node size was emphasized based on OPLS-DA coefficient value. Putative structures were based on HRMS and MS/MS spectra and correspond to the first hit in MS-FINDER as annotation illustration(in colour).
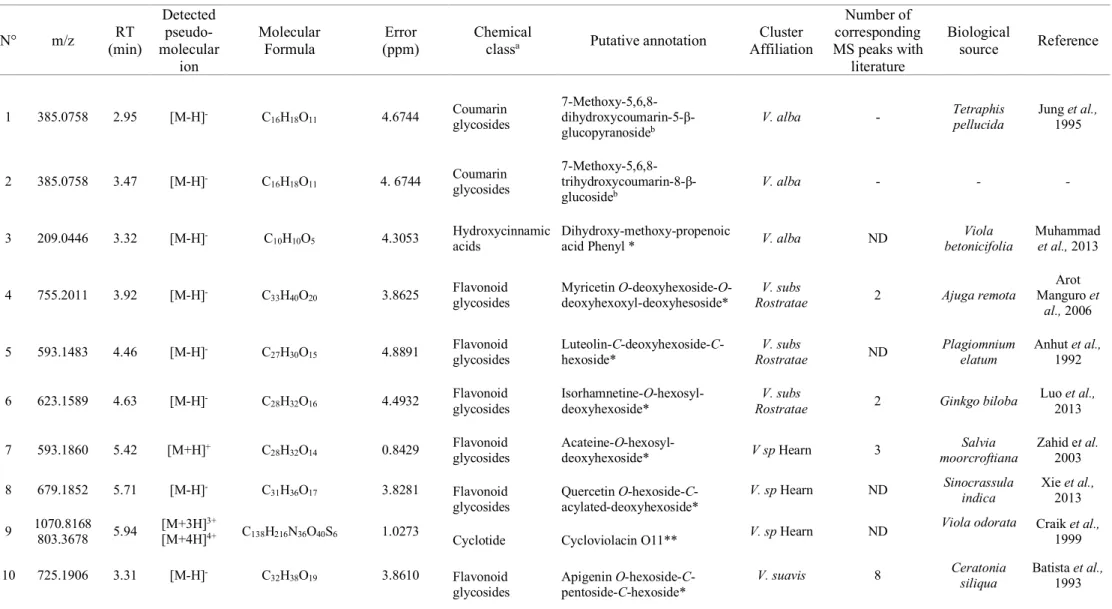
The annotation of characteristic features of each species was undertaken using in silico fragmentation to compare against our own in-house Viola databases as well as local databases within MS-FINDER (Table 1). Every correspondence between experimental and in silico fragments is presented in Supplementary Fig. S12. Moreover, UV spectra were also combined to confirm the chemical class of compounds. The combination of spectral data allows annotation of level 2 (Sumner et al., 2007).
It is interesting to note the abundance of C- and O-glycosylated coumarin and flavonoid derivatives. It can be noted that C- and O-glycosylated aglycone can be differentiated by their MS-MS spectra as previously described (Benayad et al. 2014). For O-hexose like glucose, a
Page 13 sur 36 difference of 162 Da is observed; for O-deoxyhexose like rhamnose it is a difference of 146 Da and for O-pentose like arabinose, this is a difference of 132 Da. On the contrary, for C-glycosylated substituents, these losses are not observed but rather 60, 90 or 120 Da (Ferrere et al. 2003). For instance, fragments with mass differences of 162 Da and 15 Da suggest the presence of one methoxy and one O-hexose substituents for compounds 1 and 2. NMR characterizations confirmed these substitutions of a coumarin aglycone (Chervin et al. 2017). On the contrary, for compound 5, observation of fragments 503.11 (-90 Da) and 473.21(-120 Da) suggested the presence of a C-rhamnose whereas fragments 383.05 and 353.11 highlighted a C-glucose. Relative intensities of fragments suggest the rhamnose is linked at the 8 position and the glucose is linked at the 6 position (Benayad et al. 2014).
OPLS-DA coefficients were determined for every feature and for each identified species. Characteristic features were correlated to the highest OPLS-DA coefficient scores. V. odorata presents mainly cyclotides as biomarkers with [M+3H]3+ showing a characteristic isotopic
shape, whereas V. alba, V. subs Rostratae, V. sp Hearn and V. suavis seem well characterized by polyphenols, in particular flavonoids and coumarins specific to V. alba. As in the above-mentioned UHPLC-HRMS-based metabolomic approach, the identification of two groups was reinforced by the putative distinguished biomarkers.
Table 1: Summary of all annotated compounds with MS-FINDER
3 Discussion
We have described the taxonomic delimitation of the French national collection of violets held in the municipal greenhouses of Toulouse performed by combining their genotypic and chemotaxonomic profiles. Untargeted metabolomic approaches coupled to LC-MS (Martucci et al. 2014) as well as SPME GC-MS (Khalil et al. 2017) phytochemical characterizations have already demonstrated their potential in taxonomic classification on different species. As explained previously, regarding the species concept (Smedsgaard et al. 2005), the classification and understanding of any species rely on three main axes to distinguish their phenotypic characteristics, ecological behavior and genome. However, these aspects are not always sufficient to well-differentiate closely related species or during the speciation process. Since the metabolome represents the final picture of what is extracted resulting from genomic and environmental interaction, metabolite profiling appears to offer the data required to bridge the gap left by genetic-based taxonomical studies performed alone. Implementation of such
Page 14 sur 36 metabolite profiling should thus provide new clues with which to refine genomic-based
classification. Genetic analyses based on the study of ITS sequences
allowed the classification of 72% of the collection of violets into six different clades with distance-based phylogeny reconstruction. Nevertheless, only 58% of the collection clearly matched to one reference found in the NCBI database with a similarity score above 99%. To improve this classification, we undertook chemotaxonomic studies involving native flower volatile profiling obtained by HS-SPME/GC-MS and UHPLC-HRMS analyses of fresh leaf extracts. We found the volatile profiling unsuitable for discrimination of the complete collection, mainly due to the small number of features inducing a less significant variability among the species. In addition, this technique is quite sensitive, in particular to environmental conditions, and is long to perform (around two and half hours for one analysis). Moreover, profiling the volatile emitted by flowers is limited to the flowering period, which is only two winter months for the Viola genus. Analysis of a large collection is therefore laborious and was deemed unsuitable in our case.
On the contrary, UHPLC-HRMS analyses worked well for our classification purposes. Indeed, the strategy used here based on genetic results to build a statistical model from which a prediction set was used for unidentified violets, the classification rate rose to 96 % of the whole collection composed of 111 violets. Importantly, this technique is easy to implement, in our case requiring only an ethanolic extraction which lasted 30 minutes using around 1g of fresh sample (the equivalent of a dozen leaves in the case of Viola plantlets). Moreover, separations are of better quality and are achieved in a shorter time (around thirty minutes per sample) thereby reducing the cost of analysis (Dong et al. 2014) making it better suited to the analysis of a whole collection containing hundreds of samples. The overall good predictive quality of our LCMS-based models could be explained by the larger number of variables involved (around 250 in total). Furthermore, the variability observed over time is higher for volatile compounds compare to non-volatiles, as depicted in Fig. S4 and Fig. S8. As a consequence, the inter-sample variation is lower for leaf extracts. The main limitation remains the false discovery rate (Benjamini et al. 1995); a common way of circumventing this is to employ the diagnostic tool CV-ANOVA (analysis of variance testing of cross-validated predicted residuals) to assess the reliability of the OPLS model. This tool displays the p-value indicating the probability level where a model with one value is the result of chance. A p-value lower than 0.05 is correlated to a significant model. Permutation tests are also often applied in validation procedure to diagnostic model overfit (Eriksson et al. 2008). The acquisition of UHPLC–HRMS profiles in
Page 15 sur 36 data-dependent analysis mode provided accurate mass-to-charge ratios for molecular formula determination along with MS/MS fragments used for peak assignments. Regarding the various databases used, our Viola databases provided more pertinent annotations than those based on natural products databases within MS-FINDER, which allowed a more general identification for which mainly chemical class was relevant.
Cross referencing with the genetic classification reinforced the putative identification of unknown violets. In this way, more than half of the collection was identified as V. odorata, around 18 % as V. sp Hearn, 5 % as V. alba, 7 % as V. suavis and 4 % as V. subs Rostratae. While V. alba, V. suavis and V. odorata possess similar volatile profiles principally composed of ionones, they could be better differentiated by their non-volatile secondary metabolites from coumarines, flavonoids and various non-phenolic classes of compounds. On the contrary, while
V. sp Hearn and V. subs Rostratae possess similar secondary metabolite markers within the
flavonoid class, they could be accurately distinguished by their volatile profiles with the presence of terpenic compounds within the first group and the absence of quantitative volatiles from the second.
Metabolite profiling, as depicted in a previous study of tomato species (Overy 2004), allowed the examination of biological diversity with clear discrimination of violet species; this permitted their segregation through multivariate data analysis. The chemical profiling methods used in our study provided complementary information and contributed towards the establishment of a significant relationship with ITS phylogenetic analysis for Viola genus.
Consensus tree based on ITS sequences and binary LC-MS matrix validated the majority of the clades correlated to one species (Fig. S9). However, for V. odorata a scission was observed conducting to two groups instead of the only one observed with ITS sequence. The first hypothesis was about the potential loss of information due to the binarization of LC-MS data. Indeed, there are continuous data with semi-quantitative information at one variable level. But HCA of LC-MS data highlighted the same phenomenon which could then be explained by the potential presence of several varieties. Comparison of both clades highlighted a highest concentration of cycloviolacin O9 in the major group of V. odorata. Independent analysis of ITS data did not permit the clear identification of varieties but combination of information conducted to this revelation thus reinforcing the complementarity of the methods and the relevance of metabolome profiles in classification.
Page 16 sur 36 One of the main limitations of our workflow concerns the non-referenced sequences. As depicted for the four unclassified violets (grey dots, Fig. 7b), two of them displayed exploitable ITS sequences, with no satisfactory matches within the NCBI bank (> 99%). According to our combined results, these violets could be new species which warrants further investigation. Another drawback of our procedure is the identification of metabolite biomarkers which is time-consuming and elusive despite recent advances in this area (Perez de Souza et al. 2017). Contrary to other “-omics” based approaches, such as genomics and proteomics, metabolomic is still in its infancy and requires protocol standardization to overcome this identification shortfall. Nevertheless, taxonomy can expect a strong complementary partnership between comprehensive metabolome profiling methods and genetic-based approaches in the near future. 4 Materials and methods
4.1 Plant material
Violet leaves were harvested in spring 2016 from the whole collection of violet plants maintained in the municipal greenhouses of Toulouse, France: two leaves for genetic analysis and ten for UHPLC-HRMS analysis. Directly after collection, they were immerged in liquid nitrogen to stop any enzymatic activity and then stored at -80°C. Genetic analysis was undertaken on frozen leaves; for UHPLC-HRMS profiling, the vegetable matter was lyophilized and ground into powder using a microtube homogenizer (BeadBug, 40W). Overall, 108 distinct violet leaves were extracted.
For volatile profiling, the whole native flowering plants were analyzed between February and April 2016 according to their blossoming quality. A total of 39 flowering plants were analyzed. 4.2 DNA amplification, purification and sequencing
Genetic analyses were performed directly on a small portion (approx. 1mm²) of a frozen fresh leaf of the various plants without previous DNA extraction. Species discrimination was accomplished through amplification of the whole internal transcribed sequence region ITS1-5.8S-ITS2 by PCR (Mullis et al. 1986) using the KAPA3G Plant PCR kit (Kapabiosystems). The forward primer ITS (GGAGAAGTCGTAACAAGGTTTCCG) (Aceto et al. 1999) and the reverse primer ITS (GCTCGCCGTTACTAGGGGAATC) were used to amplify the ITS region according to the manufacturer's recommendations. Briefly, a small sample of frozen leaf was mixed with 50 µl of 1X PCR buffer solution, containing 1 mM of MgCl2 and 0.2 mM of dNTPs,
Page 17 sur 36 fume hood, with filter tips, after a UV cycle of 20 min. Amplification was performed on a Mastercycler (Eppendorf), starting with an initial denaturation step of 10 min at 95 °C followed by 35 cycles composed of a denaturation step at 95 °C for 30 sec, followed by an annealing step at 62 °C for 20 sec, and an extension step at 72 °C for 30 sec. PCR amplicons were resolved on a 1 % agarose gel, after 30 min at 100 V. DNA revelation was achieved under UV with ethidium bromide (EtBr) solution. PCR products were then purified with Promega Wizard® SV Gel and PCR Clean-Up System (Promega Corp., Madison, Wisconsin). Finally DNA was collected in 50 µL of nuclease-free water. Sanger sequencing was performed by GATC Biotech (Constance, German). Sequence identification was achieved by matching against references found within the National Center for Biotechnology Information (NCBI) database (Pruitt 2004).
4.3 Sequence alignment and phylogenetic inference
Phylogenetic analyses were performed using ITS1-5.8S-ITS2 sequences of references available from GenBank (see Supplementary Table S1). Alignment of ITS sequences was performed using the ClustalX program within the CLC Main Workbench software version 7.8.1 (Qiagen Aarhus A/S) and then manually adjusted. Two inferences were then performed: a distance analysis by Neighbor Joining (using Kimura 80 as distance setting) to define sequence similarity, and a phylogenetic analysis using the maximum likelihood method. Maximum parsimony trees of ITS sequences as well as combined ITS and metabolomic data were also built using PAUP* 4.0 software (Swofford 2001). Searches were heuristic with the parsimony criterion, with MulTrees and ACCTRAN options in effect and TBR branch swapping algorithm. Bootstrap values were derived from 1000 replicates and were calculated for both inferences to define clade robustness. The LC-MS data were binarized according to mean peak intensity with a value of “1” for intensity above mean and “0” on the contrary. Outgroups composed of sequences of Viola species from section Melanium (pansies), the different genus
Rinorea from Violaceae and Malpighia from Malpighiaceae were also introduced to obtain
rooted trees.
4.4 Leaf metabolite extraction
Metabolites were extracted by adding ten volumes of 80% ethanol to the powdered material (80.0 ± 0.2 mg). The solutions were sonicated in a bath (Fisher Scientific, Illkirch, France) at room temperature for 10 min, then centrifuged for 2 min at 5°C and 14 000 rpm. The supernatant was put aside and this procedure then repeated once on the residue with fresh solvent. In order to discard chlorophyll pigments, the combined liquid extracts were mixed with silica-C18 in
Page 18 sur 36 final weight proportions of 4 silica powder per 1 initial plant material. The mixture was centrifuged and the resulting liquid extract put in an UHPLC-HRMS vial for subsequent
UHPLC-HRMSanalysis.
4.5 UHPLC-HRMS profiling
UHPLC-HRMS analyses were performed with diode array detector (DAD) on a UHPLC-LTQ Orbitrap XL instrument (Ultimate 3000, Thermo Fisher Scientific, Hemel Hempstead, UK) as previously reported (Chervin et al. 2017). Briefly, the LC–MS system was run using a Acquity UPLC BEH C18 column (100 × 2.1 mm i.d., 1.7 µm, Waters, MA, USA) equipped with a guard column. The mobile phase A (MPA) was water with 0.1% formic acid (FA) and mobile phase B (MPB) was acetonitrile with 0.1% FA. The solvent gradient was: 0 min, 95% MPA; 0.5 min 95% MPA; 12 min, 5% MPA; 15 min, 5% MPA, 15.5 min, 95% MPA; 19 min, 95% MPA. The flow rate was 0.3 mL/min, the column temperature was set to 40 °C and injection volume fixed to 2 µL. The UV detection was performed by a diode array detector (DAD) from 210 to 400 nm. Mass detection was performed using an electrospray source (ESI) in positive ionization (PI) and negative ionization (NI) modes. The mass scanning range was m/z 100–2000 Da. Each full MS scan was followed by data dependent MS/MS on the three most intense peaks.
4.6 Native plant volatiles emission
Analysis of the volatiles of fresh mature flowers from native plants was performed using HS-SPME coupled to GC-MS. The whole plant was analyzed to ensure that no fragile vegetal matter was destroyed in preparation. Optimization of the protocol was undertaken on the violet of Toulouse with use of a Doelhert experimental design (Ferreira 2004) and the following parameters were obtained at ambient temperature: time leading up to volatile release of 1 hour under a bell followed by 30 min of adsorption on the divinylbenzene/carboxen/ polydimethylsiloxane (DVB/CAR/PDMS) SPME fiber (Supelco, Oakville, ON, Canada). This fiber was chosen for its mixed properties. The fiber was retracted and transferred to the GC-MS injection port at 250°C with desorption time of 5 min.
4.7 GC-MS profiling
GC-MS analyses were performed on an Agilent Technologies GC system 7890B equipped with HP 5 MS column (30 m x 0.25 mm id x 0.25 µm film thickness; Agilent, Santa Clara, USA) and coupled to Agilent Technologies 5977B MSD mass chromatograph. The temperature of the injector was maintained at 250°C. The following temperature gradient of the oven was used: 60°C for 10 min, then increase to 130°C at 4°C/min, then to 150°C at 2°C/min and finally
Page 19 sur 36 ramped at a rate of 25°C/min to 250°C and maintained for 10 min. Helium was the carrier gas with flow rate of 1 mL/min. Splitless injection was used and no solvent delay was fixed. The mass spectrometer detector was operated in EI mode at 70 eV. The scan range was set at 50 to 550 Da.
4.8 Data processing
The GC-MS and UHPLC-HRMS raw data were converted to abf files (Reifycs Abf Converter) and processed with MS-DIAL version 2.74 (Tsuagawa et al. 2015) for mass signal extraction respectively between 50 and 600 Da from 4 to 40 min and between 100 and 1500 Da from 0 to 14 min.
For LC-HRMS/MS, respective MS1 and MS2 tolerance were set to 0.01 and 0.2 Da in centroid mode. The optimized detection threshold was set to 4×10⁵ for NI and 1.6x10⁵ for PIconcerning
MS1 and 10 for MS2 in both cases. Adducts, correlated peaks among samples and neutral loss fragments from MS/MS found in higher m/z at a RT windows of 0.1 minute were identified to exclude them from the final peak list. Finally, the peaks were aligned on a quality control (QC) reference file with a retention time tolerance of 0.1 min and a mass tolerance of 0.025 Da. Identification was performed with a local database built on MS-FINDER model (Tsugawa et al. 2016) and based on Viola genus.
Regarding GC-MS, the optimized detection threshold was set to 500. Finally, the peaks were aligned on the reference file of the violet of Toulouse with a retention time tolerance of 0.075 min.
The resulting peak lists were then exported to comma-separated value (CSV) format prior to multivariate data analysis (MVA) using SIMCA-P+ (version 14.0, Umerics, Umea, Sweden). For cyclotide detection, positive profiles were processed with MZmine 2.29. A peak list was built and deconvoluted. The identification of isotopes was made with a maximum charge fixed at 5, a m/z tolerance of 10 ppm and a retention time tolerance of 0.2 min. The representative isotope selected was the lowest.
4.9 Statistical analysis
Both UHPLC-HRMS CSV files of NI and PI mode were combined using MScombine package (Calderón-Santiago et al. 2016). The resulting CSV and GC-MS files were then separately imported into SIMCA-P+. For MVA, all data were log transformed and pareto scaled. The unsupervised principal component analysis (PCA) allowed the visualization of the global organization of the samples. The supervised orthogonal partial least square discriminant
Page 20 sur 36 analysis (OPLS-DA) was made with the names of species as qualitative Y input. Clearly genetically identified plant individuals (similarity score > 99%) were the starting point from which to build OPLS-DA models. Unidentified violets were predicted by projection in potential observable clusters. Coefficient scores were used to rank variables according to their chemotaxonomic biomarker potential. For each model, a leave-one-subject-out cross-validation was performed to assess the model fit. The validity of the discriminant model was verified using permutation tests (Y-scrambling).
4.10 Identification of significant features
Using the OPLS-DA regression analysis results, molecular formulae and structural identification of significant features were calculated with MS-FINDER 2.22 (Tsugawa et al. 2016) based on our previously described model (Chervin et al. 2017). An in-house database based on Viola matches inside the Dictionary of Natural Products (DNP, CRC press, v25:2) extended to the chemical classes and of local databases within MS-FINDER (KNApSAck, PlantCyc and UNPD) were used. For each compound, the results afforded several candidates and ranked them according to their similarity score, which was based on comparison between experimental MS/MS fragments and in silico spectra of candidates.
For cyclotide identification, a homemade database based on cyclotides found in the DNP was built, clarifying m/z of [M+3H]3+ and [M+4H]4+, and imported within MZmine with a m/z
tolerance of 10 ppm.
For volatile compounds, identification was based on retention time matching with NIST MS Search 2.2 (National Institute of Standards and Technology, Gaithersburg, MD, USA) mass spectral database and EI-MS databases proposed with MS-DIAL. The injection of standards analyzed with the same GC-MS method was undertaken in order to validate these results by comparing retention times and mass spectra.
4.11 Correlation network
The text file format exported from MS-DIAL was cleaned-up by eliminating adducts and keeping only peaks with MS/MS data before importation into MetamapR (version 1.4.0) (Grapov et al. 2015). A correlation network was created using the Spearman model and a p-value set to 5.10-6. The calculated edge list was then downloaded and processed with Cytoscape
2.8.3 (Shannon et al. 2003). An attribute file containing all processed information was imported to improve network visualization and interpretation. The mean average intensity of each peak
Page 21 sur 36 was added to specify the relative part of each compound per species with the use of the plugin “Color Nodes”.
5 Acknowledgements
The authors would like to thank the Regional Council Occitanie for sponsoring this project (Project CLE 13053062), as well as the municipal greenhouses of Toulouse for making the violet collection available to its collaborators. The authors also would like to thank Professor Isabelle Fourasté for her help in botanical identification of Violets traits.
6 Funding
Page 22 sur 36 7 Supplementary data
1
Figure S1. Sequence alignment of experimental sequences and Viola references 2
Figure S2. Cladogram based on a distance model with 80 well-defined experimental sequences 3
and some references. These latter were informed and the other dot corresponds to samples. The 4
outgroup was used to root the tree. Bootstrap values to study robustness are indicated in red. 5
Figure S3: Flower phenotypes of violets belonging to V. alba (a), V. sp Hearn (b), V. subs 6
Rostratae (c), V. suavis (d), and V. odorata (e).
7
Figure S4: Kinetic study of volatile emission showing quantitative but not qualitative 8
variabilities 9
Figure S5: Permutation test of GC-MS data 10
Figure S6.1 In silico identification of native volatiles biomarkers 11
Figure S6.2 Chromatographic characteristics of identified volatile compounds and associated 12
MS/MS spectra 13
Figure S7: Permutation test of UHPLC-HRMS data 14
Figure S8: PCA of kinetic study of secondary metabolite compounds from violet of Toulouse 15
(V. alba) showing no qualitative variation due to a good clustering pattern 16
Figure S9: Consensus tree combining ITS sequences and LC-MS data built with parsimony 17
method. The outgroup is used to root the tree. Bootstrap values to study robustness are indicated 18
in red. 19
Figure S10:HCA analysis based on PCA plot confirming the five distinct clades correlated to 20
species 21
Figure S11: Correlation network of NI and PI UHPLC data 22
Figure S12: In silico identification of secondary metabolite biomarkers 23
Tables S1. Sequence references from Genbank 24
Table S2 : Resemblance and divergence of morphological and anatomical characters of the six 25
main species identified in the collection 26
Table S3: Doehlert matrix (coded values X1=balancing, X2=adsorption) and respective 27
experimental conditions (real values) 28
Table S4 : Experimental number of peak (Yexp) and predicted one by the quadratic model 29
(Ycalc) 30
Table S5 Experimental integration of peaks (Yexp), and predicted one by the quadratic model 31
(Ycalc) 32
Table S6: Validation of the theoretical and practical optimums for the HS-SPME-GC-MS 33
analysis of native volatiles 34
8 References
Aceto, S., Paolo C., Salvatore C., Luciano G., and Aldo M., 1999. Phylogeny and Evolution of Orchis and Allied Genera Based on ITS DNA Variation: Morphological Gaps and Molecular Continuity. Molecular Phylogenetics and Evolution 13 (1): 67–76.
Álvarez, I., 2003. ‘Ribosomal ITS Sequences and Plant Phylogenetic Inference’. Molecular
Phylogenetics and Evolution 29 (3): 417–34. https://doi.org/10.1016/S1055-7903(03)00208-2.
Anhut, S., Biehl, J., Seeger, T., Mues, R., and Zinsmeister, H. D., 2014. Flavone-C-Glycosides from the Mosses Plagiomnium elatum and Plagiomnium cuspidatum. Zeitschrift für
Page 23 sur 36 Arnold, M.L., 2006. Evolution through Genetic Exchange. Oxford ; New York: Oxford University Press.
Arot Manguro, L.O., Wagai, S, Lemmen, P., 2006. Flavonol and iridoid glycosides of Ajuga remota aerial parts. Phytochemistry, 67(8), 830–837. doi:10.1016/j.phytochem.2006.01.005
Baldwin, B.G., Sanderson M.J., Porter J.M.,. Wojciechowski, M.F., Campbell, C.S., and Donoghue, M.J., 1995. The ITS Region of Nuclear Ribosomal DNA: A Valuable Source of Evidence on Angiosperm Phylogeny. Annals of the Missouri Botanical Garden 82 (2): 247. https://doi.org/10.2307/2399880.
Ballard, H.E., Sytsma, K.J. and Kowal, R.R. 1999. Shrinking the Violets: Phylogenetic Relationships of Infrageneric Groups in Viola (Violaceae) Based on Internal Transcribed Spacer DNA Sequences. Systematic Botany 23 (4): 439–58. https://doi.org/10.2307/2419376.
Batista, M. T., and Gomes, E. T., 1993. C-glycosylflavones from Ceratonia siliqua cotyledons. Phytochemistry, 34(4): 1191–1193. doi:10.1016/s0031-9422(00)90745-3
Benayad, Z., Gómez-Cordovés, C., and Es-Safi, N., 2014. Characterization of Flavonoid Glycosides from Fenugreek (Trigonella Foenum-Graecum) Crude Seeds by HPLC–DAD– ESI/MS Analysis. International Journal of Molecular Sciences 15 (11): 20668–85. https://doi.org/10.3390/ijms151120668.
Benjamini, Y., and Hochberg, Y., 1995. Controlling the False Discovery Rate: A Practical and Powerful Approach to Multiple Testing. Journal of the Royal Statistical Society. Series B
(Methodological), 289–300.
Bonnier, G., and Douin, R., 1990. La Grande Flore En Couleurs. Vol. 3. Nouvelles Flores de Bonnier. Belin.
Calderón-Santiago, M., Fernández-Peralbo, M.A., Priego-Capote, F., and Luque de Castro, M.D., 2016. ‘MSCombine: A Tool for Merging Untargeted Metabolomic Data from High-Resolution Mass Spectrometry in the Positive and Negative Ionization Modes’. Metabolomic 12 (3): 1–12. https://doi.org/10.1007/s11306-016-0970-4.
Cennamo, P., Del Guacchio, E., Jury, S.L., and Caputo, P., 2011. Molecular Markers in Viola
L. Subsect. Viola : Application and Taxonomic Implications for the Identification of Dubious
Herbarium Specimens. Plant Biosystems - An International Journal Dealing with All Aspects
of Plant Biology 145 (2): 306–23. https://doi.org/10.1080/11263504.2011.558681.
Chervin, J., Perio, P., Martins-Froment, N., Pharkeovilay, C., Reybier, K., Nepveu, F., Fabre, N., Talou, T., Bonzon-Ponnet, V., and Marti, G., 2017. Dereplication of Natural Products from Complex Extracts by Regression Analysis and Molecular Networking: Case Study of Redox-Active Compounds from Viola alba subsp. dehnhardtii’. Metabolomic 13 (8). https://doi.org/10.1007/s11306-017-1227-6.
Clausen, J., 1927. Chromosome Number and the Relationship of Species in the Genus Viola.
Annals of Botany 41 (164): 677–714.
Conesa, M., Mus, M., and Rosselló, J.A., 2008. Hybridization between Insular Endemic and Widespread Species of Viola in Non-Disturbed Environments Assessed by Nuclear Ribosomal
Page 24 sur 36 and CpDNA Sequences. Plant Systematics and Evolution 273 (3–4): 169–77. https://doi.org/10.1007/s00606-008-0006-2.
Cox, D.G., Oh, J., Keasling, A., Colson, K.L., and Hamann, M.T., 2014. The Utility of Metabolomic in Natural Product and Biomarker Characterization. Biochimica et Biophysica
Acta 1840 (12): 3460–74. https://doi.org/10.1016/j.bbagen.2014.08.007.
Craik, D. J., Daly, N. L., Bond, T., and Waine, C., 1999. Plant Cyclotides: A Unique Family of Cyclic and Knotted Proteins that Defines the Cyclic Cystine Knot Structural Motif. Journal
of Molecular Biology, 294(5), 1327–1336. doi:10.1006/jmbi.1999.3383
Djoumbou Feunang, Y., Eisner, R., Knox, C., Chepelev, L., Hastings, J., Owen, G., Fahy, E., Steinbeck, C., Subramanian, S., Bolton, E., Greiner, R. and Wishart, D. S., 2016. ClassyFire: automated chemical classification with a comprehensive, computable taxonomy. Journal of cheminformatics, 8(61) DOI 10.1186/s13321-016-0174-y
Dong, M.W., and Zhang, K., 2014. Ultra-High-Pressure Liquid Chromatography (UHPLC) in Method Development. TrAC Trends in Analytical Chemistry 63 (December): 21–30. https://doi.org/10.1016/j.trac.2014.06.019.
Erben, M., 1996. The Significance of Hybridization on the Forming of Species in the Genus
Viola. Bocconea 5 (1): 113–118.
Eriksson, L., Trygg, J., and Wold, S., 2008. CV-ANOVA for Significance Testing of PLS
and OPLS® Models. Journal of Chemometrics 22 (11–12): 594–600.
https://doi.org/10.1002/cem.1187.
Ferreira, S., 2004. Doehlert Matrix: A Chemometric Tool for Analytical Chemistry - Review. Talanta 63 (4): 1061–67. https://doi.org/10.1016/j.talanta.2004.01.015.
Ferreres, F., Silva, B.M., Andrade, P.B., Seabra, R.M., and Ferreira, M.A., 2003. Approach to the Study of C-Glycosyl Flavones by Ion Trap HPLC-PAD-ESI/MS/MS: Application to Seeds of Quince (Cydonia oblonga). Phytochemical Analysis 14 (6): 352–59. https://doi.org/10.1002/pca.727.
Jung, M., Geiger, H., Zinsmeister, H. D., 1995. Tri- and tetrahydroxycoumarin derivatives from Tetraphis pellucida. Phytochemistry, 39(2): 379-381.
Levin, D.A., Francisco-Ortega, J., and Jansen, R.K., 1996. Hybridization and the Extinction of Rare Plant Species. Conservation Biology 10 (1): 10–16.
Luo, J.-L., Lu, F.-L., Liu, Y.-C., Shih, Y.-C. and Lo, C.-F., 2013. Fingerprint Analysis of
Ginkgo biloba Extract and Ginkgo semen in Preparations by LC-Q-TOF/MS. Journal of Food and Drug Analysis, 21(1): 27-39
Malécot, V., Marcussen, T., Munziger, J., Yockteng, R., and Henry, M., 2007. On the Origin of the Sweet-Smelling Parma Violet Cultivars (Violaceae): Wide Intraspecific Hybridization, Sterility, and Sexual Reproduction. American Journal of Botany 94 (1): 29–41.
Page 25 sur 36 Marcussen, T., Karlsson, T., Jonsell, B., and Wind, P., 2010. Violaceae. In Flora Nordica, 6:12–52. Stockholm: The Bergius Foundation.
Marcussen, T., Yousefi, N., and Mehrvarz, S.S., 2012. Anatomical Studies on Selected Species of Viola (Violaceae). Nordic Journal of Botany 30 (4): 461–69. https://doi.org/10.1111/j.1756-1051.2011.01266.x.
Martucci, M.E.P., De Vos, R.C.H., Carollo, C.A., and Gobbo-Neto, L., 2014. Metabolomic as a Potential Chemotaxonomical Tool: Application in the Genus Vernonia Schreb. Edited by
Jamshidkhan Chamani. PLoS ONE 9 (4): e93149.
https://doi.org/10.1371/journal.pone.0093149.
Mereda, P., Hodalova, I., Martonfi, P., Kucera, J., and Lihova, J., 2008. Intraspecific Variation in Viola suavis in Europe: Parallel Evolution of White-Flowered Morphotypes.
Annals of Botany 102 (3): 443–62. https://doi.org/10.1093/aob/mcn117.
Mereda, P., Hodalova, I., and Kucera, J., 2011. Genetic and Morphological Variation in
Viola suavis s.l. (Violaceae) in the Western Balkan Peninsula : Two Endemic Subspecies
Revealed. Systematics and Biodiversity 9: 211–31.
Muhammad, N., Saeed, M., Adhikari, A., Muhammad, K., 2013. Isolation of a new bioactive cinnamic acid derivative from the whole plant of Viola betonicifolia, Journal of Enzyme
Inhibition and Medicinal Chemistry, 28:5, 997-1001,
https://doi.org/10.3109/14756366.2012.702344
Mullis, K., Faloona, F., Scharf, S., Saiki, R. K., Horn, G. T., and Erlich, H., 1986. Specific Enzymatic Amplification of DNA in Vitro: The Polymerase Chain Reaction. In Cold Spring
Harbor Symposia on Quantitative Biology, 51:263–273. Cold Spring Harbor Laboratory Press.
http://symposium.cshlp.org/content/51/263.extract.
Overy, S. A., 2004. Application of Metabolite Profiling to the Identification of Traits in a Population of Tomato Introgression Lines. Journal of Experimental Botany 56 (410): 287–96. https://doi.org/10.1093/jxb/eri070.
Perez de Souza, L., Naake, T., Tohge, T., and Fernie, A.R., 2017. From Chromatogram to Analyte to Metabolite. How to Pick Horses for Courses from the Massive Web Resources for
Mass Spectral Plant Metabolomic. GigaScience 6 (7): 1–20.
https://doi.org/10.1093/gigascience/gix037.
Poth, A. G., Colgrave, M. L., Philip, R., Kerenga, B., Daly, N. L., Anderson, M. A., & Craik, D. J., 2011. Discovery of Cyclotides in the Fabaceae Plant Family Provides New Insights into the Cyclization, Evolution, and Distribution of Circular Proteins. ACS Chemical Biology, 6(4):345–355. doi:10.1021/cb100388j
Pruitt, K. D., 2004. NCBI Reference Sequence (RefSeq): A Curated Non-Redundant Sequence Database of Genomes, Transcripts and Proteins. Nucleic Acids Research 33 (Database issue): D501–4. https://doi.org/10.1093/nar/gki025.
Page 26 sur 36 Smedsgaard, J., and Nielsen, J., 2005. Metabolite Profiling of Fungi and Yeast: From Phenotype to Metabolome by MS and Informatics. Journal of Experimental Botany 56 (410): 273–86. https://doi.org/10.1093/jxb/eri068.
Sumner, L.W., Amberg, A., Barrett, D., Beale, M. H., Beger, R., Daykin, C.A., Fan, T.W.M., 2007. Proposed Minimum Reporting Standards for Chemical Analysis: Chemical Analysis Working Group (CAWG) Metabolomics Standards Initiative (MSI). Metabolomics 3 (3): 211– 21. https://doi.org/10.1007/s11306-007-0082-2.
Swofford, D.L., 2001. PAUP*: Phylogenetic Analysis Using Parsimony (and Other Methods) 4.0.B5. Sinauer Associates, Sunderland, Massachusetts.
Todesco, M., Pascual, M.A., Owens, G.L., Ostevik, K.L., Moyers, B.T., Hübner, S. Heredia, S.M., 2016. Hybridization and Extinction. Evolutionary Applications 9 (7): 892–908. https://doi.org/10.1111/eva.12367.
Tutin, T.G., Moore, D.M., Valentine, D.H., Walters, S.M., and Webb, D.A., 1968. Violaceae. In Flora Europaea, 2:270–75. Cambridge University Press.
Vercammen, J., Sandra, P., Baltussen, E., Sandra, T., and David, F., 2000. Considerations on Static and Dynamic Sorptive and Adsorptive Sampling to Monitor Volatiles Emitted by Living Plants. Journal of High Resolution Chromatography 23 (9): 547–53. https://doi.org/10.1002/1521-4168(20000901)23:9<547::AID-JHRC547>3.0.CO;2-7.
Xie, H.-H. and Yoshikawa, M., 2013. Further acylated flavonol bisdesmosides from
Sinocrassula indica. Journal of Asian Natural Products Research, 15(8): 885–890,
http://dx.doi.org/10.1080/10286020.2013.800973
Yockteng, R., Ballard H.E.Jr., Mansion, G., Dajoz, I., and Nadot, S., 2003. Relationships among Pansies (Viola Section Melanium) Investigated Using ITS and ISSR Markers. Plant
Systematics and Evolution 241: 153–70. https://doi.org/10.1007/s00606-003-0045-7.
Yoo, K.-O., and Jang, S.-K., 2010. Infrageneric Relationships of Korean Viola Based on Eight Chloroplast Markers. Journal of Systematics and Evolution 48 (6): 474–81. https://doi.org/10.1111/j.1759-6831.2010.00102.x.
Zahid, M., Saeed, M., Asim, M., Ishrud, O., Wu, S., Ahma, V. U. and Pan, Y., 2003. New Glycosides from Salvia moorcroftiana (Lamiaceae). Helvetica Chimica Acta, 86: 2021-2027
Page 27 sur 36 Fig. 1 Cladograms obtained with maximum parsimony (A) and maximum likelihood (B) method showing genetic relationship of selected experimental sequences and references based on ITS sequences. To improve the quality of the figure, only sequences of a few characteristic samples from each clade observed with distance model were selected for B. The outgroup is used to root the tree. Bootstrap values to study robustness are indicated in red (in colour).
Page 28 sur 36 Fig. 2 Strategy of classification based on training and prediction sets. Pie charts show the distribution of classification results
Page 29 sur 36 Fig. 3 PCA score plot of GC-EIMS data from SPME flower extracts using binarized data (in colour).
Page 30 sur 36 Fig. 4 OPLS-DA base model of GC-EIMS data (A) and prediction set of unidentified violets (B). Well-projected violets are
Page 31 sur 36 Fig. 5 Specific volatile profiles with identification of characteristic volatile biomarkers for each OPLS-DA cluster of
Page 32 sur 36 Fig. 6 PCA score plot of UHPLC-HRMS-ESI-NI/PI combined dataset from violets leaf extracts (in colour).
Page 33 sur 36 Fig. 7 OPLS-DA base model of UHPLC-HRMS-ESI-NI/PI combined dataset (A) and prediction set of unidentified violets
Page 34 sur 36 Fig. 8 Correlation network based on ESI-NI/PI combined dataset of UHPLC-HRMS performed on leaf extracts and identification of characteristic biomarkers. Color tag is based on species identification by genetic analysis. Node size was emphasized based on OPLS-DA coefficient value. Putative structures were based on HRMS and MS/MS spectra and correspond to the first hit in MS-FINDER as annotation illustration (in colour).