HAL Id: hal-01255767
https://hal.archives-ouvertes.fr/hal-01255767
Submitted on 14 Jan 2016
HAL is a multi-disciplinary open access
archive for the deposit and dissemination of sci-entific research documents, whether they are pub-lished or not. The documents may come from teaching and research institutions in France or abroad, or from public or private research centers.
L’archive ouverte pluridisciplinaire HAL, est destinée au dépôt et à la diffusion de documents scientifiques de niveau recherche, publiés ou non, émanant des établissements d’enseignement et de recherche français ou étrangers, des laboratoires publics ou privés.
Decadal freshening of the Antarctic Bottom Water
exported from the Weddell Sea
Loïc Jullion, Alberto C. Naveira Garabato, Michael P. Meredith, Paul
Holland, Peggy Courtois, Brian A. King
To cite this version:
Loïc Jullion, Alberto C. Naveira Garabato, Michael P. Meredith, Paul Holland, Peggy Courtois, et al.. Decadal freshening of the Antarctic Bottom Water exported from the Weddell Sea. Journal of Climate, American Meteorological Society, 2013, 26 (20), pp.8111-8125. �10.1175/JCLI-D-12-00765.1�. �hal-01255767�
Generated using version 3.2 of the official AMS LATEX template
Decadal freshening of the Antarctic Bottom Water exported from
1
the Weddell Sea
2
Lo¨ıc Jullion,
∗Alberto C. Naveira Garabato
University of Southampton, National Oceanography Centre, Southampton, United Kingdom,
3
Michael P. Meredith,
British Antarctic Survey, Cambridge, United Kingdom
Scottish Association for Marine Science, Oban, U.K.
4
Paul R. Holland,
British Antarctic Survey, Cambridge, United Kingdom,
5
Peggy Courtois,
University of Southampton, National Oceanography Centre, Southampton, United Kingdom,
6
Brian A. King
National Oceanography Centre, Southampton, United Kingdom,
7
∗Corresponding author address: Lo¨ıc Jullion, Geophysical Fluid Dynamics Institute, Florida State
Uni-versity, Tallahassee, FL 32306, USA E-mail: l.jullion@fsu.edu
ABSTRACT 8
Recent decadal changes in Southern Hemisphere climate have driven strong responses from 9
the cryosphere. Concurrently, there has been a marked freshening of the shelf and bottom 10
waters across a wide sector of the Southern Ocean, hypothesised to be caused by accelerated 11
glacial melt in response to a greater flux of warm waters from the Antarctic Circumpolar 12
Current onto the shelves of West Antarctica. However, the circumpolar pattern of changes 13
has been incomplete: no decadal freshening in the deep layers of the Atlantic sector had been 14
observed. In this study, we document a significant freshening of the Antarctic Bottom Water 15
exported from the Weddell Sea, which is the source for the abyssal layer of the Atlantic 16
overturning circulation, and we trace its possible origin to atmospheric-forced changes in 17
the ice shelves and sea ice on the eastern flank of the Antarctic Peninsula that include an 18
anthropogenic component. These findings suggest that the expansive and relatively cool 19
Weddell gyre does not insulate the bottom water formation regions in the Atlantic sector 20
from the ongoing changes in climatic forcing over the Antarctic region. 21
1. Introduction
22
Antarctic Bottom Water (AABW), filling the deepest layer of the World’s oceans, plays 23
a critical role in the lower limb of the global oceanic overturning circulation, and contributes 24
to the regulation of Earth’s climate by storing heat, freshwater and biogeochemical tracers in 25
the abyssal ocean (Orsi et al. 1999). Changes in the properties of AABW or in the strength 26
of its circulation have the potential to impact significantly on the global ocean’s energy 27
budget, sea level and the deep ocean ecosystem (Purkey and Johnson 2010; Church et al. 28
2011; Sutherland et al. 2012). 29
The properties of AABW are set by interactions between the ocean, the atmosphere and 30
the cryosphere in the margins of Antarctica, and are very sensitive to the drastic and rapid 31
climate changes occurring in the region (Foster and Carmack 1976; Gill 1973; Orsi et al. 1999; 32
Jacobs 2004; Nicholls et al. 2009). Near the continental slope, Warm Deep Water (WDW) 33
originating in the Antarctic Circumpolar Current (ACC) penetrates onto the shelf in certain 34
locations, often in modified form. This mixes with cold shelf waters that are made saline by 35
brine rejection during sea ice formation, creating dense products that spill off the shelf and 36
entrain further mid-layer waters as they descend in plumes (Killworth 1974; Carmack and 37
Foster 1975; Foldvik et al. 2004; Wilchinsky and Feltham 2009). Interaction of shelf waters 38
with the underside of floating ice shelves is also important in setting the properties of some 39
of the shelf waters, with temperatures below the surface freezing point made possible by the 40
pressure at which the interaction occurs (Nicholls et al. 2009). 41
In the Weddell Sea, the locally-formed variety of AABW is comprised of two water masses, 42
namely Weddell Sea Bottom Water (WSBW) and Weddell Sea Deep Water (WSDW). 43
WSBW, formed primarily in the southern Weddell Sea near Filchner-Ronne Ice shelf (Nicholls 44
et al. 2009), is the coldest and densest of AABW varieties (Θ < −0.7◦C, γ
n>28.31 kg m−3).
45
WSBW is too dense to overflow the topographic barriers isolating the Weddell Sea from the 46
lower latitude Southern Ocean to the north (Fig 1a). The lighter WSDW (28.26 < γn<28.31
47
kg m3
, 0◦ >Θ > −0.7◦C) is either produced directly by mixing between dense shelf waters
and WDW (Foldvik et al. 2004; Nicholls et al. 2009), or indirectly by slow diapycnal up-49
welling of WSBW within the Weddell gyre. The WSDW formed near the Larsen ice shelves 50
(LIS) in the western Weddell Sea (Fig 1b) is generally lighter and fresher than the AABW 51
formed further south (Fahrbach et al. 1995; Gordon et al. 2001; Huhn et al. 2008; Gordon 52
et al. 2010) and is preferentially exported toward the Scotia Sea through several deep gaps 53
in the South Scotia Ridge (Naveira Garabato et al. 2002b). 54
The occurrence of extensive decadal-scale changes in the bottom layer of the ocean has 55
been reported recently.The abyssal layer of the Southern Hemisphere oceans warmed signif-56
icantly between the 1980s and the 2000s (Johnson and Doney 2006; Johnson et al. 2008a,b; 57
Purkey and Johnson 2010). Purkey and Johnson (2012) argued that this warming was po-58
tentially an indication of a slowdown of the lower limb of the MOC. In the Indian and Pacific 59
sectors of the Southern Ocean, AABW and its precursor shelf waters have been freshening 60
since the 1960s. In the Ross Sea, the shelf and bottom waters have freshened at rates of 0.03 61
decade−1 and 0.01 decade−1, respectively, since 1958 (Jacobs and Giulivi 2010). Off Ad´elie
62
Land, Aoki et al. (2005) and Rintoul (2007) reported an AABW freshening of 0.03 between 63
the 1990s and the mid-2000s. The origin of the freshening trend in the Indo-Pacific sector of 64
the Southern Ocean has been attributed to an accelerated melting of the ice shelves of West 65
Antarctica (Shepherd et al. 2004; Rintoul 2007; Jacobs et al. 2002; Jacobs and Giulivi 2010), 66
where the proximity of the ACC to the continent allows warm water to flood the coastal 67
areas (Thoma et al. 2008; Jacobs et al. 2011). 68
In the Weddell Sea, however, no evidence of a freshening of the AABW has thus far 69
been found (Fahrbach et al. 2011). Using 8 hydrographic sections along the Greenwich 70
meridian between 1984 and 2008, Fahrbach et al. (2011) suggested that the WSDW and 71
WSBW in the central Weddell Sea were dominated by multi-annual cycles. This lack of 72
a clear freshening trend has led to the perception of this sector as being largely resilient 73
to the ongoing changes in Southern Hemisphere climate, most likely due to the region’s 74
ice shelves being sheltered from the influence of the ACC by the cyclonic Weddell gyre. 75
Recently, however, model simulations have raised the prospect of potentially rapid changes 76
in the southern Weddell Sea ice shelves in response to atmospheric-driven perturbations in 77
the ocean circulation caused in part by receding sea ice (Hellmer et al. 2012). The realism 78
of the climatic sensitivities of AABW properties apparent in these model results is unclear, 79
but it does call for further detailed understanding of the response of the ocean-ice system in 80
the Atlantic sector to climatic changes in forcing, underpinned by observations. 81
Here we provide direct evidence that the AABW exported from the Weddell gyre to the 82
lower limb of the Atlantic Meridional Overturning Circulation has been freshening over the 83
last decade, and trace the most likely origin of this freshening to atmospheric-forced ice shelf 84
collapse, deglaciation and sea ice changes on the eastern side of the Antarctic Peninsula. 85
These findings complete the pattern of circumpolar freshening of dense waters of Antarctic 86
origin, but also suggest that the processes driving the freshening in the Atlantic sector are 87
distinct from those in the Indo-Pacific sector. 88
2. Data
89
a. The SR1b repeat hydrographic section
90
Detection and attribution of decadal change in ocean circulation and climate is a fore-91
most problem in global environmental sciences. In the upper ocean, the advent of an array 92
of profiling floats has revolutionised the ability to quantify and understand such changes 93
(Roemmich et al. 2009), but achieving the same in the deep ocean remains a significant 94
challenge. Nowhere is this more true than in the data-sparse Southern Ocean. In this con-95
text, the SR1b repeat hydrographic section in Drake Passage (between South America and 96
the tip of the Antarctic Peninsula; Fig.1a) represents a unique data set. It is one of the most 97
frequently occupied continent-to-continent oceanographic transects in the world, with 18 oc-98
cupations since 1993. There have been only two Antarctic summer seasons (1995/1996 and 99
1998/1999) in which the SR1b transect could not be conducted due to logistical constraints. 100
During the 2008/2009 season, there were two occupations of the section within 3 months, 101
the common November-December occupation, and another in February 2009 (Table 1). 102
The Drake Passage hydrographic programme is a joint effort between the National 103
Oceanography Centre in Southampton and the British Antarctic Survey in Cambridge, U.K. 104
Most section occupations were conducted using the RRS James Clark Ross. Each occupation 105
typically consists of 30 full-depth conductivity-temperature-depth (CTD) stations between 106
Burdwood Bank and Elephant Island in the eastern Drake Passage, with a typical horizontal 107
resolution of 30 nautical miles. In early cruises, the data were collected using a Neil Brown 108
Instrument MkIIIc CTD, whereas the later cruises were undertaken using a SeaBird 911 109
plus CTD. A description of the CTD calibration and measurement errors is given in the 110
Appendix. Characteristic distributions of potential temperature and salinity are shown in 111
Fig. 2b,c. AABW, defined for this work as the water denser than γn = 28.26 kg m−3, fills
112
the abyssal layer of the southern end of the section, its northward extent being delineated 113
by the Polar Front (Fig. 2). 114
In the ACC, averaging properties over a fixed latitudinal band and pressure range can 115
introduce biases due to isopycnal heave and frontal displacement. On the other hand, the 116
contrary, the use of neutral density (γn; Jackett and McDougall (1997)) as a vertical axis
117
isolates property changes on isopycnals from those associated with heave, whilst dynamic 118
height (φ) as a horizontal axis provides an accurate proxy for the cross-stream positioning 119
of observations within the ACC. The along-section gradient in φ has been shown to agree 120
well with the thermohaline definition of the ACC fronts given in Orsi et al. (1995) (see 121
Naveira Garabato et al. (2009) for more details). Therefore, to prevent ACC frontal mean-122
dering and isopycnal heave from affecting our record of AABW properties, the data from 123
each of the 18 repeat sections are here gridded in γn - φ space. For this study, we use φ at
124
400 dbar relative to 2000 dbar (Figure 2a) so as to exclude the influence of high-frequency 125
upper-ocean water mass variability and of changes in the bottom layer under scrutiny here. 126
An assessment of the propagation of the CTD measurement errors through the gridding 127
procedure is given in the Appendix. 128
b. Sea ice concentration
129
Monthly means of sea ice concentration from the Nimbus-7 SMMR and DMSP SSM/I-130
SSMIS Passive Microwave sea ice concentration measurements between October 1978 and 131
December 2010 (Cavalieri et al. 1996) were obtained from the National Snow and Ice Data 132
Center in Boulder, USA (http://nsidc.org/). Since 1 January 2011, the daily mean sea ice 133
concentration based solely on DMSP SSM/I-SSMIS data (Maslanik 1999) were obtained 134
from the same data centre, and the monthly means calculated subsequently. 135
3. Freshening of AABW
136
The SR1b repeat hydrographic section is optimally located to study changes in the 137
AABW outflow from the Weddell Sea. It lies directly downstream of the Orkney Pas-138
sage, the main gap in the South Scotia Ridge through which AABW flows into the Scotia 139
Sea (Naveira Garabato et al. 2002b; Nowlin Jr and Zenk 1988), and a sufficient distance 140
downstream of the AABW source regions for the substantial seasonal signal in outflow speed 141
and properties (Gordon et al. 2010) to be largely eroded. AABW is always present at the 142
southern end of the section, typically occupying the bottom 500-1000m of the water column 143
south of the Polar Front (Fig. 2). 144
The deep Θ-S properties, gridded in dynamic height and neutral density, south of the 145
Polar Front are shown in Figure 3. For clarity, the mean Θ-S profile for each section is shown. 146
The two deep water masses exhibit different types of variability. The Lower Circumpolar 147
Deep Water (LCDW), characterized by a temperature and salinity maximum, does not 148
exhibit a long-term change in its thermohaline properties as the most recent sections (light 149
colors) are superimposed on top of the earliest sections (Fig. 3, left panel). On the contrary, 150
the AABW has experienced a steady decrease in salinity (and a simultaneous temperature 151
decrease along isopycnals) since occupation of the section commenced, as manifested in the 152
progressive displacement of the entire deep Θ - salinity profile below 28.26 kg m−3 toward
153
lower salinity values (Fig. 3, right panel). 154
For each section occupation, the salinity is averaged between γn = 28.26 kg m−3 (the
155
upper bound of AABW in Drake Passage) and γn= 28.31 kg m−3 (the densest AABW class
156
that is present in all section occupations), and the thickness of the layer bounded by the 157
two density surfaces is calculated. This procedure excludes the component of interannual 158
variability in AABW properties introduced by the intermittent presence of denser AABW 159
classes, which has been shown to reflect wind-driven changes in the flow of AABW over the 160
South Scotia Ridge (Fig. 1) rather than perturbations to AABW properties at formation 161
(Jullion et al. 2010; Meredith et al. 2011). 162
The resulting time series (Fig. 4a) shows a statistically significant (at the 99% level of 163
confidence) freshening tendency of 0.004 decade−1, totalling 0.007 (std = 0.0033) between
164
1993 and 2011. A 2 point regression model did not find any statistically significant point of 165
inflection in the trend, suggesting that it is not possible to determine precisely the starting 166
time of the trend based on the available data. All the data used were collected during the 167
same Antarctic late spring / summer season, thus reducing the possibility of any seasonal 168
aliasing of the trend. Moreover, the two occupations in the 2008/2009 season exhibit little 169
difference in the AABW salinity despite having been conducted three months apart (Fig. 170
4a), suggesting negligible intra-seasonal variability in the AABW properties. No systematic 171
change is observed in the thickness of the AABW layer examined (Fig. 4b), indicating that 172
there is no evidence here for a significant alteration in the rate of AABW export from the 173
Weddell gyre. 174
The same analysis was done for the LCDW salinity maximum (γn = 28.00 − 28.11 kg
175
m−3 - Fig. 4c,d) in order to investigate any inter-cruise biases. The calculated freshening
176
trend is not statistically significant at the 90% significance level (p = 0.14). The LCDW time 177
series is dominated by a multi annual fluctuation, with a period of no salinity change between 178
1993 and 2002 followed by an abrupt salinity decrease between 2003 and 2007 and a recovery 179
between 2008 and 2012. The inter annual variability of LCDW, large compared to the AABW 180
time series, is consistent with Provost et al. (2011) who observed large (0.01 in salinity) high 181
frequency (3 weeks) along stream changes in the LCDW density range during two occupations 182
of a section across Drake Passage. Moreover, there is no statistically significant correlation 183
between the two time series (r = 0.36, p=0.13) confirming that the AABW trend is not 184
dominated by inter-cruises biases. The magnitude of the AABW trend (0.007 between 1993 185
and 2012) is larger than the uncertainties associated with the propagation of measurement 186
errors through the gridding procedure (O(0.0005), see error bars on Figure 4 and Appendix 187
for details). Overall, the absence of correlation between the AABW and LCDW salinity time 188
series and the small errors compared with the trend suggest that the trend observed is not 189
contaminated by inter-cruise biases or by measurement errors. 190
This freshening trend is approximately a factor of 2 smaller than the equivalent freshening 191
trends reported for AABW in the Indo-Pacific sector (Jacobs and Giulivi 2010; Aoki et al. 192
2005; Rintoul 2007). The extent to which the factor-of-two difference in the rate of freshening 193
is influenced by proximity to the source region (which was substantially less in the studies 194
concerned with Indo-Pacific AABW) is unknown, though it is worth noting that intense 195
diapycnal mixing processes in the Orkney Passage and the Scotia Sea (Naveira Garabato 196
et al. 2004) are likely to dampen any signals of source water mass change emanating from 197
the Weddell Sea. 198
The freshening of the AABW in Drake Passage may be conceivably caused by several 199
processes. First, a change in the balance of the rates of AABW export through the different 200
deep passages in the South Scotia Ridge, where thermohaline characteristics differ on isopy-201
cnals (Naveira Garabato et al. 2002a), could result in modified AABW properties north of 202
the ridge. In the absence of sustained observations across all the passages, assessing varia-203
tions in export routes is difficult. Nonetheless, the analysis of a recent repeat of a section of 204
hydrographic and velocity measurements along the South Scotia Ridge in 2010 (Jullion et 205
al, in prep) shows no evidence of significant change relative to a section occupation in 1999 206
(Naveira Garabato et al. 2002b). Perturbations in wind forcing are also thought to influence 207
the export of AABW over the Scotia Ridge (Jullion et al. 2010) on interannual and longer 208
time scales. A decadal-scale weakening of the wind stress over the northern Weddell Sea 209
could potentially explain the freshening by allowing colder, fresher AABW to flow through 210
the Orkney Passage (Meredith et al. 2008). However, the decrease in wind stress that would 211
be required for this is not supported by observations (Marshall et al. 2004). Further, such a 212
decrease in the wind stress would also result in a reduction in the temperature and speed of 213
the AABW outflow (Meredith et al. 2011), thereby leading to a decrease in the volume of 214
AABW in the Scotia Sea for which there is no evidence in our observations (Fig. 4a). 215
Second, a change in the relative contributions of the different source waters that mix 216
to form AABW could be responsible for the observed freshening. AABW is formed as a 217
mixture of two main precursor water masses: the WDW (S∼ 34.5, Θ ∼ −0.5◦C) imported
218
to the Weddell gyre from the ACC, and the high-salinity shelf waters formed during brine 219
rejection (S∼ 34.7, Θ ∼ −1.9◦C). Any modification in the proportion in which these two
220
primary component water masses mix could result in changes in the properties of AABW. 221
Tracer-based studies suggest that the AABW in the northern Weddell Sea is made up of 222
∼ 25% of shelf water. A 5% change in the source water mixing ratio would thus be enough 223
to account for the measured freshening. However, such an increase in the proportion of 224
WDW contributing to AABW production would also drive a warming of the AABW (by 225
∼ 0.07◦C), which is not consistent with our observations. We conclude therefore that a
226
change in the mixing ratio of AABW source waters does not provide a plausible explanation 227
for the observed freshening. Such a change would result in a translation along the existing Θ-228
S relationship, rather than the measured shift to a different Θ-S profile with lower salinities 229
observed here. 230
Finally, a source water mass property change could give rise to the freshening of AABW 231
in Drake Passage. Extensive observations of WDW and the overlying Winter Water in the 232
Weddell Gyre have yielded no indication of a freshening of those water masses over the 233
period of interest (Fahrbach et al. 2011; Behrendt et al. 2011). Therefore, we deduce that 234
the AABW freshening reported here is likely to originate from the second major precursor 235
water mass: the dense shelf waters formed on the continental shelves of the southern or 236
western Weddell Sea. 237
According to the existing literature, the AABW overflowing the South Scotia Ridge 238
is mostly ventilated by relatively fresh shelf waters from the northeastern margin of the 239
Antarctic Peninsula (Gordon et al. 2001), specifically from the continental shelf area off 240
the LIS (Fahrbach et al. 1995; Huhn et al. 2008). That the vicinity of LIS is key to the 241
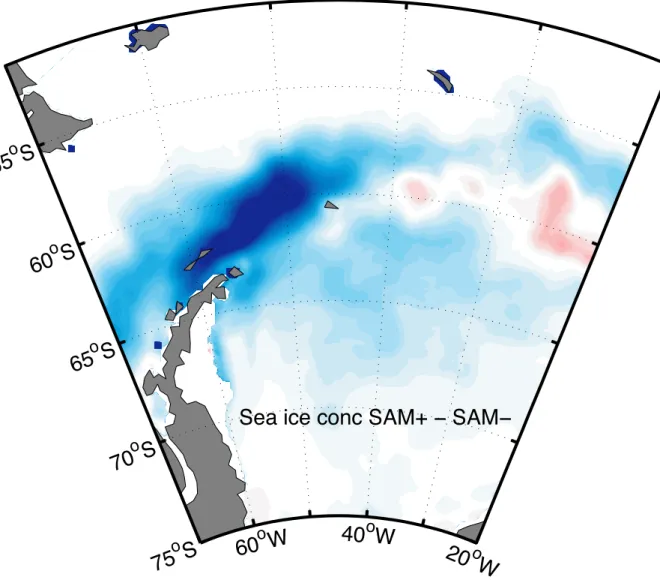
formation of the AABW of interest here is also indicated by the correlation between winter 242
sea ice concentration and AABW salinity in Drake Passage (Fig.5). The correlation is 243
significant, reflecting the role of sea ice production in raising the salinity of the shelf waters 244
sufficiently for them to participate in AABW formation. The lag at peak correlation (15-245
18 months) is consistent with an estimated transit time from the Orkney Passage to the 246
SR1b section area of about 5 months (Meredith et al. 2011), and with an estimated transit 247
time from the LIS region to the Orkney Passage of about 7 months (assuming a distance 248
of 1800 km between the sill of the Orkney Passage and the tip of the Antarctic Peninsula, 249
and a mean deep boundary current speed of 10 cm s−1(Gordon et al. 2010)). The modest
250
level of significance of the correlation (∼ 80%) may be explained by a variety of factors, 251
most notably the unavoidable simplicity of the assumed local linear relationship between 252
sea ice concentration (the measured parameter) and production (the variable of relevance 253
to shelf water salinity) and the relatively low number of degrees of freedom in our time 254
series of measurements. The freshening tendency in Drake Passage is not observed within 255
the AABW formed further south near the Filchner-Ronne Ice Shelf (Fahrbach et al. 2011), 256
which indicates that the freshening originates downstream (to the north) of that region. 257
A further indication that a change in shelf water properties may be the main driver of the 258
measured AABW freshening stems from the recent observation of a significant freshening of 259
the shelf waters (∼ 0.09 ) in the western Weddell Sea between 1989 and 2006 by Hellmer 260
et al. (2011), although we caution that this result was based on observations from only three 261
years in that period. Since the AABW in the Weddell gyre contains around one quarter 262
shelf waters (Meredith et al. 2000), the observed AABW freshening of ∼ 0.007 requires the 263
shelf waters off the LIS to have freshened by ∆S ∼ −0.03 , broadly in line with the previous 264
measurement of a shelf water freshening in the area (Hellmer et al. 2011). In the following, 265
we seek to determine the causes of the shelf water freshening off the LIS. 266
4. Discussion
267
a. A freshwater budget of the LIS region
268
We construct a simplified freshwater budget of the continental shelf region off the LIS 269
to estimate the additional (relative to the pre-freshening era) freshwater volume, Vf w, that
270
is required to have entered the area to explain the observed AABW freshening. It is worth 271
noting that any attempt to calculate an accurate estimate of Vf w and to precisely determine
272
the driving mechanism are subject to significant uncertainty, given the sparse data available 273
in the region. Therefore, we restrict our analyses to order-of-magnitude calculations, so as 274
to identify the processes most likely to play a primary role in the freshening of the AABW. 275
Salt and mass conservation respectively dictate that 276
S0V0ρ0 = SfVfρf, (1)
Vfρf = V0ρ0+ Vf wρf w, (2)
where ρ0, S0 and V0 are the initial in situ density, salinity and volume of the shelf waters,
277
and ρf and Sf are the in situ density and salinity of the shelf waters after modification by
278
the input of an additional freshwater volume, Vf w, of density ρf w. Combining these two
equations, we obtain 280 Vf w = −V 0ρ0 Sfρf w (Sf − S0). (3)
We set ρ0 = 1027 kg m−3 and ρf w = 1000 kg m−3. We define V0 as the volume of the
281
continental shelf adjacent to the LIS where shelf water salinity has been observed to exceed 282
the threshold value for AABW ventilation (Gill 1973). Using available in situ data on the 283
continental shelf (Fig. 1b), the latitudinal extent of the shelf area where the bottom salinity 284
of the shelf waters was greater than Gill’s (1973) threshold is approximated (64◦ − 70◦S).
285
The longitudinal extent of the control volume is defined by the coast and the 1000m isobath 286
based on the GEBCO One Minute bathymetry (http://www.gebco.net/), and the average 287
depth of the shelf is estimated to be approximately 500 m. This yields V0 ∼ 9.10
13
m3
. To 288
estimate Sf, we refer to the most recent stations in the control area, occupied in 2004 (Fig.
289
1b), which reveal that Sf ∼ 34.6 . Thus, we find that Vf w ≈ 8 × 10
10
m3
. 290
b. Origin of the freshening
291
This excess freshwater supply to the control area may have been associated with three 292
mechanisms: an increase in net precipitation; a reduction in sea ice production; or an increase 293
in freshwater runoff from the LIS and tributary glaciers. The plausibility of each of these 294
mechanisms contributing significantly to the observed shelf water freshening is examined 295
next. 296
1) Precipitation 297
In order for the excess freshwater Vf w to have been supplied by an increase in net
pre-298
cipitation in the continental shelf region off the LIS, an additional ∼ 40 cm of freshwater 299
is required to have precipitated there between 1993 and 2011, relative to the pre-freshening 300
era. Estimates of net precipitation in the oceanic region adjacent to the LIS are on the order 301
of 50 cm yr−1 (Bromwich et al. 2011; Munneke et al. 2012), so that a modest percentage
increase in the annual-mean value would have been sufficient to account for the observed 303
freshening signal. A recent intercomparison of several atmospheric reanalyses revealed no 304
detectable decadal-scale tendency in net precipitation in our control region (Bromwich et al. 305
2011). Thus, whilst the uncertainties in the reanalyses do not allow us to rule it out, the 306
scenario of a major contribution to Vf w from an increase in net precipitation is not supported
307
by an existing evidence. 308
2) Sea ice 309
Sea ice production in winter is a key process in the formation of AABW, as the resulting 310
brine rejection makes shelf waters dense enough to cascade down the continental slope. 311
Thus, sea ice production acts as the main transmitter of any climatic signal imprinted in 312
shelf waters (regardless of the signal’s origin) to the AABW layer, and one can expect a 313
relationship between variability in sea ice concentration near the LIS and AABW salinity in 314
Drake Passage. The existence of such a relationship is suggested by the substantial degree 315
of positive correlation that occurs between interannual-scale fluctuations in AABW salinity 316
in the SR1b section and sea ice concentration anomalies off the LIS (Fig.5a). The pattern of 317
the correlation and its lag (15-18 months), described in the previous section, suggest that a 318
reduction in sea ice production cannot be excluded as a contributor to the observed AABW 319
freshening trend. 320
The plausibility of this contribution may be assessed by considering, once again, a simple 321
freshwater budget. Salt and mass conservation dictate that 322
ρ0V0S0 = ρfVfSf + ρsiVsiSsi, (4)
ρ0V0 = ρfVf + ρsiVsi, (5)
where ρsi = 920 kg m−3 and Ssi = 6 are the characteristic density and salinity of sea ice,
323
respectively (Eicken 1997), and Vsi is a change in sea ice volume. From these expressions,
324
we estimate the reduction in sea ice production required to explain the observed freshening 325
as 326 Vsi = − ρ0V0 ρsi(Sf − Ssi) (Sf − S0), (6)
and obtain Vsi ≈ 1.1 × 10¹¹ m3 by substituting the appropriate values quoted above.
As-327
suming a full sea ice cover over the control area (∼ 2 × 10¹¹
m2
) in winter (Stammerjohn 328
et al. 2008) and a characteristic sea ice thickness of 2 m (Zwally et al. 2008), this value 329
of Vsi implies that a reduction of ∼ 25% of the total sea ice production between 1993 and
330
2011 (or a ∼ 1% decrease in the net annual sea ice production averaged between 1993 and 331
2011) is required to account for the observed freshening signal. In the absence of reliable 332
estimates of sea ice production near the LIS, assessing the extent to which a reduction in sea 333
ice production may explain the observed AABW freshening is difficult. Tamura et al. (2008) 334
used sea ice concentration data from satellite and air-sea reanalysis products to estimate 335
the sea ice production in several polynyas around Antarctica (but not near the LIS) and 336
reported a 30% decrease in the production of sea ice in Weddell Sea polynyas between 1992 337
and 2001. Whilst this result suggests that trends of the correct sign and order of magnitude 338
are at least plausible in the region, the lack of appropriate sea ice production estimates for 339
the LIS area prevents us from making a definitive statement on the importance of reduced 340
sea ice production in the observed AABW freshening. 341
3) Increased glacial loss 342
The glaciers and ice shelves of the eastern Antarctic Peninsula have undergone consider-343
able changes over the last 15 years. The break up of major ice shelves (Larsen A in 1995 (Rott 344
et al. 1996) and Larsen B in 2002, (Scambos et al. 2003)) and the subsequent acceleration of 345
their tributary glaciers due to the removal of the ice shelves’ buttressing effect (Rignot et al. 346
2004; Shuman et al. 2011) has resulted in a large volume of ice being discharged to the ocean 347
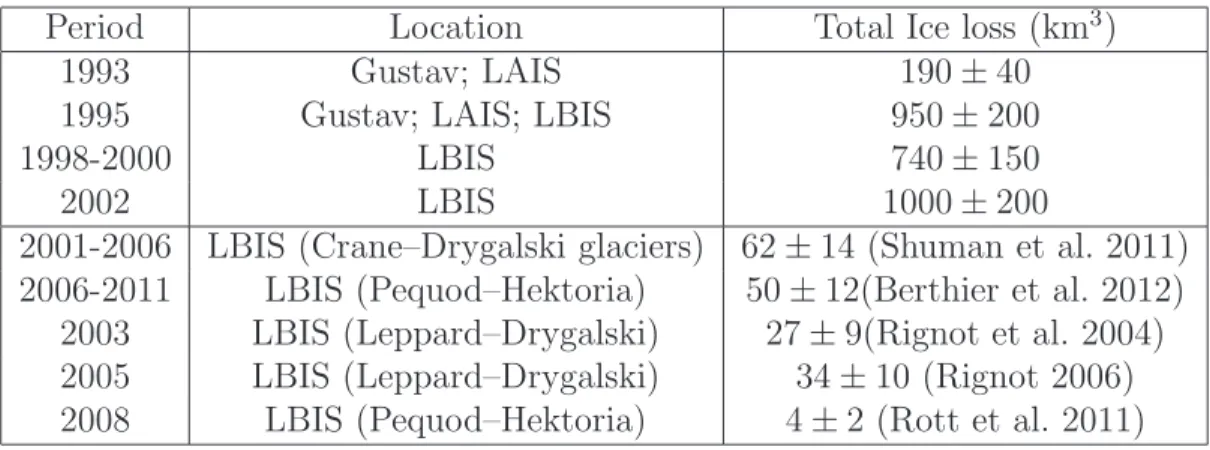
in the control area of our freshwater budget. We estimate the net excess freshwater loss by 348
the ice shelves and their tributary glaciers by collating the findings of a range of glaciological 349
studies (Table 2), and conclude that the volume of freshwater added to the continental shelf 350
off the LIS between 1993 and 2011 was Vgi ∼ 3.2 × 10
12 m3 . The bulk of Vgi (∼ 3 × 10 12 m3 ) 351
is contributed by the disintegration of the ice shelves themselves, whereas the contribution 352
of accelerated tributary glaciers is an order of magnitude smaller (∼ 2 × 10¹¹
m3
). 353
Whilst Vgi dwarfs our estimate of the volume of excess freshwater required to explain the
354
observed freshening signal by two orders of magnitude, the fraction of Vgi that enters the
355
continental shelf in liquid form and thereby effects a freshening of the local shelf waters is 356
uncertain, as it depends on the poorly constrained trajectories and melt rates of the numer-357
ous small icebergs into which the Larsen A and B ice shelves fragmented (Scambos et al. 358
2003; MacAyeal et al. 2003). In the western Weddell Sea, icebergs have been observed to 359
drift at rates on the order of 400 m h−1 (Rack and Rott 2004; Schodlok et al. 2006). The area
360
loss during the collapse of the Larsen A and B ice shelves has been estimated to be around 361
1.1×10¹⁰
m2
(Rack and Rott 2004). Given the characteristic iceberg drift rate and the width 362
of the continental shelf in front of the LIS (∼300 km), the residence time of the icebergs 363
generated by the Larsen A and B ice shelf disintegration events may be crudely estimated at 364
around 1 month. The melting rates of icebergs are uncertain and depend upon iceberg size, 365
geometry and adjacent meteorological (air temperature) and oceanographic (water temper-366
ature) conditions. Observed and modelled melt rates vary by one order of magnitude (0.2-2 367
m month−1 Schodlok et al. (2006); Jansen et al. (2007)). Taking these rates to be
represen-368
tative, the volume lost on the continental shelf off the LIS by the icebergs resulting from 369
the ice shelf collapses may then be estimated as 0.2 − 2 × 10¹⁰
m3
, which is substantially 370
less than Vf w. Whilst the uncertainty surrounding several steps of this calculation again
371
prevents us from being categorical, the estimate suggests that the icebergs deriving from the 372
disintegration of the A and B sectors of the LIS probably played a temporary or minor role 373
in freshening the local shelf waters. 374
The mass loss resulting from the Larsen A and B tributary glaciers after the ice shelf break 375
ups is likely to provide a more significant and persistent source of freshwater to the coastal 376
region off the LIS over the study period than the disintegration of the ice shelves themselves. 377
Silva et al. (2006) reported a modelled total iceberg melt rate of 0.5 m m−2 y−1 for the
378
western Weddell Sea and showed that only 3 % of small icebergs (such as those generated 379
by the acceleration of LIS tributary glaciers) reach north of 63◦S, suggesting a significant
380
melting of small icebergs in the coastal region to the east of the Antarctic Peninsula. Since 381
the accelerated LIS thinning and retreat rate is still one order of magnitude larger than Vf w
382
(∼ 2×10¹¹
m3
; Table 2), a melting of only 25% of the resulting small icebergs within the LIS 383
region would be sufficient to explain the observed AABW freshening. This scenario appears 384
plausible in light of the preceding argument, leading us to conclude that increased glacial 385
loss from the LIS is likely to be a significant player in the freshening. 386
5. Conclusion
387
A time series of AABW salinity in Drake Passage has been constructed using 18 repeats of 388
the SR1b hydrographic section between 1993 and 2010. A significant freshening of the bottom 389
water (0.004 decade−1) has been reported with no significant decrease in the thickness of the
390
AABW layer. We deduce that increased glacial loss from the Antarctic Peninsula following 391
the break up of the Larsen A and B ice shelves is likely to have contributed significantly to 392
the observed AABW freshening. The implication of reduced sea ice production or increased 393
precipitation off the LIS in the freshening cannot be ruled out with the available data, but 394
the sheer size of the glacial contribution suggests that it may be the dominant driver. 395
There is evidence that the AABW freshening in the Indo-Pacific sector of the Southern 396
Ocean is primarily forced by deglaciation in areas of West Antarctica, where an ocean-397
induced enhancement of basal melting has been observed in recent decades (Jacobs et al. 398
2002; Rintoul 2007; Jacobs and Giulivi 2010; Pritchard et al. 2012). In contrast, the changes 399
in glacial runoff in the western Weddell Sea that primarily underpin the freshening of the 400
region’s AABW outflow are argued here to result from atmospheric forcing. The collapse 401
of the Larsen A and B ice shelves and the subsequent acceleration in glacial runoff have 402
been linked to the summertime intensification of the circumpolar westerly winds over the 403
Southern Ocean in recent decades (Scambos et al. 2003; van den Broeke 2005), which has 404
been attributed in part to anthropogenic processes including ozone depletion (Thompson and 405
Solomon 2002). The intensification of the westerlies has been shown to lead to a weakening 406
of the blocking effect of the Antarctic Peninsula orography, with the associated promotion of 407
advection of relatively warm maritime air onto the eastern side of the Peninsula (Orr et al. 408
2004; Marshall et al. 2006) raising regional summer temperatures by 2◦C over the last four
409
decades (King et al. 2004). This summer warming has been highlighted as pivotal in the 410
enhanced surface melting of the LIS that heralded the collapse of large sectors of the ice shelf 411
around the turn of the century (Scambos et al. 2003; van den Broeke 2005). Consequently, 412
to the extent that the AABW freshening observed here can be attributed to the collapse 413
of parts of the LIS and acceleration of its tributary glaciers, the same freshening can also 414
be attributed to the strengthening atmospheric circulation over this part of the Southern 415
Ocean, with a previously argued anthropogenic cause. 416
A continuation of the AABW freshening tendency over the coming decades may be 417
expected on the basis of our present glaciological knowledge of the LIS region. For example, 418
the acceleration of glacial runoff in the Larsen B area observed over the last 15 years is 419
expected to persist into the years to come (Shuman et al. 2011). Further, the intact Larsen 420
C Ice Shelf contains a volume of freshwater that is greater than that in the collapsed Larsen 421
A and B sectors by an order of magnitude, and buttresses a much larger glacial catchment. 422
Larsen C is already thinning in response to variations in climatic forcing (Shepherd et al. 423
2003; Fricker and Padman 2012), and its snow-pack is showing signs of meltwater influence 424
(Holland et al. 2011). These changes seemingly herald a progression towards the point at 425
which further atmospheric melting may drive crevassing and ice-shelf failure, following which 426
a large volume of freshwater is expected to enter the continental shelf region off the LIS from 427
which the AABW outflow from the Weddell Sea is ventilated. 428
The freshening of Atlantic-sourced AABW reported here completes a circumpolar-wide 429
pattern of AABW freshening, albeit with different mechanisms being important in different 430
sectors. As much of the AABW exported through the Orkney Passage ultimately escapes 431
the Scotia Sea into the wider South Atlantic (Naveira Garabato et al. 2002a), our results 432
suggest that the AABW feeding the lower limb of the Atlantic Overturning Circulation is 433
freshening. Relating this freshening to the strength of the lower limb of the Atlantic MOC 434
is not straightforward: it is possible that horizontal density gradients may be modified, with 435
impacts on abyssal current speeds. However, the broad-scale finding of an AABW freshening 436
in Drake Passage with no attendant decrease in layer thickness argues that the formation rate 437
has not changed discernibly, and that it is formation properties that are being climatically 438
altered. We have argued that dense water production in the Weddell Sea is sensitive to the 439
impact of regional and large-scale decadal climatic change, and that the Weddell gyre does 440
not insulate the bottom water formation regions from such change. 441
Acknowledgments.
442
We thank the National Environmental Research Council for financial support of the 443
Antarctic Deep Rates of Export project (NE/E01366X/1). The SR1b section is a joint 444
effort between the National Oceanography Centre, Southampton (NOCS) and the British 445
Antarctic Survey (BAS) in Cambridge, U.K. Researchers and students from other institutions 446
have also made invaluable contributions to the cruises. The measurements could not have 447
been achieved without the willing cooperation and support of the planning and operations 448
groups at NOCS and BAS. We are grateful to two anonymous reviewers for useful comments, 449
which contributed to improving the quality of the paper. Finally, we gratefully acknowledge 450
the outstanding contribution of the Masters, officers and crew of RRS James Clark Ross and 451
RRS James Cook. 452
APPENDIX
453
454
CTD calibration, data accuracy and errors
455
To detect water mass changes in the deep ocean, it is necessary to quantitatively assess 456
the data quality, as the signals of change are small and can potentially be affected by mea-457
surement error and inter-cruise biases. Here we investigate CTD measurement errors and 458
the propagation of these errors through the procedure of gridding in density and dynamic 459
height coordinates. Salinity errors are particulary important here, because the reported sig-460
nal is a freshening, and because salinity is the dominant factor in density changes at low 461
temperature. 462
a. CTD measurement error
463
We conduct an error analysis similar to that of Naveira Garabato et al. (2009) and 464
Williams et al. (2006) who used the same data set to investigate the variability of other 465
water masses. Starting with the measurement error, we define the error on the CTD data 466
as the quadratic sum of 2 terms: 467 σctd= q σ2 sy+ σ 2 sb (A1) where σ2
syis the systematic error representing the accuracy of the measurement of a tracer
468
and σsb is the sampling error both in the vertical and the horizontal directions. Sampling
469
error is particularly important for bottle data because of their coarse vertical resolution. 470
CTD data have a much higher vertical resolution (1 or 2 dbar when averaged) but still suffer 471
from a limited horizontal resolution (the station spacing) and might be affected by small scale 472
structures. The sampling error is estimated by horizontally subsampling the 1997 section 473
(which had 50 stations instead of the usual 32) and regridding the subsampled section to 474
calculate the mean salinity and temperature of the AABW. The sampling error is found to 475
be 0.002 in salinity and 0.002◦C in temperature.
476
The systematic error represents the accuracy of the measurement of a tracer. A detailed 477
account of the data processing can be found in the individual cruise reports (http://www. 478
noc.soton.ac.uk/ooc/TRANSPORTS/DrakePassage.php). For each cruise, the CTD data 479
were carefully analyzed in order to identify and correct for potential issues with the data. 480
Concerning the pressure and temperature measurements, cruise reports show that the data 481
accuracy is σctdT = 1 db in pressure and σctdT = 1 × 10⁻³ ◦C in temperature.
482
CTD conductivity sensors, particularly in the early cruises, were subject to drift and 483
imprecisions in the measurements, requiring that the CTD data are calibrated against con-484
ductivity measured in water samples collected at different depths during station occupations. 485
Twelve water samples covering the whole water column were typically taken at each station. 486
Conductivity/salinity was measured for each water sample using a Guildline Autosal 8400B 487
salinometer. The salinometer was standardized using IAPSO Standard Seawater - SSW (Ta-488
ble 1 for details on the different batch used). The differences between the CTD salinity and 489
bottle data were calculated and, if necessary, offsets were applied to minimize the residuals 490
between the CTD and bottle conductivites (In 94/95, due to issue with the conductivity cell, 491
extra care was taken and the CTD-bottle differences were examined on a station by station 492
basis so that the mean difference between the bottle and CTD salinities is −1×10⁻⁴). Several
493
duplicates were taken during each cruise to monitor the performance of the salinometer and 494
the differences between duplicates were found to be of the order 1 × 10⁻⁴.Furthermore, the
495
quality of the CTD salinity increased with improvements in the CTD sensors and few/small 496
corrections were needed in the most recent cruises. 497
The accuracy and reliability of the SSW has been investigated by several independent 498
groups (Mantyla 1980, 1987, 1994; Kawano et al. 2006; Bacon et al. 2000, 2007). The 499
accuracy and consistency of the different batch of SSW is important as they are used to 500
calibrate the salinometer and thus help calibrate both the bottle and CTD salinity. Kawano 501
et al. (2006), found that the batch to batch differences improved significantly since the 502
1980s and the standard deviation of is 0.3 × 10⁻³. Their proposed correction for the SSW
503
batch used during the different SR1b cruises is of the order 1 × 10⁻³. Moreover, Bacon
504
et al. (2007) performed a detailed analysis of the uncertainties and stability of the SSW 505
manufacturing process. They demonstrated that there was no significant change in the label 506
conductivity ratio for SSW batches P130 to P144 outside the uncertainty of the conductivity 507
ratio. Gouretski and Jancke (2000) analyzed a large hydrographic data set and found that 508
difference in SSW batch did not seem to be the main cause of inter-cruise biases. The 509
systematic error resulting from the CTD calibration and SSW batch differences is therefore 510
small (2 × 10⁻³).
511
b. Error propagation
512
These errors on the CTD salinity data propagate through our salinity field gridded in 513
γn− Φ 1) by affecting the values of salinity used to calculate the mean and 2) by biasing
514
the coordinate system as both density and dynamic height are a function of salinity. Errors 515
in temperature and pressure measurement also impact on the calculation of density and 516
dynamic height. Isolating the relative contribution of the two on the mean salinity of the 517
AABW is difficult and instead we investigate their combined effect. To estimate the influence 518
of these errors, we introduce in each temperature, salinity and pressure field an error: 519
S = S + σctdS
T = T + σctdT
P = P + σctdP
where σctdS, σctdT and σctdP are normally-distributed random errors with mean equal to
520
zero and standard deviation equal to 2.8 × 10⁻³, 2.2 × 10⁻³◦C and 1 db respectively. The
same gridding procedure is then applied using the biased fields and the mean AABW salinity 522
and thickness are then calculated and compared with our time series. The mean regridding 523
errors calculated are σrgS = 6 × 10⁻⁴ (std = 6 × 10⁻⁴) and σrgT h = 30.7m (std 37.5 m) for
524
the mean AABW salinity and thickness respectively. 525
The final error to consider is the standard error of the mean salinity, σse, defined as:
526
σe =
s √
n (A2)
where s is the standard deviation of the salinity mean for a given cruise and n is the 527
number of samples (the number of grid points used to calculate the mean). The mean 528
standard error found here is σeS = 4 × 10⁻⁴ for salinity and σeT h = 32.4 m for the thickness.
529
The total error on salinity is σS =
q σ2 eS+ σ 2 rgS and on thickness is σT h = q σ2 eT h + σ 2 rgT h. 530
The errors are plotted as error bar on Figure 4. The error analysis reveals that the observed 531
salinity trend is larger than the potential errors coming from CTD measurement errors and 532
their subsequent propagation through the derived quantities presented in this study. 533
534
REFERENCES
535
Aoki, S., S. Rintoul, S. Ushio, S. Watanabe, and N. Bindoff, 2005: Freshening of the adelie 536
land bottom water near 140 degrees e. Geophys. Res Letters, 32 (23), L23 601, doi:10. 537
1029/2005GL024246. 538
Bacon, S., F. Culkin, N. Higgs, and P. Ridout, 2007: Iapso standard seawater: Definition 539
of the uncertainty in the calibration procedure, and stability of recent batches. J. Atm. 540
Oceanic Technol., 24, 1785–1799. 541
Bacon, S., H. Snaith, and M. Yelland, 2000: An evaluation of some recent batches of iapso 542
standard seawater. J. Atm. Oceanic Technol., 17, 854–861. 543
Behrendt, A., E. Fahrbach, M. Hoppema, G. Rohardt, O. Boebel, O. Klatt, A. Wisotzki, 544
and H. Witte, 2011: Variations of winter water properties and sea ice along the greenwich 545
meridian on decadal time scales. Deep-Sea Research II, 58 (25-26), 2524–2532, doi:10. 546
1016/j.dsr2.2011.07.001. 547
Berthier, E., T. A. Scambos, and C. A. Shuman, 2012: Mass loss of larsen b tributary glaciers 548
(antarctic peninsula) unabated since 2002. Geophysical Research Letters, 39 (13), L13 501, 549
doi:10.1029/2012GL051755. 550
Bromwich, D. H., J. P. Nicolas, and A. J. Monaghan, 2011: An assessment of precipita-551
tion changes over antarctica and the southern ocean since 1989 in contemporary global 552
reanalyses. J. Climate, 24 (16), 4189–4209, doi:10.1175/2011JCLI4074.1. 553
Carmack, E. and T. Foster, 1975: Flow of water out of the weddell sea. Deep-Sea Research, 554
22 (11), 711–724. 555
Cavalieri, D., C. Parkinson, P. Gloersen, and H. J. Zwally, 1996: Sea ice concentrations from 556
nimbus-7 smmr and dmsp ssm/i-ssmis passive microwave data. Tech. rep., National Snow 557
and Ice Data Center,Boulder, Colorado, USA. 558
Church, J. A., et al., 2011: Revisiting the earth’s sea-level and energy budgets from 1961 to 559
2008. Geophys. Res Letters, 38 (18), L18 601, doi:10.1029/2011GL048794. 560
Eicken, H., 1997: Salinity profiles of antarctic sea ice: Field data and model results. J. 561
Geophys. Res.-Oceans, 97 (C10), 15,545–15,557, doi:10.1029/92JC01588. 562
Fahrbach, E., M. Hoppema, G. Rohardt, O. Boebel, O. Klatt, and A. Wisotzki, 2011: 563
Warming of deep and abyssal water masses along the greenwich meridian on decadal time 564
scales the weddell gyre as a heat buffer. Deep-Sea Research II, 58 (25-26), 2509–2523, 565
doi:10.1016/j.dsr2.2011.06.007. 566
Fahrbach, E., G. Rohardt, N. Scheele, M. Schr¨oder, V. Strass, and A. Wisotzki, 1995: 567
Formation and discharge of deep and bottom water in the northwestern Weddell Sea. J. 568
Mar. Res., 53 (4), 515–538. 569
Foldvik, A., et al., 2004: Ice shelf water overflow and bottom water formation in the southern 570
weddell sea. J. Geophys. Res., 109, C02 015. 571
Foster, T. and E. Carmack, 1976: Frontal zone mixing and antarctic bottom water formation 572
in the southern weddell sea. Deep-Sea Research, 23 (4), 301–317. 573
Fricker, H. A. and L. Padman, 2012: Thirty years of elevation change on antarctic peninsula 574
ice shelves from multimission satellite radar altimetry. J. Geophys. Res.-Oceans, 117, 575
C02 026, doi:10.1029/2011JC007126. 576
Gill, A., 1973: Circulation and bottom water production in the weddell sea. Deep-Sea Re-577
search, 20 (2), 111–140. 578
Gordon, A. L., B. Huber, D. Mckee, and M. Visbeck, 2010: A seasonal cycle in the export 579
of bottom water from the weddell sea. Nature Geoscience, 3 (8), 551–556, doi:10.1038/ 580
ngeo916. 581
Gordon, A. L., M. Visbeck, and B. Huber, 2001: Export of Weddell Sea Deep and Bottom 582
Water. J. Geophys. Res.-Oceans, 106 (C5), 9005–9017. 583
Gouretski, V. and K. Jancke, 2000: Systematic errors as the cause for an apparent deep 584
water property variability: global analysis of the woce and historical hydrographic data. 585
Prog. Oceanogr., 48 (4), 337–402. 586
Hellmer, H. H., O. Huhn, D. Gomis, and R. Timmermann, 2011: On the freshening of 587
the northwestern weddell sea continental shelf. Oc. Sc., 7 (3), 305–316, doi:10.5194/ 588
os-7-305-2011. 589
Hellmer, H. H., F. Kauker, R. Timmermann, J. Determann, and J. Rae, 2012: Twenty-590
first-century warming of a large antarctic ice-shelf cavity by a redirected coastal current. 591
Nature, 485 (7397), 225–228, doi:10.1038/nature11064. 592
Holland, P. R., H. F. J. Corr, H. D. Pritchard, D. G. Vaughan, R. J. Arthern, A. Jenkins, 593
and M. Tedesco, 2011: The air content of larsen ice shelf. Geophys. Res Letters, 38 (10), 594
L10 503, doi:10.1029/2011GL047245. 595
Huhn, O., H. H. Hellmer, M. Rhein, C. Rodehacke, W. Roether, M. Schodlok, and 596
M. Schroder, 2008: Evidence of deep-and bottom-water formation in the western wed-597
dell sea. Deep-Sea Research II, 55 (8-9), 1098–1116. 598
Jackett, D. and T. McDougall, 1997: A neutral density variable for the world’s oceans. J. 599
Phys. Oceanogr., 27 (2), 237–263. 600
Jacobs, S., C. Giulivi, and P. Mele, 2002: Freshening of the ross sea during the late 20th 601
century. Science, 297 (5580), 386–389. 602
Jacobs, S. S., 2004: Bottom water production and its links with the thermohaline circulation. 603
Antarctic Science, 16 (4), 427–437, doi:10.1017/S095410200400224X. 604
Jacobs, S. S. and C. F. Giulivi, 2010: Large multidecadal salinity trends near the pacific– 605
antarctic continental margin. J. Climate, 23 (17), 4508–4524, doi:10.1175/2010JCLI3284. 606
1. 607
Jacobs, S. S., A. Jenkins, C. F. Giulivi, and P. Dutrieux, 2011: Stronger ocean circulation 608
and increased melting under pine island glacier ice shelf. Nature Geoscience, 4 (8), 519– 609
523, doi:10.1038/ngeo1188. 610
Jansen, D., M. Schodlok, and W. Rack, 2007: Basal melting of a-38b: a physical model 611
constrained by satellite observations. Remote Sensing of Environment, 111 (2), 195–203. 612
Johnson, G. C. and S. C. Doney, 2006: Recent western South Atlantic bottom water warm-613
ing. Geophys. Res Letters, 33, L14 614. 614
Johnson, G. C., S. G. Purkey, and J. L. Bullister, 2008a: Warming and freshening in the 615
abyssal southeastern Indian Ocean. J. Climate, 21 (20), 5351–5363. 616
Johnson, G. C., S. G. Purkey, and J. M. Toole, 2008b: Reduced Antarctic meridional over-617
turning circulation reaches the North Atlantic Ocean. Geophys. Res Letters, 35 (22), 618
L22 601. 619
Jullion, L., S. C. Jones, A. C. N. Garabato, and M. P. Meredith, 2010: Wind-controlled 620
export of antarctic bottom water from the weddell sea. Geophys. Res Letters, 37 (9), 621
L09 609, doi:10.1029/2010GL042822. 622
Kawano, T., M. Aoyama, T. Joyce, H. Uchida, Y. Takatsuki, and M. Fukasawa, 2006: The 623
latest batch-to-batch difference table of standard seawater and its application to the woce 624
onetime sections. J. Oceanography, 62, 777–792. 625
Killworth, P., 1974: Baroclinic model of motions on antarctic continental shelves. Deep-Sea 626
Research, 21 (10), 815–837. 627
King, J., J. Turner, G. Marshall, W. Connolley, and T. Lachlan-Cope, 2004: Antarctic penin-628
sula climate variability and its causes as revealed by analysis of instrumental records. 629
Antarctic Peninsula Climate Variability: A historical and Paleoenvironmental
Perspec-630
tive., E. Domack, A. Burnett, P. Convey, M. Kirby, and R. Bindschadler, Eds., American 631
Geophysical Union, Washington D.C. USA, Vol. 79, 17–30. 632
MacAyeal, D., T. Scambos, C. Hulbe, and M. Fahnestock, 2003: Catastrophic ice-shelf 633
break-up by an ice-shelf-fragment-capsize mechanism. J. Glaciology, 49 (164), 22–36. 634
Mantyla, A., 1980: Electric conductivity comparisons of standard seawater batches p29 to 635
p84. Deep-Sea Research I, 27, 837–846. 636
Mantyla, A., 1987: Standard seawater comparisons updated. J. Phys. Oceanogr., 17, 543– 637
548. 638
Mantyla, A., 1994: The treatment of inconsistencies in atlantic deep water salinity data. 639
Deep-Sea Research, 41, 1387–1405. 640
Marshall, G. J., A. Orr, N. P. M. van Lipzig, and J. King, 2006: The impact of a chang-641
ing southern hemisphere annular mode on antarctic peninsula summer temperatures. J. 642
Climate, 19 (20), 5388–5404. 643
Marshall, G. J., P. A. Stott, J. Turner, W. M. Connolley, J. C. King, and T. A. Lachlan-Cope, 644
2004: Causes of exceptional atmospheric circulation changes in the Southern Hemisphere. 645
Geophys. Res Letters, 31 (14), L14 205. 646
Maslanik, J., 1999: Near-real-time dmsp ssm/i-ssmis daily polar gridded sea ice concentra-647
tions. Tech. rep., National Snow and Ice Data Center,Boulder, Colorado, USA. 648
Meredith, M., R. Locarnini, K. V. Scoy, A. Watson, K. Heywood, and B. King, 2000: On the 649
sources of Weddell Gyre Antarctic Bottom Water. J. Geophys. Res.-Oceans, 105 (C1), 650
1093–1104. 651
Meredith, M. P., A. L. Gordon, A. C. N. Garabato, E. P. Abrahamsen, B. A. Huber, L. Jul-652
lion, and H. J. Venables, 2011: Synchronous intensification and warming of antarctic 653
bottom water outflow from the weddell gyre. Geophys. Res Letters, 38 (3), L03 603, doi: 654
10.1029/2010GL046265. 655
Meredith, M. P., A. C. Naveira Garabato, A. L. Gordon, and G. C. Johnson, 2008: Evolution 656
of the Deep and Bottom Waters of the Scotia Sea, Southern Ocean, during 1995–2005. J. 657
Climate, 21 (13), 3327–3343. 658
Munneke, P. K., G. Picard, M. R. V. D. Broeke, J. T. M. Lenaerts, and E. V. Meijgaard, 659
2012: Insignificant change in antarctic snowmelt volume since 1979. Geophys. Res Letters, 660
39 (1), L01 501, doi:10.1029/2011GL050207. 661
Naveira Garabato, A. C., K. J. Heywood, and D. P. Stevens, 2002a: Modification and 662
pathways of Southern Ocean deep waters in the Scotia Sea. Deep-Sea Research I, 49 (4), 663
681–705. 664
Naveira Garabato, A. C., L. Jullion, D. P. Stevens, K. J. Heywood, and B. A. King, 2009: 665
Variability of Subantarctic Mode Water and Antarctic Intermediate Water in the Drake 666
Passage during the Late-Twentieth and Early-Twenty-First Century. J. Climate, 22, 3661– 667
3688, doi:10.1175/2009JCLI2621.1. 668
Naveira Garabato, A. C., E. McDonagh, D. P. Stevens, K. J. Heywood, and R. J. Sanders, 669
2002b: On the export of Antarctic Bottom Water from the Weddell Sea. Deep-Sea Research 670
II, 49, 4715–4742.
671
Naveira Garabato, A. C., K. L. Polzin, B. King, K. J. Heywood, and M. Visbeck, 2004: 672
Widespread intense turbulent mixing in the Southern Ocean. Science, 303, 210–213. 673
Nicholls, K. W., S. Østerhus, K. Makinson, T. Gammelsrød, and E. Fahrbach, 2009: Ice-674
ocean processes over the continental shelf of the southern Weddell Sea, Antarctica: A 675
review. Rev. Geophys., 47 (3), 2007RG000 250. 676
Nowlin Jr, W. and W. Zenk, 1988: Westward bottom currents along the margin of the south 677
shetland island arc. Deep-Sea Research I, 35 (2), 269–301. 678
Orr, A., D. Cresswell, G. J. Marshall, J. Hunt, J. Sommeria, C. Wang, and M. Light, 2004: 679
A ’low-level’explanation for the recent large warming trend over the western antarctic 680
peninsula involving blocked winds and changes in zonal circulation. Geophys. Res Letters, 681
31 (6), L06 204,, doi:10.1029/2003GL019160. 682
Orsi, A., T. Whitworth, and W. D. Nowlin, 1995: On the meridional extent and fronts of 683
the Antarctic Circumpolar Current. Deep-Sea Research I, 42 (5), 641–673. 684
Orsi, A. H., G. C. Johnson, and J. L. Bullister, 1999: Circulation, mixing, and production 685
of Antarctic Bottom Water. Prog. Oceanogr., 43 (1), 55–109. 686
Pritchard, H. D., S. R. M. Ligtenberg, H. A. Fricker, D. G. Vaughan, M. R. van den Broeke, 687
and L. Padman, 2012: Antarctic ice-sheet loss driven by basal melting of ice shelves. 688
Nature, 484 (7395), 502–505, doi:10.1038/nature10968. 689
Provost, C., A. Renault, N. Barr´e, N. Senn´echael, V. Gar¸con, J. Sudre, and O. Huhn, 2011: 690
Two repeat crossings of Drake Passage in austral summer 2006 Short-term variations and 691
evidence for considerable ventilation of intermediate and deep waters. Deep-Sea Research 692
II, 58 (25-26), 2555–2571.
693
Purkey, S. G. and G. C. Johnson, 2010: Warming of global abyssal and deep southern 694
ocean waters between the 1990s and 2000s: Contributions to global heat and sea level rise 695
budgets. Journal of Climate, 23 (23), 6336–6351, doi:10.1175/2010JCLI3682.1. 696
Purkey, S. G. and G. C. Johnson, 2012: Global contraction of antarctic bottom water between 697
the 1980s and 2000s. J. Climate, 25 (17), 5830–5844, doi:10.1175/JCLI-D-11-00612.1. 698
Rack, W. and H. Rott, 2004: Pattern of retreat and disintegration of the larsen b ice shelf, 699
antarctic peninsula. Annals of Glaciology, 39 (1), 505–510. 700
Rignot, E., 2006: Changes in ice dynamics and mass balance of the antarctic ice sheet. Philos 701
T R Soc A, 364, 1637–1655, doi:doi:10.1098/rsta.2006.1793. 702
Rignot, E., G. Casassa, P. Gogineni, W. Krabill, A. Rivera, and R. Thomas, 2004: Acceler-703
ated ice discharge from the antarctic peninsula following the collapse of larsen b ice shelf. 704
Geophys. Res Letters, 31 (18), L18 401, doi:10.1029/2004GL020697. 705
Rintoul, S. R., 2007: Rapid freshening of antarctic bottom water formed in the indian and 706
pacific oceans. Geophys. Res Letters, 34 (6), L06 606, doi:10.1029/2006GL028550. 707
Roemmich, D., G. Johnson, S. Riser, R. Davis, J. Gilson, W. Owens, C. Schmid, and M. Ig-708
naszewski, 2009: The argo program: Observing the global oceans with profiling floats. 709
Oceanography, 22, 24–33. 710
Rott, H., F. M¨uller, T. Nagler, and D. Floricioiu, 2011: The imbalance of glaciers after
711
disintegration of larsen-b ice shelf, antarctic peninsula. The Cryosphere, 5 (1), 125–134, 712
doi:10.5194/tc-5-125-2011. 713
Rott, H., P. Skvarca, and T. Nagler., 1996: Rapid collapse of northern larsen ice shelf, 714
antarctica. Science, 271 (5250), 788–792, doi:10.1126/science.271.5250.788. 715
Scambos, T. A., C. Hulbe, and M. Fahnestock, 2003: Climate-induced ice shelf disintegration 716
in the antarctic peninsula. Antarctic Research Series, 79, 79–92. 717
Schodlok, M. P., H. H. Hellmer, G. Rohardt, and E. Fahrbach, 2006: Weddell sea iceberg 718
drift: Five years of observations. J. Geophys. Res., 111 (C6), C06 018, doi:10.1029/ 719
2004JC002661. 720
Shepherd, A., D. Wingham, T. Payne, and P. Skvarca, 2003: Larsen ice shelf has progres-721
sively thinned. Science, 302 (5646), 856–859. 722
Shepherd, A., D. Wingham, and E. Rignot, 2004: Warm ocean is eroding west antarctic ice 723
sheet. Geophys. Res Letters, 31 (23), L23 402, doi:10.1029/2004GL021106. 724
Shepherd, A., D. Wingham, D. Wallis, K. Giles, S. Laxon, and A. V. Sundal, 2010: Recent 725
loss of floating ice and the consequent sea level contribution. Geophys. Res Letters, 37 (13), 726
L13 503, doi:10.1029/2010GL042496. 727
Shuman, C., E. Berthier, and T. Scambos, 2011: 2001–2009 elevation and mass losses in the 728
larsen a and b embayments, antarctic peninsula. Journal of Glaciology. 729
Silva, T. A. M., G. R. Bigg, and K. W. Nicholls, 2006: Contribution of giant icebergs to 730
the southern ocean freshwater flux. J. Geophys. Res., 111 (C3), C03 004, doi:10.1029/ 731
2004JC002843. 732
Stammerjohn, S. E., D. G. Martinson, R. C. Smith, X. Yuan, and D. Rind, 2008: Trends 733
in antarctic annual sea ice retreat and advance and their relation to el ni˜no–southern
734
oscillation and southern annular mode variability. J. Geophys. Res., 113 (C3), C03S90, 735
doi:10.1029/2007JC004269. 736
Sutherland, W., et al., 2012: A horizon scan of global conservation issues for 2012. Trends 737
in Ecol. and Ev., doi:10.1016/j.tree2011.10.011. 738
Tamura, T., K. I. Ohshima, and S. Nihashi, 2008: Mapping of sea ice production for 739
antarctic coastal polynyas. Geophysical Research Letters, 35 (7), L07 606, doi:10.1029/ 740
2007GL032903. 741
Thoma, M., A. Jenkins, D. Holland, and S. Jacobs, 2008: Location and timing of Cir-742
cumpolar Deep Water intrusions onto the Amundsen Sea continental shelf simulated 743
with an isopycnic coordinate ocean model. Geophys. Res Letters, 35, L18 602, doi: 744
10.1029/2008GL034939. 745
Thompson, D. W. J. and S. Solomon, 2002: Interpretation of recent southern hemisphere 746
climate change. Science, 296 (5569), 895–9, doi:10.1126/science.1069270. 747
van den Broeke, M., 2005: Strong surface melting preceded collapse of antarctic peninsula 748
ice shelf. Geophys. Res Letters, 32 (12), L12 815, doi:10.1029/2005GL023247. 749
Wilchinsky, A. V. and D. L. Feltham, 2009: Numerical simulation of the filchner overflow. 750
J. Geophys. Res., 114 (C12), C12 012, doi:10.1029/2008JC005013. 751
Williams, A., S. Bacon, and S. Cunningham, 2006: Variability of the lower circumpolar deep 752
water in drake passage 19262004. Geophys. Res Letters, 33 (3), L03 603, doi:10.1029/ 753
2005GL024226. 754
Zwally, H. J., D. Yi, R. Kwok, and Y. Zhao, 2008: Icesat measurements of sea ice freeboard 755
and estimates of sea ice thickness in the weddell sea. J. Geophys. Res., 113 (C2), C02S15, 756
doi:10.1029/2007JC004284. 757
List of Tables
759
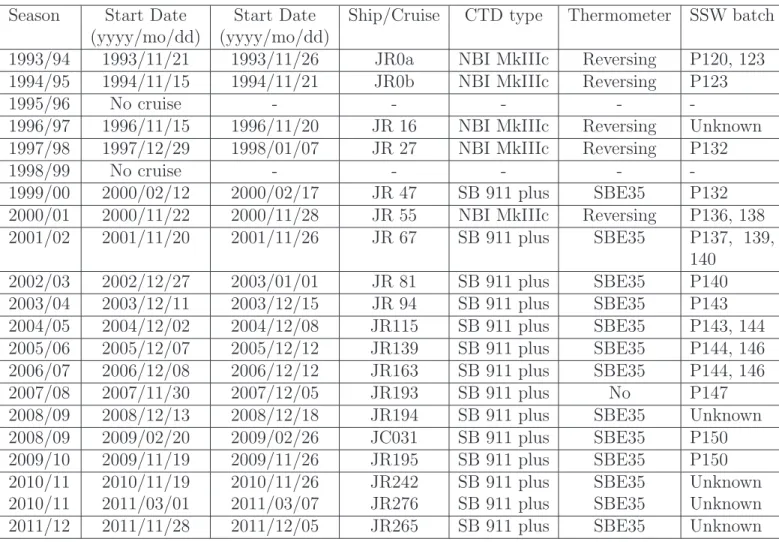
1 Drake Passage (SR1b) section details. Cruise numbers starting with JR were
760
made on board RRS James Clark Ross and those starting with JC were made 761
on board RRS James Cook. The batch number of the Standard Sea Water 762
used for salinity calibration are given when available. SB: SeaBird, NBI: Neil 763
Brown Instrument 35
764
2 Total ice loss by the LIS (top rows) and tributary glaciers (lower rows) based
765
on published data (assuming density of ice is 900 kg m−3). Ice shelf volume
766
losses are estimated from the total volume losses for each ice shelf (Shepherd 767
et al. 2010) distributed in time according to the ice-area losses (Scambos et al. 768
2003). 36