HAL Id: inserm-00846030
https://www.hal.inserm.fr/inserm-00846030
Submitted on 18 Jul 2013
HAL is a multi-disciplinary open access archive for the deposit and dissemination of sci-entific research documents, whether they are pub-lished or not. The documents may come from teaching and research institutions in France or abroad, or from public or private research centers.
L’archive ouverte pluridisciplinaire HAL, est destinée au dépôt et à la diffusion de documents scientifiques de niveau recherche, publiés ou non, émanant des établissements d’enseignement et de recherche français ou étrangers, des laboratoires publics ou privés.
middle-aged women reporting urinary incontinence:
Analysis of a 2273-woman cohort.
Xavier Fritel, Henri Panjo, Noëlle Varnoux, Virginie Ringa
To cite this version:
Xavier Fritel, Henri Panjo, Noëlle Varnoux, Virginie Ringa. The individual determinants of care-seeking among middle-aged women reporting urinary incontinence: Analysis of a 2273-woman cohort.: The determinants of care-seeking among women reporting urinary incontinence. Neurourology and Urodynamics, Wiley, 2014, 33 (7), pp.1116-22. �10.1002/nau.22461�. �inserm-00846030�
Abstract 1
Aims: Our main objective was to analyze individual determinants that lead middle-2
aged women to seek medical care for UI. 3
Methods: Observational longitudinal study among GAZEL cohort participants: 2640 4
women aged 50-62 completed a self-administered questionnaire at baseline. Eight 5
years later (2008) 2273 (86%) responded to a follow-up questionnaire. Seeking care 6
for UI was defined as any consultation for UI during the 8-year follow-up period. 7
Individual determinants considered in the regression analysis were social and 8
demographic characteristics, social relations, UI type and severity, and other health 9
factors. 10
Results: Among 1192 women reporting incontinence at baseline, 24.4% had visited a 11
physician at least once for UI during the follow-up period (56.0% of those reporting 12
severe UI). The care-seeking rate increased with age at baseline. Multivariate 13
analysis showed that women who reported severe UI (OR= 4.1; 95%CI 2.6-6.5), 14
mixed UI(2.0; 1.3-3.0), or neurologic disease (1.6; 1.1-2.6), had weak social support 15
(1.4; 1.0-2.0), or talked about their UI with close friends or family (1.5; 1.0-2.1) were 16
more likely to seek care for UI. A model including these factors had a 78% probability 17
of correctly differentiating women with incontinence who chose to seek care from 18
those who did not. Our analysis could not take factors related to the organization of 19
health services into account. 20
Conclusions: Women do not always seek care for UI, even when it is severe. Besides 21
UI severity and type, consultation is associated with aging, weak social support, 22
conversation about it with close friends and family, and neurologic disorders. 23
24
Keywords: female urinary incontinence, care-seeking, longitudinal study 25
Introduction
27
Urinary incontinence (UI) is a common symptom in women, one that can cause 28
disability and healthcare expenditures. In a European study of 17 080 women, 35% 29
reported UI; among the latter, only 31% had ever consulted a physician about UI, 5% 30
had used medication for it, and 5% had undergone surgery for it [1]. In the United 31
States the percentage of hospital admissions with a primary diagnosis of UI was 32
44/100 000 in 2000, and the number of outpatient visits 1 845/100 000 [2]. The direct 33
cost of UI in the US was estimated at $12.4 billion in 1995 [3]. In France and 34
elsewhere, health authorities are actively taking steps to improve care for UI. 35
The demand for care appears to be associated with UI severity [4], and is likely to be 36
proportional to both the severity of symptoms and their impact on quality of life (QoL). 37
It is also likely that social factors, such as social relations, can influence the demand 38
for care. Women may obtain advice from their close friends and family and thus 39
consult their physician less often. But women with strong social relations may also be 40
more likely to receive advice from their relatives to seek care. Middle-aged women 41
often rely on advice from friends and family for their menopause symptoms [5].A 42
better understanding of the determinants of care-seeking could help adapt health 43
policy in the domain of UI and improve its management. 44
Our main objective in this longitudinal study in the GAZEL cohort was to analyze the 45
individual determinants (severity of disorder, social relations and social and 46
demographic characteristics) associated with seeking care for UI among middle-aged 47
women. Our secondary objective was to analyze the characteristics associated with 48
satisfaction after a medical consultation for UI and after treatment. 49
Population and Methods
51
Our sample consisted of middle-aged women participating in the GAZEL cohort, 52
made up of employees of the French public power company who had volunteered in 53
1989 to respond to various self-administered health questionnaires, then and in the 54
years to come (www.gazel.inserm.fr) [6]. They were 50-70 years of age during the 55
period of this study — from 2000 to 2008. In 2000 (baseline), they were questioned in 56
detail about lower urinary tract symptoms [4,7,8]. Additional data were collected in 57
2008 (follow-up) in a questionnaire focusing on lower urinary tract symptoms, 58
doctors' visits, and health care since 2000. Of the 2640 women who had responded 59
in 2000, 2273 (86%) responded again in 2008; they constitute our sample for this 60
analysis. 61
Seeking UI care was defined as any office visit for UI during the follow-up period. The 62
question asked of each participant was ―Since the year 2000, have you consulted a 63
doctor about involuntary urine leakage?‖ Those who answered yes to the question 64
were asked if the medical visit met their expectations (―not at all‖, ―a little‖, 65
―somewhat‖, ―very‖, or ―completely‖). Dissatisfaction was defined by an answer of ―not 66
at all‖ or ―a little‖. Women with doctors' visits for UI were questioned about the 67
treatment provided and whether if its results met their expectations (―poorer than‖, 68
―the same as‖, or ―better than" expected). 69
Independent variables considered were social and demographic characteristics (age, 70
educational level, occupation, household income, size of the city of residence, parity, 71
number of people living in the home, and marital status), and lifestyle data (smoking, 72
alcohol consumption, and physical exercise). Data about social network (an index 73
based on marital status, contacts with children not living at home, parents, parents-74
in-law, other family members, and friends, and participation in voluntary groups or 75
associations), social support (a scale based on 2 items about emotional support and 76
2 items about instrumental support), and social satisfaction (a scale based on the 77
quality of relationships with individuals the participant feels close to) came from the 78
New Haven EPESE scale [9]. UI was defined as any involuntary urinary leakage 79
reported during the previous 12 months. The Sandvik UI severity score was 80
computed from UI frequency and amount of leakage [10]. UI type, urgency, and 81
frequency were determined with the BFLUTS questionnaire; women were considered 82
to suffer from stress UI, urge UI, or mixed UI if they answered ―sometimes‖, ―most of 83
the time‖, or ―all of the time‖ to the questions: ―Does urine leak when you are 84
physically active, exert yourself, cough or sneeze?‖ or ―Does urine leak before you 85
can get to the toilet?‖ [11]. Additional data about discussing UI with close friends or 86
family, partners or colleagues, were also collected. Health variables considered were 87
body mass index, menopausal status, climacteric symptoms, diabetes, 88
endocrinopathy, hypertension, cardiovascular disease, neurologic disease, chronic 89
bronchitis or cough, lumbar (or sciatic) pain, use of diuretics, antidepressants, 90
sleeping pills or other medications, consultations with their general practitioner, and 91
generic health-related QoL (Nottingham Health Profile). 92
First we compared the characteristics of responders and non-responders. The 93
independent variables considered in the analysis of care-seeking were structured in 94
three dimensions: 1) social and demographic characteristics and lifestyle, 2) UI 95
severity and type, and discussion of UI with others, and 3) other health variables 96
(listed in the preceding paragraph). Bivariate and multivariate analyses for each 97
dimension produced separate multivariate models, one focused on social and 98
demographic variables (Model 1), another on UI (Model 2), and a third on health 99
factors (Model 3). Variables were introduced into each model if they were associated 100
with seeking care for UI in the bivariate analysis with p< 0.20. A fourth and global 101
multivariate model included the variables associated (p<0.15) with care-seeking in 102
one of the three preceding models. Forward stepwise regression analyses were 103
conducted for each multivariate model to exclude variables with p>0.15. 104
Analyses of dissatisfaction with the consultation for UI, on the one hand, and with the 105
results of the treatment, on the other, were conducted with the same independent 106
variables. Bivariate analyses were performed to select variables associated with 107
dissatisfaction (p<0.20), which were then introduced into the multivariate models. 108
All multivariate analyses were adjusted for age. To assess the fit of our logistic 109
models and measure their predictive power, we performed a receiver operating 110
characteristic (ROC) analysis. We estimated the area under the ROC curve, that is, 111
the c-statistic (or concordance index). Its value varies from 0.5 (predictive power no 112
better than chance) to 1.0 (perfect predictive power) [12]. We also assessed 113
separately the predictive power of each variable included in the final model for care 114
seeking with the same concordance index. All analyses were performed with SAS 115
software (SAS Institute Inc., Cary, NC, USA). 116
The GAZEL cohort scientific committee and the CNIL (French Data Protection 117
Authority) approved this study. This work was funded by the IRESP (Institute for 118
Public Health Research), which had no role in the conduct of the study or the 119
analysis of the data. 120
122
Results
123
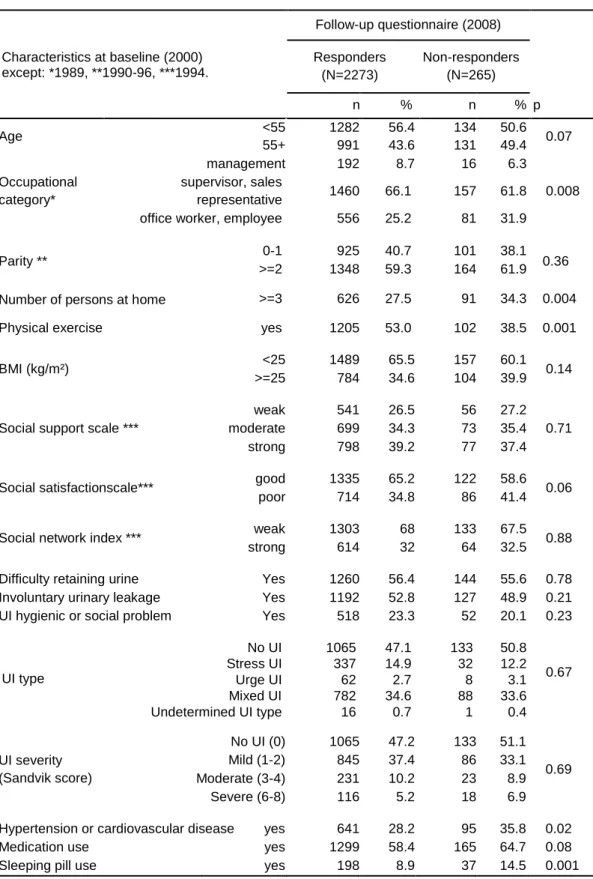
The 2273 women responding at follow-up had a higher occupational status, reported 124
fewer people living in their home, were more likely to exercise, and less likely to 125
report hypertension, cardiovascular disease, or use of sleeping pills than the 265 126
non-respondents (Table I). 127
At follow-up, the respondents' mean age was 63 (sd +3.36; range 58-70; no 128
difference with non-respondents, data not shown). At baseline, 52.4% (1192) had 129
reported some UI. Among these 1192 incontinent women, 291 (24.4%) had visited a 130
physician for UI at least once during the follow-up period. This rate increased with the 131
frequency of leakage at baseline: 18.1% (166/916) if less than once a week, 40.0% 132
(56/140) if weekly, and 50.7% (69/136) if daily. It also increased according to age at 133
baseline, 20.6% (58/282) at 49-51 years, 23.9% (91/380) at 52-54, 25.9% (69/266) at 134
55-57, and 27.7% (73/264) at 58-62. Among the 1065 women continent at baseline, 135
the incidence of UI in 2008 was 50.0% (532), and the rate of seeking care for UI 136
during the follow-up period was 5.3% (57). 137
Seeking care for UI was associated with high parity and weak social support (Table 138
II, Model 1), with severe UI, mixed UI, and discussing UI with close friends or family 139
(Table II, Model 2), and with poor QoL, a GP visit during the past 12 months, and 140
neurologic disease (Table II, Model 3). In the final model, care-seeking was 141
associated with severe UI, mixed UI, neurologic disease, discussion about UI with 142
friends or close relatives, and weak social support (Table II). The concordance index 143
of our final model was high (0.78). The c-statistic calculated for each variable 144
included in the final model showed that the four variables that contributed most to 145
predicting care-seeking were UI severity (c=0.74), UI type (c=0.72), discussing UI 146
with friends or close relatives (c=0.71), or with colleagues (c=0.70). The concordance 147
index for the other variables (age, social support, quality of life, consultation with GP, 148
and neurologic disease) was poor (between 0.52 and 0.58). 149
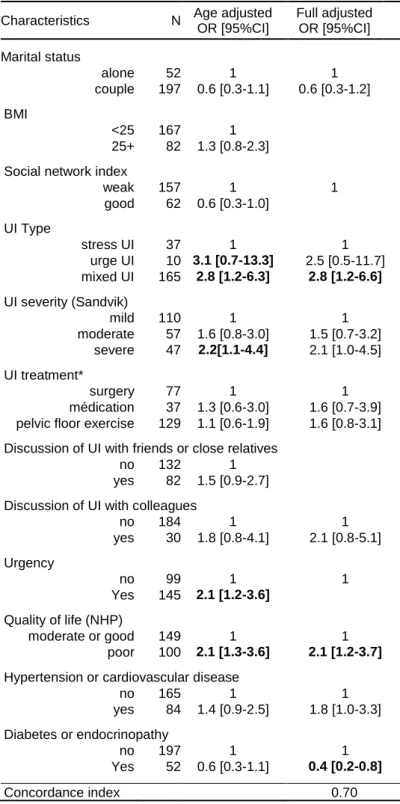
Of the 348 women (15.3%) who visited a physician for UI during the follow-up period, 150
21.6% (75) were not satisfied with the consultation (Table III). Dissatisfaction was not 151
significantly associated with age (19.6% before 55 versus 25% after). The risk of 152
dissatisfaction was associated with weak social support, urgency, and urge UI (Table 153
IV). Women who reported chronic bronchitis or coughing were less likely to report 154
dissatisfaction (Table IV). 155
During the 8-year follow-up period, 11.9% (270/2273) of the women were treated for 156
UI; treatment outcome was consistent with or exceeded expectations for 52.6% 157
(142/270) (Table III). Satisfaction was not significantly associated with age (47.6% 158
before 55 versus 58.4% after). Women reporting diabetes were more likely to be 159
satisfied with their treatment, and women with mixed UI or those with a poor QoL 160
were more likely to be dissatisfied (Table V). 161
Discussion 163
In our sample of 2273 women aged 58-70 years reporting on events over an 8-year 164
period, 348 (15.3%) visited a physician, and 270 (11.9%) underwent treatment for UI 165
during the follow-up period. UI severity at baseline was the main reason for seeking 166
healthcare for it. The percentage of women visiting a physician because of UI 167
increased independently with both age and UI severity; other factors associated with 168
consultation for UI were UI type (mixed), weak social support, discussing UI with 169
close friends or family, and neurologic diseases. Rates of dissatisfaction with the visit 170
and the treatment were 21.6% and 39.6% respectively. 171
It is unsurprising, even obvious, that the more severe the UI, the greater the demand 172
for care. Nonetheless, confirming this clinical intuition requires following a sample of 173
women likely to have UI, characterizing their urinary symptoms, and collecting 174
information over a sufficient period of time. Strengths of our study include its 175
longitudinal nature and our consideration of numerous factors collected in the GAZEL 176
cohort, including occupational, social, demographic and medical characteristics, all of 177
which may influence care-seeking. A cross-sectional study cannot provide a rigorous 178
analysis of the association between current urinary symptoms and past care because 179
the symptoms might have been improved or induced by the treatment, similarly, it 180
cannot indicate whether current wishes for care will be followed up by actual care-181
seeking. 182
Of 331 women from the Boston area who reported UI on a weekly basis, 45% had 183
sought care at least once [13]. Among those who sought care, 60% received it. In 184
47% of the cases, treatment was pelvic floor muscle exercise. This cross-sectional 185
study found that neither socioeconomic level nor type of health insurance was 186
associated with seeking care or treatment. Despite numerous differences, related in 187
particular to health insurance, survey method, and population, the rates of 188
consultation and treatment in this Boston study are close to those observed in ours. 189
This finding suggests that private health insurance is not a major obstacle to 190
treatment for UI. In another cross-sectional survey, 26% of 6625 incontinent women 191
had seen a physician for their UI [14]. Care-seeking increased with their age, UI 192
severity, UI duration, and urge or mixed UI compared with stress UI. These results 193
are consistent with ours; we showed a higher consultation rate for mixed UI (29.6%), 194
a slightly lower one for urge UI (22.6%), and a rate of 12.9% for stress UI. This higher 195
rate of consultation in case of mixed or urge UI is also found in other surveys [15,16]. 196
Urge UI has a greater impact on QoL than stress UI [15]. The multiplicity of 197
circumstances of leakage, their unpredictable character, urgency and abundance 198
may explain this stronger demand for care in women with mixed UI. Our analysis also 199
shows that, at equal levels of severity, those who report urge UI are much more 200
dissatisfied with their medical consultation than the women with stress UI. 201
The women were, for the most part (75%), satisfied with their consultation, but only 202
half (53%) found that the treatment outcome met or exceeded their expectations. 203
Surveys in the general population usually show poor results compared to clinical 204
trials performed by medical experts on selected patients. In the population-based 205
study by Black et al. of women who had surgery for SUI, 28% were cured and 66% 206
reported that the outcome met or exceeded their expectations [17]. 207
In our study, more than 40% of the women with severe UI had not discussed it with a 208
physician. The EPINCONT cross-sectional survey found similar results, with no 209
consultation for 46% of the women who reported severe UI [14]. This lack of 210
consultation may be explained by women's belief that UI is a normal consequence of 211
aging or of motherhood, or the embarrassing nature of the situation, reluctance to be 212
treated over a long term, or lack of knowledge about the treatments [18,19]. Other 213
elements may be related to the woman's personality or her social relations. Women 214
who talk about their UI to others are more likely to see a physician for it [16,18]. We 215
found that those who talked about their UI to their family or friends are those who 216
sought care, probably because they were less ashamed or embarrassed about 217
talking about it, whether to friends or a physician. 218
Weak, versus strong social support was significantly associated with a higher rate of 219
care-seeking (20.6% vs 12.4%). We hypothesize that women with UI symptoms who 220
have strong social support are likely to receive help and advice without needing to 221
ask their physician, while those with low social support consult their physicians, 222
perhaps precisely because they have no one else to rely on. Social support was 223
defined by 4 questions exploring instrumental and emotional support, but only the 224
questions concerning instrumental support were significantly associated with care-225
seeking for UI (data not shown). 226
The rate of consultation for UI was slightly higher among women with poor health-227
related QoL (20.2%) than among those with a good QoL score (10.7%). Poor health-228
related QoL probably results in more medical consultations and therefore increases 229
the opportunities to seek care for urinary disorders. Two studies found that women 230
were more likely to request care for UI when they were consulting a physician for 231
another reason than to make a special appointment for it [14,16], and women who 232
consulted their physician for UI have more comorbidities and saw physicians more 233
frequently [18]. It may be that a medical consultation is the occasion for screening for 234
symptoms or diseases not directly related to the initial reason for the consultation. 235
The case of neurologic diseases is particular because in some situations these can 236
affect continence. Unfortunately we do not have details about these neurologic 237
diseases to develop further hypotheses. 238
In France, women may see a gynecologist without having to be referred by their GP; 239
this is not the case for other specialists. This may explain why 53.5% consulted a 240
gynecologist for UI and only 23.6% a urologist. Moreover there were substantially 241
more gynecologists practicing in France than urologists [20]. 242
O‘Donnell et al found higher consultation rates for women with UI in France (33%) 243
and Germany (40%) than in Spain (24%) or the UK (25%) [16]. These differences 244
may be related to differences in the healthcare system (number of and access to 245
specialists, university training, and information provided to women). Because our 246
study was limited to France, we were unable to test any of these hypotheses. Other 247
potential differences may be demographic, such as parity, or cultural, such as social 248
support; both were significantly associated with seeking care for UI in our analysis. 249
Another limitation of our work is linked to characteristics of the GAZEL cohort, which 250
is made up of present or past employees. Because they were all covered by public 251
health insurance, we were not able to consider the possible effect of that factor. It is 252
interesting to note that many incontinent women do not consult even though they are 253
covered by health insurance. We do not know whether the medical consultations 254
involved the woman's specific request or if the subject was broached on the occasion 255
of a consultation for another reason. We were not able to consider the duration of 256
symptoms, which is likely to play a role in the decision to see a physician. The 257
reluctance to talk about incontinence that some women or some physicians may feel 258
was not addressed in our study. We can not rule out the possibility of a recall bias 259
relative to medical visits or treatment. Unfortunately healthcare records were not 260
available to confirm the information. 261
Conclusions
262
Our results confirmed that even in a country where the healthcare system ensures 263
reimbursement for medical expenses, including doctors' visits, numerous women do 264
not see physicians although they have severe UI. The determinants of healthcare 265
utilization are not only clinical; social relations also play a role. Progress is needed to 266
give the many women who do not consult doctors despite severe UI a chance to talk 267
to a physician about their condition and receive appropriate management that meets 268
their expectations. 269
Acknowledgment 271
We thank Jo Ann Cahn for editing assistance. We thank all the women who 272
participated in our study. We thank the French national gas and electricity company 273
Electricite de France–Gaz de France (EDF-GDF), especially the Service-Général-de-274
Médecine-de-Contrôle and the Caisse-centrale-d‘action-sociale-du-personnel-des-275
industries-électriques-et-gazières. We also acknowledge the ‗‗cohortes‘‘ team of the 276
Unit INSERM 1018 Versailles-St-Quentin University responsible for GAZEL database 277
management. 278
Funding 279
Our longitudinal study inside the GAZEL cohort was funded by the IRESP (Institute 280
for Public Health Research). The funding organization was not involved in collection, 281
analysis or interpretation of data. 282
References 284
1 Hunskaar S, Lose G, Sykes D, Voss S. The prevalence of urinary incontinence in women in four European countries. BJU Int 2004;93:324-30.
2 Thom DH, Nygaard IE, Calhoun E. Urologic diseases in America project: urinary incontinence in women – national trends in hospitalizations, office visits, treatment and economic impact. J Urol 2005;173:1295-1301.
3 Wilson L, Brown JS, Shin GP, KO Luc, LL Subak. Annual direct cost of urinary incontinence. Obstet Gynecol 2001;98:398–406.
4 Saadoun K, Ringa V, Fritel X, Varnoux N, Zins M, Bréart G. Negative impact of urinary incontinence on quality of life, a cross-sectional study among women aged 49-61 years enrolled in the GAZEL cohort. Neurourol Urodyn 2006;25:696-702.
5 Duffy O, Iversen L, Hannaford P. The impact and management of symptoms
experienced at midlife: a community-based study of women in northeast Scotland. BJOG 2012;119:554-64.
6 Ringa V, Fritel X, Varnoux N, Zins M, Quelen C, Bouyer J. Discontinuation of hormone therapy in the French GAZEL cohort 1990-2006. Fertil Steril 2010;94:1387-91.
7 Fritel X, Ringa V, Varnoux N, Fauconnier A, Piault S, Bréart G. Mode of delivery and severe stress incontinence. A cross-sectional study among 2625
perimenopausal women. BJOG 2005;112:1646–51.
8 Fritel X, Ringa V, Varnoux N, Zins M, Bréart G. Mode of Delivery and Fecal Incontinence at Midlife: A Study of 2,640 Women in the GAZEL Cohort. Obstet Gynecol 2007;110:31-8.
9 Melchior M, Berkman LF, Niedhammer I, Chea M, Goldberg M. Social relations and self-reported health: a prospective analysis of the French Gazel cohort. Soc Sci Med 2003;56:1817-30.
10 Sandvik H, Seim A, Vanvik A, Hunskaar S. A severity index for epidemiological surveys of female urinary incontinence: comparison with 48-hour pad-weighing tests. Neurourol Urodyn 2000;19:137-45.
11 Jackson S, Donovan J, Brookes S, Eckford S, Swithinbank L, Abrams P. The Bristol Female Lower Urinary Tract Symptoms questionnaire: development and psychometric testing. Br J Urol 1996;77:805–12.
12 Hosmer DW, Lemeshow S. Applied Logistic regression, 2nd Edition. Wiley 2000. 13 Harris SS, Link CL, Tennstedt SL, Kusek JW, McKinlay JB. Care seeking and treatment for urinary incontinence in a diverse population. J Urol 2007;680-4.
14 Hannestad YS, Rortveit G, Hunskaar S. Help-seeking and associated factors in female urinary incontinence, the Norwegian EPINCONT Study. Scand J Prim Health Care 2002;20:102-7.
15 Coyne KS, Kvasz M, Ireland AM, Milsom I, Kopp ZS, Chapple CR. Urinary
Incontinence and its Relationship to Mental Health and Health-Related Quality of Life in Men and Women in Sweden, the United Kingdom, and the United States. Eur Urol 2012;61:88-95.
16 O‘Donnell M, Lose G, Sykes D, Voss S, Hunskaar S. Help-seeking behaviour and associated factors among women with urinary incontinence in France, Germany, Spain and the United Kingdom. Eur Urol 2005;47:385-92.
17 Black N, Griffiths J, Pope C, Bowling A, Abel P. Impact of surgery for stress incontinence on morbidity: cohort study. BMJ 1997;315:1493-8.
18 Kinchen KS, Burgio K, Diokno AC, Fultz NH, Bump R, Obenchain R. Factors associated with women‘s decisions to seek treatment for urinary incontinence. J Womens Health 2003;12:687-98.
19 Horrocks S, Somerset M, Stoddart H, Peters TJ. What prevents older people from seeking treatment for urinary incontinence? A qualitative exploration of barriers to the use of community continence services. Fam Pract 2004;21:689-96.
20 Conseil National de l‘Ordre des Médecins. Atlas de la démographie médicale en France, situation au 1er janvier 2008.
Table I: Characteristics and comparison of respondents to the follow-up questionnaire (N=2273) and non-respondents (N=265), analysis adjusted for age.
Characteristics at baseline (2000) except: *1989, **1990-96, ***1994. Follow-up questionnaire (2008) Responders (N=2273) Non-responders (N=265) n % n % p Age <55 55+ 1282 991 56.4 43.6 134 131 50.6 49.4 0.07 Occupational category* management 192 8.7 16 6.3 0.008 supervisor, sales representative 1460 66.1 157 61.8
office worker, employee 556 25.2 81 31.9
Parity ** 0-1 925 40.7 101 38.1 0.36
>=2 1348 59.3 164 61.9
Number of persons at home >=3 626 27.5 91 34.3 0.004
Physical exercise yes 1205 53.0 102 38.5 0.001
BMI (kg/m²) <25 1489 65.5 157 60.1 0.14
>=25 784 34.6 104 39.9
Social support scale ***
weak 541 26.5 56 27.2
0.71
moderate 699 34.3 73 35.4
strong 798 39.2 77 37.4
Social satisfactionscale*** good 1335 65.2 122 58.6 0.06
poor 714 34.8 86 41.4
Social network index *** weak 1303 68 133 67.5 0.88
strong 614 32 64 32.5
Difficulty retaining urine Yes 1260 56.4 144 55.6 0.78
Involuntary urinary leakage Yes 1192 52.8 127 48.9 0.21
UI hygienic or social problem Yes 518 23.3 52 20.1 0.23
UI type No UI 1065 47.1 133 50.8 0.67 Stress UI 337 14.9 32 12.2 Urge UI 62 2.7 8 3.1 Mixed UI 782 34.6 88 33.6 Undetermined UI type 16 0.7 1 0.4 UI severity (Sandvik score) No UI (0) 1065 47.2 133 51.1 0.69 Mild (1-2) 845 37.4 86 33.1 Moderate (3-4) 231 10.2 23 8.9 Severe (6-8) 116 5.2 18 6.9
Hypertension or cardiovascular disease yes 641 28.2 95 35.8 0.02
Medication use yes 1299 58.4 165 64.7 0.08
Table II: Women‘s characteristics at baseline associated with care-seeking for UI during the 8-year follow-up period. Each logistic regression is adjusted for age. ORs are in bold when p < 0.05.
Model 1 Social demographic
Model 2 Urinary incontinence
Model 3
Health issues Final Model Characteristics N % adjusted OR [95%CI] N % adjusted OR [95%CI] N % adjusted OR [95%CI] N % adjusted OR [95%CI] Age/ 3-year 1859 1.1 [1.0-1.3] 2257 1.1 [1.0-1.3] 2159 1.1 [1.0-1.3] 1931 1.1 [1.0-1.3] Parity <2 730 13.4 1 >=2 1129 17.1 1.4 [1.1-1.9] Number of persons at home
<3 1351 16.6 1 >=3 508 13.2 0.8 [0.6-1.1] Social network index
good 595 13.1 1 weak 1264 16.9 1.3 [0.9-1.7] Social support scale
strong 744 12.4 1 748 13.1 1
moderate 643 15.9 1.2 [0.9-1.7] 668 15.4 1.2 [0.8-1.6] weak 472 20.6 1.6 [1.1-2.2] 515 20.0 1.4 [1.0-2.0] Social satisfaction scale
good 1236 14.1 1 poor 623 18.8 1.2 [0.9-1.6] UI severity at baseline (Sandvik)
no UI 1065 5.3 0.5 [0.3-0.7] 898 5.3 0.5 [0.3-0.8] mild 845 17.5 1 733 17.9 1 moderate 231 33.8 1.9 [1.4-2.7] 197 34.0 1.8 [1.2-2.6] severe 116 56.0 4.4 [2.9-6.7] 103 56.3 4.1 [2.6-6.5] UI type no UI (2000) 1065 5.3 . 898 5.3 . stress UI 333 12.9 1 292 13.0 1 urge UI 62 22.6 1.7 [0.9-3.5] 56 23.2 1.9 [0.9-3.9] mixed UI 781 29.6 2.1 [1.4-3.0] 675 30.1 2.0 [1.3-3.0] Discussion of UI with friends or close relatives
no UI (2000) 1065 5.3 . 898 5.3 .
no 886 20.7 1 751 20.9 1
yes 306 35.3 1.4 [1.0-2.0] 282 35.1 1.5 [1.0-2.1] Discussion of UI with colleagues
no UI (2000) 1065 5.3 . 898 5.3 no 1107 23.0 1 954 23.4 1 yes 85 42.4 1.5 [0.9-2.6] 79 41.8 1.5 [0.9-2.7] Quality of life (NHP) good 717 10.7 1 643 10.6 1 moderate 717 15.5 1.5 [1.1-2.0] 636 16.0 1.3 [0.9-1.9] poor 752 20.4 2.0 [1.5-2.7] 652 20.6 1.3 [0.9-1.9] Consultation with GP in the last 12 months
no 86 14.6 1 81 4.9 1
yes 2073 16.0 3.3 [1.2-9.2] 1850 16.2 2.4[0.8-6.9] Neurologic disease
no 2001 14.7 1 1797 14.9 1
yes 158 25.9 1.6 [1.1-2.4] 134 26.9 1.6 [1.1-2.6] Hypertension or cardiovascular disease
no 1550 14.1 1
yes 609 19.2 1.3 [1.0-1.6]
concordance index 0.60 0.77 0.62 0.78
OR for age was calculated continuously but is reported by 3-year increments.
Variables not found to be significant and not shown: educational level, occupation, household incomes, size of city of residence, marital status, physical exercise, alcohol consumption, smoking, discussion of UI with partner, UI as hygienic or social problem, frequency, urgency, BMI, menopausal status, hot flushes, vaginal dryness,
diabetes or endocrinopathy, chronic bronchitis or cough, lumbar or sciatic pain, drug consumption, diuretic consumption, antidepressant consumption, and sleeping pill use.
Table III: Consultation, treatment for UI, and satisfaction (N=2273)
N %
Consultation for UI none 1925 84.7
one 236 10.4
several 112 4.9
Physicians' gender man 152 43.7
woman 133 38.2
both 33 9.5
data missing 30 8.6
Physicians' specialty General Practitioner 150 43.1
Gynecologist 186 53.5
Urologist 82 23.6
other 20 5.8
Satisfied with consultation missing data 12 3.4
not at all or a little 75 21.6
somewhat, very or
completely 261 75.0
Treatment of UI none 2003 88.1
one 189 8.3
several 81 3.6
Surgery one procedure 88 32.6
several 4 1.5
Medication one type 30 11.1
several 24 8.9
Pelvic floor exercise one prescription 93 34.4
several 91 33.7
Other treatment one 6 2.2
several 2 0.7
Satisfaction with treatment outcome
missing data 21 7.8
poorer than expected 107 39.6
Table IV: Women‘s characteristics at baseline associated with dissatisfaction with the doctor‘s visit for UI during the 8-year follow-up period. Logistic regression adjusted for age. OR are indicated bold when p < 0.05.
Characteristics N Age adjusted
OR [95%CI]
Full adjusted OR [95%CI] Number of persons at home
<3 262 1.0
>=3 74 0.5 [0.3-1.1]
Social support scale
strong 99 1 1 moderate 102 0.7 [0.3-1.5] 0.9 [0.4-2.1] weak 105 1.9 [1.0-3.7] 2.2 [1.2-5.3] Urgency no 133 1 1 yes 197 3.7 [2.0-7.0] 2.7 [1.2-5.9]
UI hygienic or social problem
no 110 1 yes 162 1.6 [0.9-2.8] UI Type stress UI 42 1 1 urge UI 14 15 [2.6-89] 16 [1.5-171] mixed UI 224 7.1 [1.7-31] 6.0 [0.7-48] UI severity (Sandvik) mild 142 1 1 moderate 76 2.7 [1.4-5.3] 1.8 [0.8-3.9] severe 64 2.4 [1.2-4.8] 2.0 [0.9-4.4] Quality of life (NHP) moderate or good 192 1.0 poor 144 1.7 [1.0-2.9] Hot flushes no 165 1.0 yes 171 1.6 [0.9-2.7]
Chronic bronchitis or cough
no 310 1 1
yes 26 0.4 [0.1-1.4] 0.2 [0.0-0.9]
Hypertension or cardiovascular disease
no 223 1.0 yes 113 1.5 [0.9-2.5] Medication use no 119 1.0 yes 209 1.7 [0.9-3.1] Antidepressant use no 275 1.0 yes 53 1.6 [0.8-3.1] concordance index 0.77
Variables not found to be significant and not shown here: educational level, occupation, household incomes, marital status, parity, size of the city of residence, physical exercise, alcohol consumption, smoking, BMI, social network index, social satisfaction scale, discussion of UI with friends close relatives, colleagues, or partner, frequency, consultation with GP, menopausal status, vaginal dryness, diabetes or endocrinopathy, neurologic disease, lumbar or sciatic pain, diuretic use, and sleeping pill use.
Table V: Women‘s characteristics at baseline associated with dissatisfaction with UI treatment during the 8-year follow-up period. Logistic regression adjusted for age. OR are indicated bold when p < 0.05.
Characteristics N Age adjusted
OR [95%CI] Full adjusted OR [95%CI] Marital status alone 52 1 1 couple 197 0.6 [0.3-1.1] 0.6 [0.3-1.2] BMI <25 167 1 25+ 82 1.3 [0.8-2.3]
Social network index
weak 157 1 1 good 62 0.6 [0.3-1.0] UI Type stress UI 37 1 1 urge UI 10 3.1 [0.7-13.3] 2.5 [0.5-11.7] mixed UI 165 2.8 [1.2-6.3] 2.8 [1.2-6.6] UI severity (Sandvik) mild 110 1 1 moderate 57 1.6 [0.8-3.0] 1.5 [0.7-3.2] severe 47 2.2[1.1-4.4] 2.1 [1.0-4.5] UI treatment* surgery 77 1 1 médication 37 1.3 [0.6-3.0] 1.6 [0.7-3.9]
pelvic floor exercise 129 1.1 [0.6-1.9] 1.6 [0.8-3.1]
Discussion of UI with friends or close relatives
no 132 1
yes 82 1.5 [0.9-2.7]
Discussion of UI with colleagues
no 184 1 1 yes 30 1.8 [0.8-4.1] 2.1 [0.8-5.1] Urgency no 99 1 1 Yes 145 2.1 [1.2-3.6] Quality of life (NHP) moderate or good 149 1 1 poor 100 2.1 [1.3-3.6] 2.1 [1.2-3.7]
Hypertension or cardiovascular disease
no 165 1 1 yes 84 1.4 [0.9-2.5] 1.8 [1.0-3.3] Diabetes or endocrinopathy no 197 1 1 Yes 52 0.6 [0.3-1.1] 0.4 [0.2-0.8] Concordance index 0.70
Variables not found to be significant and not shown here: educational level, occupation, number of persons at home, household incomes, parity, size of the city of residence, physical exercise, alcohol consumption, smoking, social satisfaction scale, social support scale, UI hygienic or social problem, discussion of UI with partner, frequency, consultation with GP in the last 12 months, menopausal status, hot flushes, vaginal dryness, chronic bronchitis or cough, neurologic disease, lumbar or sciatic pain, medication use, antidepressant use, diuretic use, and sleeping pill use.
*Type of treatment was defined as followed: surgery: alone or combined with another type of treatment; medication: alone or combined with another treatment except surgery; pelvic floor exercise: alone or combined with another treatment except medication or surgery.