HAL Id: halshs-01535104
https://halshs.archives-ouvertes.fr/halshs-01535104
Preprint submitted on 8 Jun 2017
HAL is a multi-disciplinary open access
archive for the deposit and dissemination of sci-entific research documents, whether they are pub-lished or not. The documents may come from teaching and research institutions in France or abroad, or from public or private research centers.
L’archive ouverte pluridisciplinaire HAL, est destinée au dépôt et à la diffusion de documents scientifiques de niveau recherche, publiés ou non, émanant des établissements d’enseignement et de recherche français ou étrangers, des laboratoires publics ou privés.
mobilization in West African Economic and Monetary
Union (WAEMU)
Maïmouna Diakite, Jean-François Brun, Souleymane Diarra, Nasser Ary
Tanimoune
To cite this version:
Maïmouna Diakite, Jean-François Brun, Souleymane Diarra, Nasser Ary Tanimoune. The effects of tax coordination on the tax revenue mobilization in West African Economic and Monetary Union (WAEMU). 2017. �halshs-01535104�
C E N T R E D'E T U D E S E T D E R E C H E R C H E S S U R L E D E V E L O P P E M E N T I N T E R N A T I O N A L
SÉRIE ÉTUDES ET DOCUMENTS
The effects of tax coordination on the tax revenue mobilization in
West African Economic and Monetary Union (WAEMU)
Maïmouna Diakité
Jean-François Brun
Souleymane Diarra
Nasser Ary Tanimoune
Études et Documents n° 12
June 2017
To cite this document:
Diakité M., Brun J.-F., Diarra S., Ary Tanimoune N. (2017) “The effects of tax coordination on the tax revenue mobilization in West African Economic and Monetary Union (WAEMU)”, Études et
Documents, n° 12, CERDI. http://cerdi.org/production/show/id/1881/type_production_id/1
CERDI
65 BD. F. MITTERRAND
63000 CLERMONT FERRAND – FRANCE TEL.+33473177400
FAX +33473177428
2 The authors
Maïmouna Diakité
PhD Student in Economics, École d’économie et CERDI, Université Clermont Auvergne - CNRS, Clermont-Ferrand, France.
E-mail: maimouna.diakite@etu.udamail.fr
Jean-François Brun
Associate Professor, École d’économie et CERDI, Université Clermont Auvergne - CNRS, Clermont-Ferrand, France.
E-mail: j-francois.brun@uca.fr
Souleymane Diarra
Professional Economist, WAEMU Commission.
E-mail: tamanisouley@yahoo.fr
Nasser Ary Tanimoune
Associate Professor, University of Ottawa.
E-mail: narytani@uottawa.ca
Corresponding author: Maïmouna Diakité
This work was supported by the LABEX IDGM+ (ANR-10-LABX-14-01) within the program “Investissements d’Avenir” operated by the French National Research Agency (ANR).
Études et Documents are available online at: http://www.cerdi.org/ed Director of Publication: Grégoire Rota-Graziosi
Editor: Catherine Araujo Bonjean Publisher: Mariannick Cornec ISSN: 2114 - 7957
Disclaimer:
Études et Documents is a working papers series. Working Papers are not refereed, they constitute
research in progress. Responsibility for the contents and opinions expressed in the working papers rests solely with the authors. Comments and suggestions are welcome and should be addressed to the authors.
3
Abstract
A main objective of the regional integration in West African Economic and Monetary Union (WAEMU) is the effective harmonization of national legislations at Community level notably tax legislation. To coordinate taxation in the zone, WAEMU Commission translates into Directives the Decisions taken by the Council of Ministers of the member states. The implementation of the Community acts by countries through tax reforms may impact on their revenue performance. This paper evaluates the impact of the Directives both in terms of coordination and revenue mobilization. It relies on a comparative case study using the synthetic control method developed by Abadie and Gardeazabal (2003) and extended by Abadie, Diamond, and Hainmueller (2010 & 2015). The main results are that the tax coordination affected the revenue mobilization in the Union but the impact is different across countries.
Keywords
Tax, Tax coordination\harmonization, Tax reform, Synthetic control method, WAEMU.
JEL Codes
Introduction
A main objective of the regional integration in West African Economic and Monetary Union (WAEMU) is the effective harmonization of national legislations at Community level notably tax legislation. The Article 4 of the WAEMU Treaty1 aims at strengthening the
economic competitiveness of the member states, setting up a Common Market, promoting a more efficient allocation of resources, improving equity between consumers inside the Union and fostering the development of trade with the Rest of the World2. To coordinate taxation
in the zone, WAEMU Commission translates into Directives (or Community acts) the Deci-sions taken by the Council of Ministers of the member states3. Presently, fourteen Directives and one Regulation are in effect. The implementation of the Community acts by countries through tax reforms may impact on their revenue performance.
The WAEMU legislation allows for the conduct of impact studies in very specific cases but not in a general framework4. Mansour and Rota-Grasiozi (2013) attempt to fill this gap
by providing a detailed description of the tax coordination process in WAEMU and by as-sessing its strength, weaknesses and potential impact on intra-WAEMU distortions to trade, investment and revenue mobilization. Regarding revenue mobilization, their study analyzes the evolution of the level and the structure of tax revenue for the Union as a whole and for each member state, since the adoption of the Treaty and the establishment of the Customs Union (2000) ; comparisons are made with some selected sub-Saharan African regional trade groups. Diarra (2012) analyzes the impact of commodity price shocks on the tax transition process. Geourjon and Mansour (2013) discuss about the effects of tariff reforms notably the extension of the Customs Union to the ECOWAS area on the domestic tax revenue mo-bilization. Mansour et al. (2013), conducted a qualitative analysis on the harmonization of the direct taxation with an emphasis on the issue of tax expenditure5. Yohou et al. (2016)
examine the heterogeneous effects of foreign aid on tax revenue in the WAEMU countries. However, to the best of our knowledge there is no study which estimates the quantitative impact of the harmonization process on tax revenue mobilization for the whole Union and for each member state.
1. The Treaty was adopted in 1994 and modified in 2003. 2. Annex to the Decision N◦01/98/CM/UEMOA.
3. "Directives are binding, as to the result to be achieved, upon any or all of the Member States to whom they are addressed, but leave to the national authorities the choice of form and methods. Where Member states to whom they are addressed are stipulated they are binding only on them, and address situations specific to those Member States or persons. Regulations are of general application, binding in their entirety and directly applicable. They must be complied with fully by Member States to whom they apply". (European Union, 2017).
4. The Annex to the Decision N◦10/2006/CM/UEMOA in its section I_1_315 requires an impact study of the adoption of a single rate VAT system. The Annex to the Decision N◦16/2006/CM/UEMOA in its section III_B_2 recommends the conducting of an impact analysis of a Corporate Tax Rate lies between 25% and 40% in addition to a minimum tax rate.
5. This study has been conducted in the framework of the technical assistance of the International Mo-netary Fund at the request of WAEMU Commission.
In 2014, over 80 percent of member countries’ tax (including tariff) revenues were deri-ved from taxes that are subject to regional Directives or regulations, (Mansour and Rota-Grasiozi, 2013). The establishment of the Customs Union leaded to a decline in trade taxes revenue. The share of trade taxes to the overall tax revenue decreased by 25.4% between the nineties and the post-reform period (2000/2010)6. Having anticipated this decline, the
WAEMU policy makers, in july 1998, took the decision to coordinate the domestic indirect taxation with the goal to increase tax productivity. The adoption of the tax transition pro-gram (Decision N◦10/2006/CM/UEMOA) reaffirmed this commitment. There was a strong determination to improve the tax performance indicators notably the ratio value-added tax (VAT) to GDP and that of excise taxes. Regarding direct taxation, the will to reconcile revenue mobilization with a business-friendly environment was expressed.
This paper evaluates the impact of the Directives both in terms of coordination and revenue mobilization. It relies on a comparative case study using the synthetic control me-thod developed by Abadie and Gardeazabal (2003) and extended by Abadie, Diamond, and Hainmueller (2010 & 2015). The method takes into account both the qualitative and the quantitative approaches. The main results are that the tax coordination affected the revenue mobilization in the Union but the impact is different across countries.
1
Adoption of the Common External Tariff (CET) and the Tax
Transition Program in WAEMU
At the end of the 1990s, the WAEMU member states undertook some important reforms of the customs tariffs. This started in 1996 by the adoption of a transitional trade regime re-gulating the intracommunity trade. The adoption of a Common External Tariff was finalized in 2000, from this moment, the customs code of the Union regulated exchanges. The CET consists of four tariff bands : 0% for basic products (unprocessed food), 5% for equipment and raw materials, 10% for inputs and 20% for finished product ; in this way, products are taxed according to the degree of processing. A community list of exempted goods was provided7.
The creation of free Zones has been approved. A shortfall of trade taxes was expected from these reforms and the Commission of WAEMU issued Community acts fostering the collec-tion of domestic revenue in the member states to face this challenge. This was formalized by the adoption of the Decision n◦10/2006/CM/UEMOA presenting the tax transition program of the Union. The main objectives of the program consist to ensure better linkages between customs tariffs and domestic taxation in terms of legislation, tax collection and tax manage-ment ; improve domestic tax revenue mobilization while decreasing the tax burden on capital and labor. The Decision N◦34/2009/CM/UEMOA proposed criteria and indicators for the tax transition. We can distinguish principal criteria, namely the ratio of trade tax to overall
6. Mansour (2014) dataset and authors’ calculations.
7. Annex to the Regulation N◦09/2001/CM/UEMOA adopting the Customs code of the West African Economic and Monetary Union.
tax which must be equal to or below 45% ; the ratio of domestic tax to overall tax which must be equal to or above 55% and the ratio of domestic tax to trade tax which must be equal to or above 1.5. It proposed also additional criteria such as the ratio VAT plus excises to overall tax. About indicators, we distinguish performance indicators (allowing to measure the impact of the tax transition on tax revenue mobilization) and monitoring indicators (allowing to appreciate the extent to which the specific objectives are delivered). Moreover, the Decision N◦35/2009/CM/UEMOA adopted the monitoring system of the tax transition program. It is composed of a regional steering committee ensuring the implementation of the program and a national monitoring committee supervising its implementation.
2
Framework of the Domestic Tax Coordination in WAEMU
The tax coordination in WAEMU is based on five (5) Decisions which led to the elabora-tion of Directives. The Decision N◦01/98/CM/UEMOA concerns the harmonization of Do-mestic Indirect Taxation ; the Decision N◦10/2006/CM/UEMOA defines the tax transition Program of the Union ; the Decision N◦16/2006/CM/UEMOA concerns the implementation of the Direct taxation coordination ; the Decision N◦34/2009/CM/UEMOA fixes the tax transition indicators and the Decision N◦35/2009/CM/UEMOA establishes the follow-up actions of the tax transition Program.
This section discusses the main contents of these Community Acts, in addition, it provides information about their implementation by the member states8.
2.1 The Domestic Indirect Tax coordination in WAEMU
Value-added tax regimes, excises, petroleum products taxation and that of small and medium-sized enterprises are concerned by the coordination.
2.1.1 Value-added tax Coordination
Value-added tax harmonized regime sets out general rules for the taxation of transac-tions inside the WAEMU9. The key components of the regime are as follows : the registration
threshold is fixed between XOF 30M10 and 100M for the supply of goods and XOF 15M to
50M for the supply of services.
8. The information is provided for the de jure implementation either in 2010 or in 2012 given there are the first years for whom we found documentation about the implementation of Directives from the WAEMU Commission. This means we just consider that a country undertook the coordination process when it adopted legislation due to the fact we haven’t information on the date of de facto implementation. Some information about the de facto implementation are available in Mansour and Rota- Graziosi (2013).
9. Three Directives have been elaborated to coordinate VAT regimes : the Direc-tive N◦02/98/CM/UEMOA, the Directive N◦06/2002/CM/ UEMOA and the Directive N◦02/2009/CM/UEMOA.
The Directives allow the adoption of a standard rate between 15% and 20% and a re-duced VAT rate between 5% and 10% ; a comprehensive list of taxable goods and services at the reduced rate is provided11. The exempted supplies are related to the health care12,
education, non-processed food or most basic foods, the social block for water and electricity and domestic gas. Exemptions are granted on the activities of development agencies. The refunding of VAT credits depends on a minimum threshold fixed by countries. The deadline set for the refunding is fifteen (15) days. Persons liable to VAT cannot deduct the tax on re-ception charges, accommodation, catering, event charges, purchasing of company cars13.The substitution of the previous sale tax systems to a value-added system is recommended by the Directives.
In 2010, all the WAEMU member states had implemented the Directives excepted Bissau Guinea which is the only country in the Union which has not adopted a value-added tax regime. However, none of them refunded VAT credits according to the Community legislation.
2.1.2 Excises Coordination
Two Directives have been developed to coordinate the excises taxation in WAEMU14.They define the list of goods taxable by excises in the Union such as alcohol beverages, soft drinks, fruit and vegetable juices excepted water, tobacco, guns and ammunition, wheat flour, oils and fats, tea, coffee, perfumery and cosmetics, plastic bags, marble, gold bullion, precious stones and cars (with a horsepower equal or greater than 13). The member states set tax at most six of the above products. A maximum rate and a minimum rate are defined by product. The highest rate that can be applied (50%) concerns the alcohol beverages and the lowest (0%) is related to soft drinks, fruit and vegetable juices.
All WAEMU countries transposed the Community legislation in a large extent15. Never-theless, no country complies with the Community list of taxable goods in 2012.
2.1.3 Coordination of Petroleum products taxation
A Community tax regime for petroleum products has been elaborated with the aim of har-monizing prices, ensuring more transparency and creating a business-friendly environment16. A Community list defined the products concerned namely aviation gasoline, premium fuel, regular gasoline, jet fuel, kerosene, gas oil, domestic fuel oil, fuel oil and butane. The types of tax applicable to these products are restricted to tariffs, specific tax and value-added tax.
11. We can note hardware, agricultural equipment, industrial equipment used to produce the solar energy, processed milk, sugar, oil pasta, accommodation and catering provided by hotels and services delivered by tourist agencies.
12. A Community list of exempted medicines, pharmaceuticals and medical equipment has been provided. 13. Countries could enlarge this list.
14. The Directive N◦03/98/CM/UEMOA and the Directive N◦03/2009/CM/UEMOA. 15. Excepted Guinea Bissau.
About consolidated excises, the member states levy a specific tax on a liter or a kilogram protecting them from price fluctuations. Countries could fix the amount of the tax through the legislative authority. However, the gap between taxes per product has been limited to XOF 200 and must decrease over time in a proportion of XOF 20 per annum then the gap will be filled in ten years. About subsidies, only direct grants, through companies, undistor-ting competition, are allowed. The suppression of the other types of subventions within a period of seven years is advocated. At last, the allocation of the revenue mobilized to the general government budget is recommended.
In 2010, Benin was the only country which implemented the Directive. However, in 2012 Burkina Faso, Mali and Niger implemented the Community legislation. Nevertheless, the mentioned countries meet difficulties in terms of monthly price readjustments.
2.2 The Direct tax coordination in WAEMU
Three (3) Directives and one (1) Regulation17are related to the harmonization of business profits taxation.
2.2.1 Coordination of the Corporate Income Tax (CIT)
At this level, the texts define the scope of business profits taxation, determine the taxable profit and aim to avoid double taxation of profits. Profits on commercial, industrial, han-dicraft, forestry, mining and agricultural activities are taxable. The income tax rate should be between 25% and 30%. Member states should exempt from the tax base the following income sources : capital gains on business assets if the taxpayer intends, within three years, to reinvest the total proceeds from selling the assets in a WAEMU member state ; and inter-corporate dividends to the extent that the holding company has a controlling interest (defi-ned as at least 10 percent of the shares) in the payer company, and that both companies are WAEMU residents in all other cases, at least 40 percent of inter-corporate dividends should be taxable18. About the deductible charges from the tax base, one can distinguish : all types
of overhead expenses19; fees on transfers of business licenses, patents, trademark agreements,
manufacturing processes and formulas, other similar rights and technical assistance fees ; tax imposed and payed during the budget year excepted the CIT and the minimum tax rate20; linear depreciation ; loss and charge provisions ; interest paid to associates on the additional funds they provide besides capital share on condition that the interest rate is lower than the discount rate of the Central Bank increased by three points and the share of capital shall be fully paid up ; grants ; employer’s contribution and additional funding for issuing
17. One can note the Directive N◦07/2001/CM/UEMOA, the Directive N◦01/2008/CM/UEMOA, the Directive N◦08/2008/CM/UEMOA and the Regulation N◦08/CM/UEMOA.
18. (Mansour and Rota-Grasiozi, 2013). Moreover, the exemption granted in the national sectoral codes are permitted.
19. Member states should fix a maximum amount deductible for staff expenses. 20. The member states could exclude other taxes.
or purchasing mutual fund shares whether the fund is located inside the Union ; insurance premium paid to companies located in WAEMU covering risks which could reduce the net assets of companies ; deficit of a previous financial year ; headquarters expenses ; research and prospecting costs of creation of a permanent establishment inside the Union, operating costs of the latter are deductible within the three first budget years ; accelerated depreciation, digressive depreciation and depreciation lease-financed assets are deductible under certain conditions ; Elsewhere, the member state could reinstate the charges on transfers between subsidiaries and parent companies. The implementation of a tax prepayment system is pos-sible nevertheless the rate of the prepayment can’t exceed 3%21; the tax credits are carried forward or refunded according to the national legislation. About the Multilateral Tax Treaty, the principle of territoriality (which is more favourable to the territorial jurisdiction in which profits are made) is applied.
In 2010, all the member states implemented the tax prepayment system excepted Togo. In 2012, the harmonization of the taxable profit and that of the CIT rate were effective in all countries.
2.2.2 Coordination of the taxation of financial activities in WAEMU
The Directives coordinating such activities give to banks and other financial institutions the possibility to deduct allowance for bad debts from the corporate tax base according to the Central Bank prudential regulations22. Doubtful debt and litigious claims provisions saved
by banks and financial institutions are also concerned by the deduction in accordance with banking regulation and reserves for reported claims, reserves for premium cancellation saved by life insurance holding companies as defined by the Code of the Inter African Insurance Market Conference. Countries should fix the duration of the forward carrying of losses with respect of a three years’ minimum duration. The rates applied to securities income are as follows : 10% to 15% for dividend payments ; 2% to 7% for dividend payments by companies listed on a stock exchange approved by the "Conseil Régional de l’Epargne Publique et des Marchés Financiers (CREPMF)" ; 6% for income from bonds.
About income from bonds issued by government, public entities and their dismember-ments, they are taxed to 3% if the term of the bond range from 5 (five) years to ten (10) years. The rate tax is 0% for the long-term bonds (with a duration higher than 10 years). Gains on the assignment of bonds cannot be taxed at a rate exceeding 5% of the amount. Incomes distributed by the Undertakings for Collective Investment in Transferable Securities and other collective investment funds are exempted besides the gains on the assignments of such institutions. The double taxation of income and gains on the assignment of securities
21. However, it should be set to 5% for companies which are not registered for tax purposes.
22. Three Directives have been elaborated to coordinate the taxation of financial activities in WAEMU namely the Directive N◦05/2008/CM/UEMOA, the Directive N◦02/2010/CM/UEMOA and the Directive N◦02/2011/CM/UEMOA.
has been prohibited inside the Union. Elsewhere, income of Closed-end investment companies is exempted for CIT and tax on securities. However, this exemption should not exceed 15 years. Returns generated in the funds managed by these institutions and gains on securities are also exempted for at least 3 years. Concerning the gains reinvested the same budget year, they are exempted regardless the duration.
Niger and Togo were the only countries having transposed the Directive intended to coordi-nate securities taxation in WAEMU, in 201223.
2.3 Harmonization and modernization of the information exchange systems
between customs and domestic tax administrations inside the member states
A specific Directive24 was elaborated for this purpose. The creation of an information
exchange platform was advocated and those of a steering committee and a management committee ensuring the management of the platform. The steering committee should be in charge of preparing and supervising the implementation of the platform. The management committee should be in charge of the administrative management and monitoring the proper functioning of the platform. At last, the member states should cooperate with the Commis-sion of WAEMU for its inception and operationalisation.
We don’t find information about the implementation of this Directive.
3
Empirical analysis
Comparative case study allows to assess the impact of an event or policy intervention on an outcome. One (or more) unit(s) exposed to the event is (are) compared with one (or more) unexposed unit(s). This study uses the synthetic control method to analyse the effects of tax coordination in WAEMU on revenue mobilization.
The synthetic control method is a comparative case methodology using a data-drive approach for estimating the effects of treatments. The counterfactual of the treated unit "the synthetic control" is defined as a convex combination of unexposed units. Because the weights can be restricted to be positive and sum to one, the synthetic control method pro-vides a safeguard against extrapolation. (Abadie et al. 2010). By carefully specifying how units are selected for the comparison group, the synthetic control method opens the door to the possibility of precise quantitative inference in comparative case studies, without preclu-ding qualitative approaches to the same dataset. Moreover, in contrast to regression analysis techniques such as Mill’s Method of Difference, the synthetic control method makes explicit the contribution of each comparison unit to the counterfactual of interest. This allows
resear-23. We only found information about the implementation of this Directive. 24. Directive N◦02/2012/CM/UEMOA.
chers to use quantitative and qualitative techniques to analyse similarities and differences between the unit or units representing the case of interest and the synthetic control. (Abadie et al. 2015).
However, as limitations, the synthetic control method requires the use of a balanced dataset, the exclusion of units having experienced a similar event, the restriction of the donor pool to units with similar characteristics to the treated unit (to avoid interpolation biases and overfitting), the inclusion of a sizeable number of pre-intervention periods and a sizeable number of post-intervention periods under certain conditions.
3.1 Literature Review
The synthetic control method has been developed by Abadie and Gardeazabal (2003). Abadie, Diamond and Hainmueller (2010 & 2015) and Cavallo et al. (2013) extended the method25.
Abadie and Gardeazabal (2003) presented the synthetic control method and used it to assess the economic effects of conflict on income in the Basque Country. Abadie, Diamond and Hainmueller (2010) investigated the application of synthetic control methods to com-parative case studies, provided new inferential methods and applied the synthetic control method in estimating the effects of Proposition 99 (a large-scale tobacco control program that California implemented in 1988) on tobacco consumption. In another study conducted in 2015, the authors illustrated the ideas behind the synthetic control method and they assessed the economic impact of the 1990 German reunification on West Germany. Cavallo et al. (2013) expanded the synthetic control method in allowing several units to experience treatment at possibly different times and provided basic checks to see if the synthetic control serves as a valid counterfactual. They applied these extensions in treating the question of whether natural disasters affect economic growth.
A number of studies used the synthetic control method to assess the effects of different events. Montalvo (2011) analysed the electoral impact of terrorist attacks. Billmeier and Nannicini (2011 and 2013) assessed the impact of economic liberalization on growth. Hin-richs (2012) assessed the effects of affirmative action bans on college enrollment, educational attainment and college demographic composition in United States of America. Abdallah and Lastrapes (2012) studied how a constitutional amendment relaxing severe restrictions on home equity lending affected household spending in Texas. Dorsett (2013) explored the effect of conflict on income in Northern Ireland. Bauhoff (2014) measured the impact of a nutrition policy in improving adolescent dietary behaviour and reducing childhood obesity.
25. Abadie et al. (2011) provided a R package to implement synthetic control method for comparative case studies. Galiani and Quistorff (2016) extended the Stata package "synth" developed by Abadie et al. (2011). This extension "synth_runner" automates the process of running multiple synthetic control estimations and includes the expansion of Cavallo et al. (2013).
Bohn, Lofstrom, and Raphael (2014) evaluated the effect of the 2007 Legal Arizona Workers Act on the state’s unauthorized immigration. DeAngelo and Hansen (2014) used the SCM in estimating the causal effect of police on crime. The study of Smith (2015) measured the impact of major natural resource discoveries since 1950 on growth. Liu (2015) evaluated the short- and long-run effects of universities on geographic clustering of economic activity, labor market composition and local productivity.
Besides the study of Abadie, Diamond and Hainmueller (2010), that of Adhikari and Alm (2016) evaluated the effect of a tax reform. The authors analyzed the impact of flat tax reform on income for eight Eastern and Central European countries that adopted flat tax systems. They also used SCM to estimate the causal effect of flat tax on the investment and employment recognized in standard economy as the possible mechanisms through which flat tax reforms affect economic performance.
3.2 Empirical Strategy
3.2.1 Single Unit (Individual Country) Treatment
Following Abadie et al. (2010 & 2015), suppose the sample includes C + 1 units (units correspond to countries in this case). Without loss of generality, we regard c = 1 as the treated country and c = 2 to c = C + 1 are potential comparisons in the donor pool (some non-WAEMU sub-Saharan African countries). We assume that all countries are observed at the same years y = 1, ..., Y . The sample includes a positive number of pre-reform years Y0 and
a positive number of post-reform years Y1, then Y = Y0 + Y1. Suppose a WAEMU member
state having implemented the reform during years Y0+ 1, ..., Y and its revenue mobilization
has not been affected during the pre-reform years 1, ..., Y0.
A synthetic control being a weighted average of the units in the donor pool, it can be represented by a (C ∗ 1) vector of weights W = (w2, ..., wC+1)′ and 0 ≤ wc ≤ 1. c = 2...C
and w2 + ... + wC + 1 = 1. Each particular value of W is a synthetic control. As for the
difference-and-difference method, the synthetic control method selects the value of W such that the characteristics of the treated unit are best resembled by the characteristics of the synthetic control (Abadie et al., 2015). Let X1 be a (k ∗ 1) vector composed of the values
of the pre-reform characteristics of the treated country which must be matched as closely as possible and let X0 be the (k∗ Y ) matrix containing the values of the same variables for
countries in the donor pool ; X1 and X0 should include pre-reform values of the outcome (tax
revenue). Thus, the vector X1− X0W corresponds to the difference between the pre-reform
characteristics of the treated country and a synthetic control. The synthetic control W∗ minimizing the size of this difference is selected. This can be operationalized in this way : for
m = 1, ..., k let X1m be the value of the m-th variable for the treated country and let X0m be
a 1∗ C vector including the values of the m-th variable for the countries in the donor pool.
W∗ is defined by Abadie and Gardeazabal (2003) and Abadie, Diamond and Hainmueller (2010 & 2015) as the value of W minimizing :
k
∑
m=1
vm(X1m− X0mW )2 (1)
vm is a weight reflecting the relative importance we assign to the m-th variable when the
discrepancy between X1 and X0W is measured. In this study, a cross-validation method is
applied to choose vm.
Let Titbe the outcome (tax revenue) of unit c at year y : let T1be a (Y1∗1) vector collecting
the post-reform values of the tax revenue for the treated country, then T1 = (T1Y0+1, ..., T1Y).
Similarly, let T0 be a matrix where column c includes the post-reform values of the tax
re-venue for country c + 1.
T1 − T0W∗, the synthetic control estimator of the effect is obtained by the comparison
of post-reform tax revenue of the treated country having implemented the reform and the synthetic control. That is for a post-reform period (with y ≥ Y0), the synthetic control
estimator of the impact of the reform is given by the comparison between the tax revenue for the treated country and the tax revenue for the synthetic control at that period.
T1y−
C+1∑ c=2
Wc∗Tcy (2)
The matching variables in X0 and X1 are regarded as the predictors of post-reform tax
revenue. The latter are not affected by the reform. Once it has been established that the unit representing the case of interest and the synthetic control unit have similar behaviour over extended periods of time prior to the intervention, a discrepancy in the outcome variable following the intervention is interpreted as produced by the intervention itself26. Let TC cy
be the tax revenue that would be raised by the country c in year y if this country didn’t implement the reform and let Tcy1 be the tax revenue that the country c would be raised if it implemented the reform in years Y0 + 1 to Y. If TcyC ̸= Tcy1, this means that the reform
affected the mobilization of tax revenue. Thus, the effect (αcy) will be :
αcy = Tcy1 − T C
cy (3)
3.2.2 Multiple Units (Whole Union) Treatment
As said earlier, Cavallo et al. (2013) expanded the synthetic control method in allowing several units to experience treatment at possibly different times. This allows to measure the effects of tax reforms for the whole Union. We proceed to this treatment as follows :
Let’s consider equation (3) above, we can note :
Tcy1 = TcyC+ αcy (4)
Let Dcy be a dummy that takes the value 1 if country c implemented the reform in year y
and 0 otherwise. The observed tax revenue for country c in year y is :
Tcy = TcyC + αcyDcy (5)
Given that only the first country implemented the reform and only after year Y0 (with
1≤ Y0 ≤ Y ), we have that :
Dcy ={1 if c=1 and y0 otherwise ≥ Y0 (6)
The parameters of interest are (α1Y0+ 1, ..., α1Y ) ; the lead specific impact of the reform on
the tax revenue for y > Y0,
α1y = T1y1 − T
N
1y = T1y− T1yN (7)
T1
1y being observed, to estimate α1y we need only to come up with an estimate for T1yN. Let
consider a (C∗ 1) vector of weights W = (w2, ..., wC+1)′ such that wc≥ 0 for c = 2, ..., C + 1
and w2+ w3 + ... + wC+1 = 1. Each value of the vector W represents a potential synthetic
control, that is a particular weighted average of control countries in the donor pool. Let Zc
be a (r∗1) vector of observed predictors of tax revenue (not affected by the reform). Suppose that there exists a set of weights (w∗2, ..., wc+1∗ ) which satisfies the equality∑C+1c=2 w∗c = 1 such that : C+1∑ c=2 wc∗Tc1 = T1,1 (8) C+1∑ c=2 w∗cTc1= T1,Y0 (9) C+1∑ c=2 w∗cZc= Z1 (10)
Following Abadie et al. (2010), let use ˆα1y = T1y− ∑C+1
c=2 wc∗Tcy as an estimator of α1y. The
systems of equations in (8) (9) and (10) can hold exactly only if (T1,1, ..., T1,Y0; Z1′) belongs
to the convex hull of [(T2,1, ..., T2,Y0; Z2′), ..., (TC+1,1, ..., TC+1,Y0; ZC+1′ )].
3.2.3 Inference
Statistical Inference in synthetic control methods consists in conducting "placebo stu-dies". We can distinguish "in time placebo tests" testing if the synthetic control method also estimate large effects when applied to dates when the intervention did not occur (Heckman and Hotz 1989). There is also "in-space placebos" used in the studies of Abadie and Gardea-zabal (2003), Abadie et al. (2010 & 2015). This is a non-parametric method testing if the distribution of placebo effects yields many effects as large as the main estimate, then it is likely that the estimated effect was observed by chance (Galiani and Quistorff, 2016).
to the distribution of placebo effects in computing a lead-specific significance level (two-sided p-value) for the event.
p− value = P r(|ˆαP L1y | ≥ | ˆα1y|) = ∑
C̸=11(| ˆαcy| ≥ | ˆα1y|)
C (11)
Recall that ˆα1y is the estimated effect for the post-reform period ; ˆαP L1y = ˆα1y is the
distri-bution of corresponding in-place placebos.
We can determine the one-sided p-value for positive effect as follows :
p− value = P r(ˆαP L1y ≥ ˆα1y) (12)
3.2.4 Data and sample
1. Variables
The sample includes Sub-Saharan African countries (for whom we obtained data on tax revenue and that we deem appropriate)27 to reduce interpolation biases. The impact analysis is done for the Whole Union28 and for the member states indepen-dently29. We assess the effects of the tax reforms, for the overall tax revenue30 and for the different groups of taxes independently namely the indirect tax, the direct tax and the trade tax. In this way, each type of tax is used as outcome variable be-sides the overall tax revenue31. All these revenues are expressed in percentage of GDP.
As predictors, we employ : GDP per capita and Broad Money given that an im-portant income supposes a wide tax base, on the other hand, the level of development is favourable to the tax performance due to its positive correlation with education and in this way to the performance of tax collectors, the level of development may also act on tax compliance knowing that demand for public infrastructure increases with the level of development ; Openness due to the fact that is it easier to tax trade than domestic transactions ; moreover, it may act positively on the productivity of domestic producers and in this way, it may increase the tax base ; Agriculture va-lue added : the agriculture revenue is hard to tax in developing countries in which subsistence agriculture informal remains widespread, we employ it as a dummy of shadow economy which affects negatively the tax collection ; Resource tax is re-garded as a determinant of non-resource revenue mobilization due to the fact that resource depending countries put less effort to collect tax because they rely on the
27. The list of countries is available in the appendix (Table 2).
28. We didn’t include Benin for this treatment, find further information below about dataset completion. 29. The treatment has been conducted also for Benin.
30. This concerns only the non-resource tax revenue. In fact, we excluded the resource tax revenue due the exogeneity of such revenue. As said by Brun, Chambas and Mansour (2014), the government resource revenue is largely exogenous, as it depends primarily on the existence of natural resources and on changes in the price of these resources which except for large producers are external to the country. Nevertheless, the latter is used as predictor given its importance may affect the non-resource revenue mobilization.
revenue generated by the exploitation of natural resources ; Additionally we use the Aid per capita, this variable may affect the revenue mobilization in two ways : first the dependence to Aid may negatively affect the intention of countries to mobilize domestic resources, however Aid provided as technical assistance may be favourable to countries tax management and thereby the tax performance ; Gini Index : in-equality may influence the tax compliance in the country and create social unrests unfavourable to the revenue collection ; Debt service : a higher debt service may encourage countries to mobilize resource given that they must refund the service be-sides the interest. Population growth, this variable is a proxy of the need in public infrastructure in a country thus, it should act positively on its revenue mobilization. Corruption, this phenomenon may affect negatively the tax performance, first due to the embezzlement of public funds, second because it may prompt tax agents to delay the processing of the applications of the good taxpayers and at last it may act on the tax compliance. Internal Conflict representing an assessment of political violence(namely civil war, coup threat, terrorism, political violence and civil disorder) in the country and its actual or potential impact on governance. It has an ambiguous effect on tax performance given it may encourage governments in mobilizing resources to buy arms on the other hand the unrests that it causes may be harmful to the tax performance. We include the average first half trend of the outcome in addition to the set of covariates32.
2. Dataset completion
The use of synthetic control method requires a balanced dataset, thus we put efforts to balance the dataset. We completed the data on openness for Ethiopia from 1992 to 2010 with the dataset of UNCTAD33and we reported the value of 1992 for the
years 1990/1991. The data on Aid per capita were not available for South Africa for the years 1990/1992 and those on Debt service for the years 1990/1993, here again just report the data available for the most recent year namely 1993 and 1994. Data on corruption and internal conflict were not available for some countries such as Benin, Burundi, Cabo Verde, Comoros, Lesotho, Mauritius, Rwanda and Swaziland. We excluded these countries from the sample for treatments on the whole Union and those of the individual member states except for that on Benin34.
3. Period
Estimations are done over the period 1990/2010. The pre-reform and post-reform periods differ between the type of tax and they have been chosen according to the issuing of Directives by the Commission of WAEMU35.
32. With such a restriction on the outcome lags, other covariates with predictive power for explaining the dependent variable receive positive weights in order to build the-now differently weighted-synthetic control unit (Kaul et al., 2016).
33. United Nations Conference on Trade and Development.
34. We assess the effects of Tax reforms in Benin without add corruption and internal conflict to the set of predictors. Table (3) and Table (4) in the appendix present the descriptive statistics respectively for the whole sample including Benin and those of the restrained sample.
About the domestic indirect tax, we define as first reform period the year following the issuing of first Value-added tax and excises Directives namely 1999. In this way, the pre-reform period is 1990-1998 and the post-reform period range from 1999 to 2010. Following Cavallo et al. (2013), Kaul et al. (2016), we didn’t include entire pre-reform path of the outcome variable as economic predictors to allow the synthetic control to replicate the counterfactual trajectory36. Thus, we include the period 1990/1994.
We define the year 1996 (knowing that corresponds to the adoption of a transitional trade regime regulating the intracommunity trade) as the starting of tariffs coordi-nation in WAEMU. Thereby the pre-reform period for this tax is 1990-1995 and the post-reform period 1996/2010 ; we use the period 1990/1992 outcome trend to match the affected country with the control countries.
Concerning the direct tax, we identify the year 2009 (that follows the issuing of the first direct tax coordination Directive in 2008). The pre-reform period for this tax is 1990-2008 and the post-reform period 2009/2010 ; we use the period 1999-2008 out-come’s trend to match the affected country with the control countries.
At last, for the overall tax, we define the reform period as that following the adoption of the first domestic tax Directive. In this way, it corresponds to that of the indirect tax. So, as for the domestic indirect tax, we use the period 1990-1994 outcome’s trend to match the affected country with the control countries.
4
Results
4.1 Fiscal Impact of the Tax Coordination in WAEMU
As explained in the previous section, we assess the effects of the tax coordination in WAEMU for the whole Union and for each member state independently. Results will be presented for the overall tax and for the different types of taxes. Overall, we find a significant impact of the harmonization process on the revenue mobilization.
4.1.1 Impact of the Tax Coordination on the overall tax revenue mobilization
As shown in figure 1 below, the tax revenue mobilization in the Union has been affected by the reforms undertaken by the member states. In fact, the predicted p-values (expressing the significance level of the tax reforms) are significant for the years 1999, 2000, 2005, 2006, 2007 and 201037. This means that the estimated effects for these years haven’t been observed
by chance at least at the 10% threshold. Concerning the statistical significance (expressed by the one-sided p-values) for the positive effects of the tax coordination, we don’t find a
implemented the law at least de jure. The real dates of reforms are unknown even if we know the statement of the adoption by countries in 2012 as explained earlier. This is the main limit of the study.
36. Kaul et al. (2016) show that including all pre-intervention values of the outcome as economic predictors implies that only the pre-treatment fit with respect to the variable of interest is optimized.
37. Recall that the restrained sample includes all WAEMU member states excepted Benin for whom the ICTD dataset doesn’t provide indicators of corruption and internal conflict.
positive effect even if the average level of the non-resource taxes to GDP increased from 10.34 to 12.88 in GDP percentage before and during the reform period38.This result is not
surprising, due to the fact that the WAEMU countries spelt out a tax transition in the pur-pose to reduce the share in revenue collection of the trade taxes toward less distortive taxes namely domestic taxation more favourable to the trade. In this way, one can argue that the main challenge for these countries was to stabilize the level of the tax revenue. Thereby, a deeper analysis by type of tax will be more relevant to assess the impact of the tax reforms. About the quality of the treatment itself, we obtained a e(avg-pre-rmspe-p)39 of 0.05 repre-senting the proportion of placebos that have a pretreatment Root Mean Squared Predictive Error (RMSPE) at least as large as the average of the treated unit. It is too low, this explains the lack of fit between the path of the overall tax outcome for the Union and its synthetic counterfactual in the pre-treatment period. 40
Figure 1 – Impact of Tax Reforms in WAEMU*
−.1 0 .1 .2 .3 Effect 1989 1994 1999 2004 2009 Year
Effect of the Overall tax reform
.8 1 1.2 1.4 1.6 1989 1994 1999 2004 2009 Year
Treated Synthetic Control WAEMU versus WAEMU Synthetic
0 .1 .2 .3 .4 .5 .6 .7 .8 .9 1
Probability that this would happen by Chance
99 00 01 02 03 04 05 06 07 08 09 10 Year Statistical significance 0 .1 .2 .3 .4 .5 .6 .7 .8 .9 1
Probability that this would happen by Chance
99 00 01 02 03 04 05 06 07 08 09 10 Year
Statistical significance (for positive effects)
Source: Authors’ Calculations
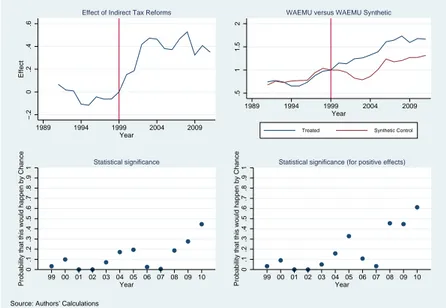
4.1.2 Impact of the Tax Coordination on the Domestic Indirect taxes
mobili-zation
We find a positive significant impact of the coordination for the first five post-reform years (1999/2003) as for the years 2006/200741. The lack of significance for the year 2008 may result from the measures (subsidies and exemptions) undertaken by some countries in response to the food and energy price crisis of 2006-2008 to head off and contain social unrests besides the presence of multiple rates VAT systems approved by the VAT Directives. A per country analysis will allow to have a clear and accurate view of the situation. Even if the domestic indirect tax coordination in WAEMU is criticised, some of its member states
38. See figure 5 in the appendix.
39. These statistics are available in Table 5 in the appendix. 40. WAEMU* = WAEMU without Benin.
are renowned to have a good value-added tax productivity. Brun and Diakité (2016) found a high value-added tax effort in WAEMU comparatively to some other developing areas. The quality of the treatment is better than those of the overall tax with a e(avg-pre-rmspe-p) of 0.79.
Figure 2 – Impact of Domestic Indirect Tax Reforms in WAEMU*
−.2 0 .2 .4 .6 Effect 1989 1994 1999 2004 2009 Year
Effect of Indirect Tax Reforms
.5 1 1.5 2 1989 1994 1999 2004 2009 Year
Treated Synthetic Control WAEMU versus WAEMU Synthetic
0 .1 .2 .3 .4 .5 .6 .7 .8 .9 1
Probability that this would happen by Chance 99 00 01 02 03 04 05 06 07 08 09 10Year
Statistical significance 0 .1 .2 .3 .4 .5 .6 .7 .8 .9 1
Probability that this would happen by Chance 99 00 01 02 03 04 05 06 07 08 09 10Year
Statistical significance (for positive effects)
Source: Authors’ Calculations
4.1.3 Impact of the Tax Coordination on the Direct taxes mobilization
The direct taxes coordination in WAEMU started in the year 2008 by the Directive N◦01/2008/CM/UEMOA defining a common corporate tax base. It does not seem to have affected the revenue mobilization (Figure 3). This is not surprising, given that the direct taxes’ Directives have not resolved the crucial problem of the tax exemptions granted by countries to attract the foreign direct investments. In fact, as said earlier, the WAEMU di-rect taxes’ Didi-rectives allow countries to adopt sectoral codes (mining, petroleum...) which could be used as tax competition instruments and they are, by this way, harmful to the coordination. The tax coordination framework may have had the unintended effect of contri-buting to the fragmentation of policies at the national level by providing countries with the incentive to enact special tax regimes outside their tax laws. This is particularly the case of investment incentives, where the framework allows unfettered tax competition as long as it is done outside countries’ main tax laws. This, in turn, has made tax systems opaque, increased their complexity, and contributed to a culture of "tax negotiation". (Mansour and Rota-Graziosi, 2013).
Figure 3 – Impact of Direct Tax Reforms in WAEMU* −.2 −.1 0 .1 .2 .3 Effect 1989 1994 1999 2004 2009 Year
Effect of Direct Tax Reforms
.4 .6 .8 1 1.2 1989 1994 1999 2004 2009 Year
Treated Synthetic Control WAEMU versus WAEMU Synthetic
0 .1 .2 .3 .4 .5 .6 .7 .8 .9 1
Probability that this would happen by Chance
2009 2010 Year Statistical significance 0 .1 .2 .3 .4 .5 .6 .7 .8 .9 1
Probability that this would happen by Chance
2009 2010
Year
Statistical significance (for positive effects)
Source: Authors’ Calculations
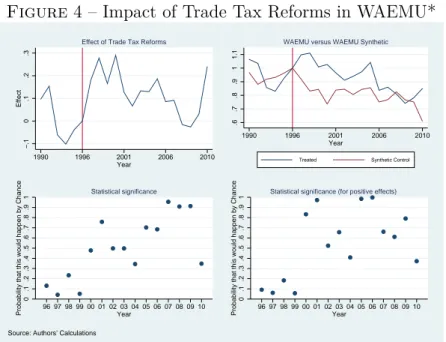
4.1.4 Impact of the Tax Coordination on the Trade taxes mobilization
Tariff reforms in WAEMU had a significant effect on trade taxes mobilization just for the first post-reform years. However, this result is not surprising. In fact, one could expect that the tariff reforms through liberalization leaded in a fall of the tariff revenues, but these revenues just ranged from 3.41 to 3.12 in GDP percentage in average from the pre-reform period to the post-reform period. This may be explained by the low share of intraregional trade in WAEMU42. In addition, the taxation of natural resources exports (such as that of
the single export tax on cocoa (DUS) by the Cote d’Ivoire) allows collection of an important tariff revenue namely for the periods of increasing in price and demand.
Here again,the proportion of placebos that have a pretreatment Root Mean Squared Predic-tive Error (RMSPE) at least as large as the average of the treated unit is high(97%) what is reassuring about the quality of the treatment.
42. The study of Goretti and Weisfeld (2008) shows that the share of intraregional trade in WAEMU was relatively stable at about 11 percent of total trade from 2000 through 2006.
Figure 4 – Impact of Trade Tax Reforms in WAEMU* −.1 0 .1 .2 .3 Effect 1990 1996 2001 2006 2010 Year
Effect of Trade Tax Reforms
.6 .7 .8 .9 1 1.1 1990 1996 2001 2006 2010 Year
Treated Synthetic Control WAEMU versus WAEMU Synthetic
0 .1 .2 .3 .4 .5 .6 .7 .8 .9 1
Probability that this would happen by Chance
96 97 98 99 00 01 02 03 04 05 06 07 08 09 10 Year Statistical significance 0 .1 .2 .3 .4 .5 .6 .7 .8 .9 1
Probability that this would happen by Chance
96 97 98 99 00 01 02 03 04 05 06 07 08 09 10 Year
Statistical significance (for positive effects)
Source: Authors’ Calculations
4.2 Individual Impacts of Tax Coordination in WAEMU
The WAEMU Treaty mandates the convergence of the ratio of tax revenue-to-GDP to the threshold of 20%43and the convergence of tax revenue structures. However, as shown in table
1 below (figures represent the average tax revenue for each member state after the adoption of the tax transition program), the tax coordination in WAEMU could have different effects on member states’ tax performance. First, because the level of coordination de jure and de facto is different between countries. Second, due to the fact that they differ in economic structure, natural endowment and in efficiency to mobilize revenue. So, an individual assessment of the effect of the tax coordination by country may be useful.
Table 1 – Average WAEMU member states tax revenue to GDP (2007/2010)
Country Direct Trade Indirect Non-resource Resource
Tax Tax Tax Tax Tax
Benin 3.76 5.06 7.98 16.80 0 Burkina Faso 3.07 2.10 6.89 12.27 0 Cote d’Ivoire 5.23 4.11 5.59 16.51 1.20 Guinea-Bissau 2.16 1.77 2.47 6.84 0 Mali 2.68 1.91 6.34 12.30 2.41 Niger 2.78 2.20 5.39 11.18 2.52 Senegal 4.62 3.05 9.88 18.32 0 Togo 3.69 3.81 7.31 15.54 0
Source : Mansour(2014) and authors’ calculations.
4.2.1 Impact of the Tax Coordination in Benin
Regarding the results displayed in figure 6 in the appendix, the tax reforms have not affected the overall tax revenue mobilization in Benin. However, it appears that the reform
had significant positive effects on the domestic indirect taxes collection from 2001 to 2003. As for the whole Union, there is no effect for the direct taxes revenue. An important point highlighted by the predictions is the fact that we observe an impact of the reforms on the trade tax collection in Benin just for the first post-reform year.This is probably due to the proximity of Benin with Nigeria. Benin has capitalized on its strategic geographical location with respect to Nigeria to improve its tariff revenue through re-exports. It is the only country where this source of revenue increased significantly since 1995 in tandem with an increase in VAT revenue. (Mansour and Rota-Graziosi, 2013).
The domestic indirect taxes- synthetic Benin corresponds to the convex combination of Uganda (59%), Guinea (30.10%), Botswana (10.6%) and Cabo Verde (0.3%).
4.2.2 Impact of the Tax Coordination in Burkina Faso
According to our estimation, there was no significant impact of the reforms on the overall tax collection. In fact, we predicted positive effects from 2001 to 2008 but they are not significant44. However, we obtain significant effects of the domestic indirect tax reforms for the years 2002 and 2004 and the effect is positive for the year 2002. The low significance of the domestic indirect tax reforms in Burkina Faso may be related to its value-added tax performance. Brun and Diakité (2015) studying the value-added tax gaps for a large sample of African countries, found that the VAT base of Burkina Faso is narrow due to the exemptions granted by the country. The share of exempted goods reached 64.16% for the year 2011. We find any significant impact of the tariff and direct tax reforms.
The domestic indirect taxes- synthetic Burkina Faso is the convex combination of Uganda (48.3%), Botswana (40.2%), Ethiopia (5.9%) and Sierra Leone (5.6%).
4.2.3 Impact of the Tax Coordination in Cote d’Ivoire
As for the two previous countries, we don’t observe an impact of the tax reforms on Cote d’Ivoire’s overall tax mobilization45. Even for the domestic indirect taxes revenue, we
find a significant impact just for the year 2005. The same case occurs for the direct taxes. The lack of significance for Cote d’Ivoire may be due at the same time to the de facto application of the Directives and to the misperformance of the country in terms of revenue mobilization. Having the higher tax potential in the Union46, Cote d’Ivoire as other resource depending countries, put less effort to collect tax namely value-added tax. The low VAT revenue productivity in Cote d’Ivoire is partly due to its high export share in GDP (oil, Cocoa and coffee)47. About the tariff reforms, they had significant effects on the revenue
mobilization along the post-reform period. The effects are positive for the years 1997 and 2004. The positive impact in 1997 may be related to the increase in cocoa price this year
44. See figure 7 in the appendix. 45. See figure 8 in the appendix.
46. Brun and Diakité (2016) estimated the non-resource potential of Cote d’Ivoire to 23.34 in GDP per-centage for the year 2010.
given that the Cote d’Ivoire taxes the cocoa exports as said earlier.
The domestic indirect taxes- synthetic Cote d’Ivoire corresponds to the convex combination of South Africa (68.1%) and Gambia (31.9%).
4.2.4 Impact of the Tax Coordination in Guinea Bissau
Guinea Bissau has not set the WAEMU tax reforms in a large extent. As said earlier, it is the only country in the Union whom has not adopted a value-added tax regime. The reforms that we are confident this country set, is the tariff reforms to be conform to the Customs Union requirements. We find any significant effect of the trade tax reforms. Having similar Direct taxes systems with the other WAEMU member states, we don’t observe a significant impact for the period following the reforms48.
The trade taxes- synthetic Guinea Bissau corresponds to the convex combination of Ethiopia (37%), Nigeria (30.4%), Sierra Leone (25.6%), Tanzania (4.7%) and Kenya (2.3%).
4.2.5 Impact of the Tax Coordination in Mali
Once again, We don’t find a significant impact of the reforms on the overall tax col-lection49. The domestic indirect tax reforms affected positively the revenue collection from
2002 to 2004. Following that period, we observe a relative decrease of the indirect taxes to GDP ratio and the same case occurs for the overall tax revenue given that the indirect taxes reached 43% of the overall tax revenue. Thus, the lack of significance for this post-reform period may be related to this fall in revenue collection. The latter is due to the measures (tax exemptions) undertaken by Mali in response to the food and energy price crisis of 2006-08. To contain the food price crisis, the government of Mali, in July 2007 granted VAT exemp-tion for powder milk and edible oil for two a two months’ period. Furthermore, in 2008, Mali exempted the rice importation (for VAT and trade taxes), (Diarra, 2013). Elsewhere, the reforms didn’t affect the direct tax and tariffs revenue collection.
The domestic indirect taxes- synthetic Mali corresponds to the convex combination of Ethio-pia (34.1%), Zambia (23.3%), Ghana (19.9%), Gambia(18.9%) and Nigeria (3.9%).
4.2.6 Impact of the Tax Coordination in Niger
Niger observed any effects of the tax reforms on its tax revenue mobilization even for the domestic indirect tax reforms50. This is not surprising, given that with Cote d’ivoire,
Niger has the less productive value-added tax in the Zone. Brun and Diakité (2015) found an effective VAT rate51 of 8.42% for Niger which is very low comparatively to a standard rate
of 19% for the year 2011. The exemption gap of the country reached to 60.86. The decrease in trade taxes mobilization and the misperformance of the Niger in terms of indirect taxes
48. See figure 9 in the appendix. 49. figure 10 in the appendix. 50. See figure 11 in the appendix.
51. It is the total burden of VAT expressed as a percentage of total final consumption (Borselli et al., 2012).
collection make necessary an improvement of the tax administration in Niger to achieve the tax transition.
The overall tax- synthetic Niger is the convex combination of Nigeria (41.5%), Ethiopia (35.2%), Gambia (15.4%) and Guinea (7.9%).
4.2.7 Impact of the Tax Coordination in Senegal
According to the predicted results, the tax reforms affected the revenue collection in Se-negal just for the domestic indirect taxes52. We find a statistical significance of the domestic indirect reforms throughout most of the post-reform period (2000/2010). The effects are po-sitive for the periods (2001/2003, 2005/2009). Senegal is known in having a productive tax system. Since 2004, it meets the convergence criteria mandated by the WAEMU Commission about the tax revenue-to-GDP ratio whom must reached at least 17%53, so one can conclude
that the country succeed its tax transition. Senegal’s revenue performance is impressive and almost entirely linked to the VAT and excises, which account for over 50 percent of tax revenue. Senegal seems to have progressed best in transiting from tariffs to domestic tax revenue. Mansour and Rota-Graziosi (2013).
The domestic indirect taxes- synthetic Senegal corresponds to the convex combination of Uganda (52.6%), Madagascar (15%), Mozambique (13.3%), South Africa (8%), Sierra Leone (6.8%) and Zambia (4.3%).
4.2.8 Impact of the Tax Coordination in Togo
As for the majority of WAEMU member states, we obtain a significant impact of the domestic indirect tax reforms on the revenue mobilization in Togo54. However, there is a significant effect just for the year 2007. Until 2010, Togo had not reached the convergence criteria of the WAEMU with a ratio of tax-revenue to GDP of 15.68 which is largely below of its non-resource tax potential predicted for the same year (20.62)55. About the direct tax
reforms’ effects, the same case encountered for the other WAEMU member states occurs, the reforms haven’t affected the direct taxes revenue mobilization. Tariff reforms affected signi-ficantly the revenue collection in Togo namely during the periods 1997/1998 and 2002/2004. The domestic indirect taxes- synthetic Togo corresponds to the convex combination of Ni-geria (54.9%), Botswana (36.7%) and Ethiopia (8.4%).
5
Robustness check
To check the robustness of our results, namely the significant impact of WAEMU tax re-forms on revenue mobilization, we conduct an additional analysis. In fact, we restrict the do-nor pool to countries having implemented Semi-Autonomous Revenue Authorities (SARA).
52. Figure 12 in the appendix.
53. The 2015 Additional Act N◦01/2015/CCEG/UEMOA increased this ratio at 20%. 54. Figure 13 in the appendix.
The idea behind that is to compare WAEMU countries with the most performing countries knowing that SARA are implemented by countries for revenue performance improvement purposes. The analysis is conducted for the overall tax reform and the domestic indirect tax reform independently given that the latter has proven successful according to the above results. We include countries where the Law on SARA implementation passed before the starting of the domestic indirect tax reforms in WAEMU. In this way, the control units are limited to Ethiopia, Kenya, Rwanda, South Africa, Tanzania, Uganda and Zambia56.
Fur-thermore, these countries having no borders with the WAEMU member states, this allows to limit spatial spillover effects occuring when countries adopt good practices of their neighbors and causing interpolation biases.
As shown in figure 14 in the appendix, through the restricted sample, we find a positive significant effect of the overall tax reform in WAEMU for the year 2003. This significant positive effect is found in the predictions of some countries such as Benin, Burkina Faso, Senegal and Togo. About the domestic indirect tax reforms, these additional estimations attest their positive effects on revenue mobilization (Figure 15). In fact, we find significant positive effects of the reform throughout most of the post-reform period (2000/2010) for the whole Union and it is the same for Senegal. The impact of the reform is significant for the other member states except Burkina Faso.
Overall, the significant impact of tax reforms in WAEMU, namely the domestic indirect tax reforms, has been affirmed through these additional analysis.
Conclusion
The purpose of this study was to assess the quantitative impact of the tax coordination in WAEMU. This has been realized through a comparative case study using the synthetic control method. We estimated the impact of the harmonization on the overall tax producti-vity and for the different types of tax. These results have been predicted for the whole Union and for each member state. We find that the harmonization of tax legislation affected the revenue mobilization in WAEMU. The effects are significant mainly for the domestic indi-rect tax reforms. In fact, we find that, the domestic indiindi-rect taxes revenue mobilization in a large number of WAEMU member states namely Benin, Burkina Faso, Cote d’Ivoire, Mali, Senegal and Togo (as for the whole Union) has been affected by the reforms and the effects are positive in general for the first years following the 1998 reforms. The impact of trade tax reforms is not obvious due to the low share of intraregional trade in the Union. About the direct tax coordination, it does not seem to have affected the revenue mobilization. This lack of significance is mainly due the exemption granted by countries in the sectoral codes to attract investments and these practices are approved in the WAEMU Community legis-lation on taxation. The domestic indirect tax mobilization is also affected by the granting of exemption causing the misperformance of countries such as Niger and Cote Ivoire which
56. We found information on SARA implementation in the study of Sarr(2016). This information is avai-lable in Table 7 in the appendix
evolved far from their potential. At last, we can state that the tax coordination in WAEMU has proven its worth namely concerning the domestic indirect taxation. However, a revision of the Community legislation to reinforce the convergence between national tax legislation and limiting the tax expenditures is required to allow countries to mobilize resources for financing development.
References
Abadie A., Diamond A. and Hainmueller J. (2015) "Comparative politics and the syn-thetic control method", American Journal of Political Science, 59(2) : 485-510.
Abadie A., Diamond A. and Hainmueller J. (2010) "Synthetic control methods for com-parative case studies : Estimating the effect of California’s tobacco control program", Journal
of the American Statistical Association, 105(490) : 493-505.
Abadie A. and Gardeazabal J. (2003) "The Economic Costs of Conflict : A Case Study of the Basque Country", American Economic Review, 93 : 113-132.
Abdallah C.S. and William D. L. (2012) "Home equity lending and retail spending : Evi-dence from a natural experiment in Texas", American Economic Journal : Macroeconomics 4(4) : 94-125.
Adhikari B. and Alm J. (2016) "Evaluating the Economic Effects of Flat Tax Reforms Using Synthetic Control Methods", Southern Economic Journal 2016, 83(2), 437-463.
Bauhoff S. (2014) "The effect of school district nutrition polities on dietary intake and overweight : A synthetic control approach", Economics and Human Biology 12(1) : 45-55.
Billmeier A. and Nannicini T. (2011) "Economies in transition : How important is trade openness for growth ?", Oxford Bulletin of Economics and Statistics, 73(3) : 287-314.
Billmeier A. and Nannicini T. (2013) "Assessing economic liberalization episodes : A syn-thetic control approach", The Review of Economics and Statistics, 95(4) : 983-1001.
Bohn S., Magnus L. and Steven R. (2014) "Did the 2007 Legal Arizona Workers Act reduce the state’s unauthorized immigrant population ?", The Review of Economics and Statistics, 96(2) : 258-69. weight : A synthetic control approach. Economics and Human Biology, 12(1) : 45-55.
Brun J.-F., Diakité M. (2016) "Tax Potential and Tax Effort : An Empirical Estimation for Non-Resource Tax Revenue and VAT’s Revenue", Études et Documents, n◦ 10, CERDI.
Brun J.-F. and Diakité M., (2015), "Vers un diagnostic approfondi de l’efficacité des systèmes de TVA des pays en développement", version presented at the first African Tax Research Network Annual Congress.
Cavallo E., Galiani S., Noy I. and Pantano J. (2013) "Catastrophic natural disasters and economic growth", The Review of Economics and Statistics, 95(5) : 1549-61.