HAL Id: hal-00301568
https://hal.archives-ouvertes.fr/hal-00301568
Submitted on 15 Dec 2004HAL is a multi-disciplinary open access
archive for the deposit and dissemination of sci-entific research documents, whether they are pub-lished or not. The documents may come from teaching and research institutions in France or abroad, or from public or private research centers.
L’archive ouverte pluridisciplinaire HAL, est destinée au dépôt et à la diffusion de documents scientifiques de niveau recherche, publiés ou non, émanant des établissements d’enseignement et de recherche français ou étrangers, des laboratoires publics ou privés.
Water vapour and ozone profiles in the midlatitude
upper troposphere
G. Vaughan, C. Cambridge, L. Dean, A. W. Phillips
To cite this version:
G. Vaughan, C. Cambridge, L. Dean, A. W. Phillips. Water vapour and ozone profiles in the mid-latitude upper troposphere. Atmospheric Chemistry and Physics Discussions, European Geosciences Union, 2004, 4 (6), pp.8357-8379. �hal-00301568�
ACPD
4, 8357–8379, 2004
Water vapour and ozone profiles G. Vaughan et al. Title Page Abstract Introduction Conclusions References Tables Figures J I J I Back Close
Full Screen / Esc
Print Version Interactive Discussion
EGU
Atmos. Chem. Phys. Discuss., 4, 8357–8379, 2004 www.atmos-chem-phys.org/acpd/4/8357/
SRef-ID: 1680-7375/acpd/2004-4-8357 European Geosciences Union
Atmospheric Chemistry and Physics Discussions
Water vapour and ozone profiles in the
midlatitude upper troposphere
G. Vaughan, C. Cambridge, L. Dean, and A. W. Phillips
Institute of Mathematical and Physical Sciences, University of Wales, Aberystwyth, UK Received: 16 September 2004 – Accepted: 8 October 2004 – Published: 15 December 2004 Correspondence to: G. Vaughan (gxv@aber.ac.uk)
ACPD
4, 8357–8379, 2004
Water vapour and ozone profiles G. Vaughan et al. Title Page Abstract Introduction Conclusions References Tables Figures J I J I Back Close
Full Screen / Esc
Print Version Interactive Discussion
EGU
Abstract
We present an investigation of upper tropospheric humidity profiles measured with a standard radiosonde, the Vaisala RS80-A, and a commercial frost-point hygrometer, the Snow White. Modifications to the Snow White, to enable the mirror reflectivity and Peltier cooling current to be monitored during flight, were found to be necessary
5
to determine when the instrument was functioning correctly; a further modification to prevent hydrometeors entering the inlet was also implemented. From 23 combined flights of an ozonesonde, radiosonde and Snow White between September 2001 and July 2002, clear agreement was found between the two humidity sensors, with a mean difference of <2% in relative humidity from 2 to 10 km, and 2.2% between 10 and
10
13 km. This agreement required a correction to the radiosonde humidity, as described by Miloshevich et al. (2001). Using this result, the dataset of 324 ozonesonde/RS80-A profiles measured from Aberystwyth between 1991 and 2002 was examined to derive statistics for the distribution of water vapour and ozone. Supersaturation with respect to ice was frequently seen at the higher levels – 24% of the time in winter between
15
8 and 10 km. The fairly uniform distribution of relative humidity persisted to 120% in winter, but decreased rapidly above 100% in summer.
1. Introduction
Measurements of water vapour in the upper troposphere are of vital importance to cli-mate research. Water vapour and cirrus clouds are the major influences on radiative
20
transfer in this region, and both present a formidable challenge to climate models. The water vapour concentration varies on scales of ∼1 km in altitude and 100 km in the horizontal, making it very difficult to measure from space. The standard instrument for measuring tropospheric water vapour is the radiosonde, but humidity measurements from radiosondes are traditionally viewed with suspicion above 500 mb. Although the
25
pre-ACPD
4, 8357–8379, 2004
Water vapour and ozone profiles G. Vaughan et al. Title Page Abstract Introduction Conclusions References Tables Figures J I J I Back Close
Full Screen / Esc
Print Version Interactive Discussion
EGU
decessors in the upper troposphere it still does not measure adequately in the strato-sphere, and it is not possible to tell from an archived radiosonde profile what kind of instrument was used to measure it. The MOZAIC humidity sensor is of this type, and is also unable to extend into the stratosphere (Helten et al., 1998).
One instrument considered to make reliable measurements of water vapour in the
5
upper troposphere and lower stratosphere is the NOAA/CMDL frost-point hygrometer (Mastenbrook, 1968; Oltmans, 1985), which is launched on a small balloon. According to SPARC (2000), around 320 of these instruments have been flown since the instru-ment was re-designed in 1980. This is sufficient for climatological studies in the lower stratosphere (e.g. Oltmans and Hofmann, 1995) but not in the upper troposphere where
10
water vapour is far more variable. There is therefore a need for a cheap and reliable instrument which can be used on sounding balloons in the upper troposphere to gain a reliable set of measurements on water vapour in the tropopause region. One pos-sible candidate is the Snow White frost-point hygrometer, a commercial device man-ufactured by Meteolabor, Switzerland. This does not have the dynamic range of the
15
NOAA/CMDL instrument (the manufacturer claims a minimum RH of 4% as the mea-surement limit) and so can not be used for stratospheric meamea-surements, but it does hold out promise of accurate upper tropospheric measurements. We report here on a study to evaluate the ASW33 version of the Snow White under normal midlatitude conditions, flown on balloon-borne packages together with a Vaisala RS80 radiosonde
20
and ECC ozonesonde from Aberystwyth, UK (52.4◦N, 4.06◦W).
A number of different humidity sensors are available for Vaisala radiosondes: the A and H type Humicap sensors for the RS80 and modified versions of the H type for the RS90 series. They are basically capacitive sensors, with a polymer electrode sensitive to relative humidity; the manufacturer’s claimed accuracy is 3% in RH with
25
resolution 1% in RH. The A type responds more slowly than the H type and suffers from a systematic error at low temperatures; however, this error arises from the calibration model for the sensor, and can be removed by applying a correction (Miloshevich et al., 2001).
ACPD
4, 8357–8379, 2004
Water vapour and ozone profiles G. Vaughan et al. Title Page Abstract Introduction Conclusions References Tables Figures J I J I Back Close
Full Screen / Esc
Print Version Interactive Discussion
EGU
There have been a number of studies reporting on the ability of the Snow White to measure tropospheric profiles. Fujiwara et al. (2003) reported on simultaneous measurements with Vaisala radiosondes at a number of tropical locations during the SOWER (Soundings of Ozone and Water in the Equatorial Region) campaign. They conducted 22 soundings with A-type Humicaps and 32 with H-type humicaps. Two
5
problems were identified with the Snow White: the freezing level of the deposit on the mirror (see below), and dry layers where the Peltier cooler was unable to reach the frost point. Removing these from the data, good overall agreement was found with the H type sondes up to 14 km altitude (∼−65◦C), although the scatter between them increased with altitude as the response time of the radiosonde increased. For the A
10
type sensors the agreement was poor. At low altitudes a dry bias was discovered in the radiosonde sensors which the authors could not explain, while at high altitudes the dry bias was consistent with that reported by Miloshevich et al. (2001). The Snow White and A type sondes agreed well at temperatures below −20◦C when this bias was removed.
15
A further study by the same group, reported by V ¨omel et al. (2003), considered the performance of the Snow White at very cold temperatures by comparison with NOAA/CMDL frost point hygrometers. They encountered a problem with the Snow White being unable to recover the frost point when it passed through a very dry layer and the deposit on the mirror evaporated. Their estimate of the lower limit for relative
20
humidity was around 6%, rising to 9% at −80◦C – a little worse than the manufac-turer’s claim. Agreement with the NOAA/CMDL hygrometer up to the tropopause was variable – some cases agreed to a few % RH throughout the profile, whereas others showed marked discrepancies. They concluded that shallow dry layers can disrupt the operation of the instrument at low temperatures.
25
Vance et al. (2004) presented a comparison of aircraft, RS80-H, RS90 and Snow White measurements in the Arctic and tropics. They reported good agreement be-tween the RS80-H, RS90 and aircraft instruments, but report a ‘wet bias’ for the Snow White. This is almost certainly due to contamination affecting the sondes; Peltier
cur-ACPD
4, 8357–8379, 2004
Water vapour and ozone profiles G. Vaughan et al. Title Page Abstract Introduction Conclusions References Tables Figures J I J I Back Close
Full Screen / Esc
Print Version Interactive Discussion
EGU
rent and phototransistor output were not monitored on these flights making it very dif-ficult to discard erroneous points. Some age-related dry bias due to contamination of the H humicaps was also observed. It is clear therefore that more work is needed to understand fully the operation of current humidity sensors in different atmospheric conditions.
5
2. Instruments
The Snow White hygrometer has dimensions 21×21×10 cm and weighs around 400 g. It does not require any special preparation prior to launch and is therefore suitable for use at normal radiosonde or ozonesonde stations. At the heart of the device is a Peltier cooler to chill a copper-constantan thermocouple, which serves as the mirror
10
and temperature sensor together. Light is reflected from the mirror and detected via an optical fibre by a phototransistor; a control circuit then attempts to maintain the phototransistor signal at a constant level, corresponding to a constant deposit on the mirror. The manufacturer claims a mirror temperature accuracy of 0.1 K and a minimum detectable RH of 4% (at low levels) – 8% (in the cold upper troposphere). The accuracy
15
in RH of these devices is an open question (Fujiwara et al., 2003).
For the ASW33 daytime version of the Snow White used here, the instrument is en-cased in a polystyrene box to shield the mirror from sunlight, and a channel is provided from the top of the box to bring air to the sensor. Ascent of the balloon forces air to flow through the channel. During early tests of the Snow White we found that the instrument
20
was extremely sensitive to contamination, and designed a cover to shield the inlet from the direct ingress of hydrometeors; this was a metal plate placed a few mm above the inlet. The incoming air is heated near to the mirror to prevent icing of the hygrometer, and indeed the manufacturer claims that this enables it to measure total water content, but we did not test this claim. At low levels in the troposphere (for mirror temperatures
25
>−25◦C) the deposit on the mirror can be liquid or solid, so there is an ambiguity as to whether the instrument is measuring the frost point or dew point. At the altitudes
ACPD
4, 8357–8379, 2004
Water vapour and ozone profiles G. Vaughan et al. Title Page Abstract Introduction Conclusions References Tables Figures J I J I Back Close
Full Screen / Esc
Print Version Interactive Discussion
EGU
of interest in this paper the deposit is always frozen so the instrument measures frost point. Both the Snow White and Vaisala software provide relative humidity with respect to water, even at temperatures where water does not exist. We have converted all these values to relative humidity with respect to ice using an analogous form of the Goff-Gratch formula.
5
All the flights described in Sect. 3 were conducted with a Snow White, an ECC ozonesonde and a Vaisala RS80 radiosonde with an A type Humicap sensor. A TMAX-C interface card was used to collect the data from the different sensors for telemetry to the ground. Four outputs were provided from the Snow White: a reference thermistor and thermocouple voltage, from which the dew point could be calculated, and two
10
“housekeeping” channels – the Peltier current and the phototransistor output. These were both used to monitor the operation of the device and eliminate periods when the deposit on the mirror was not stable. All the radiosonde humidity profiles have been corrected according to the formula of Miloshevich et al. (2001), and converted to relative humidity with respect to ice.
15
3. Measured humidity profiles
Fifty combined packages were flown in all, but the first 24 did not measure the Peltier current and phototransistor voltage. On some of these flights clear contamination prob-lems were seen after passage through cloud layers, which led to the cover being de-signed for the inlet. Battery problems were also encountered with these early flights,
20
which required us to include more powerful 1.5V batteries in the sondes. Following all the modifications, 25 flights were conducted between September 2001 and July 2002, 23 of which are included in this analysis. Very noisy data affected one of the discarded flights, and an electronic malfunction affected the other. All flights were conducted dur-ing daylight hours, into clear skies or medium/high cloud; none was launched into rain
25
ACPD
4, 8357–8379, 2004
Water vapour and ozone profiles G. Vaughan et al. Title Page Abstract Introduction Conclusions References Tables Figures J I J I Back Close
Full Screen / Esc
Print Version Interactive Discussion
EGU
Two examples of flights are shown in Figs. 1 and 2. On the first flight, the sonde encountered a dry layer at 4 km where the phototransistor output clearly shows that the deposit on the mirror was not stable. This persisted until about 6 km, when the phototransistor recovered and there was agreement with the radiosonde up to 10 km. Note however that the two instruments measured similar relative humidities
5
even when the mirror deposit was not stable. Above 10 km the Snow White recorded a number of narrow moist layers which the radiosonde could not resolve. However, around the tropopause the performance of the two sensors diverged markedly. The ozone tropopause (Bethan et al., 1996) was at 11.2 km, and the thermal tropopause at 11.6 km. Both sensors continued to observe high humidity for 1–2 km above the
10
tropopause, but the radiosonde fell to zero by 13 km. By contrast, the Snow White continued to show appreciable humidity above 13 km. Eventually, the phototransistor output increased, but there was no obvious response of the sensor as at the lower levels.
Recovery of the Snow White at lower levels after passage through a dry layer was
ob-15
served on nine of the 23 flights; indeed this could sometimes be dramatic (Fig. 2). Over-reading in the stratosphere was seen on all the flights (and is also reported by Fujiwara et al., 2003) but although the phototransistor output increases above the tropopause there is no sudden loss of deposit on the mirror as at the lower levels. Laboratory tests introducing dry nitrogen into a sensor produced a rapid and repeatable response,
20
so we are led to conclude that the sensor is contaminated by transport through the troposphere and gradually recovers as it rises though the stratosphere.
On occasion a more obvious contamination was seen; an example is shown in Fig. 3. Here the sensors ascended into cloud: both humidity sensors show RHi ce>100%
above 5 km, and the Snow White reads very high values above 10 km. This is an
25
example of cloud contamination, from which the sensor does not recover even in the stratosphere, the phototransistor output remaining normal up to 18 km. This sort of be-haviour was typical of flights where the Snow White exceeded 120% for a layer more than 0.5 km thick, which we take to indicate cloud. We therefore conclude that the
ACPD
4, 8357–8379, 2004
Water vapour and ozone profiles G. Vaughan et al. Title Page Abstract Introduction Conclusions References Tables Figures J I J I Back Close
Full Screen / Esc
Print Version Interactive Discussion
EGU
Snow White becomes contaminated in thick cloud (at any height) and cannot mea-sure reliably above that point. Note that in Fig. 3 the radiosonde also shows signs of cloud contamination, reading non-zero values in the stratosphere. This in fact is a fairly unusual occurrence – on most flights the radiosonde measured zero humidity in the stratosphere – allowing a contaminated radiosonde profile to be readily identified.
5
The main conclusion of this study is the A type Humicap performs better in the upper troposphere than the Snow White, provided the Miloshevich et al. (2001) correction is applied. The response time of the Humicap means that it cannot detect thin layers, and it overestimates the humidity going into the stratosphere, but there are fewer problems with contamination, other than the occasional complete icing of the sensor in
super-10
cooled low cloud which is very easy to identify (and which has led to the dual-sensor concept of the RS90 humidity sensor).
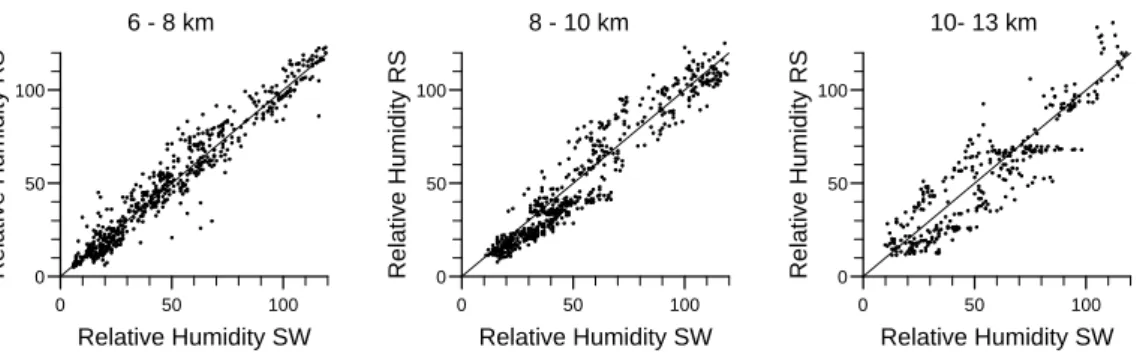
To illustrate the removal of the dry bias in the Humicap A by the Miloshevich et al. (2001) correction, we present in Fig. 4 scatter plots between the Snow White and RS80 for the 23 flights, grouped into altitude bins. Each profile was examined for
15
cloud contamination of the Snow White (identified by supersaturation wrt ice on the radiosonde sensor and very high RH recorded by the Snow White) and data above this height discarded. Data for which RHRS80<5% were also discarded; this removed
dry layers in the troposphere (where the Snow White mirror loses its deposit) and the stratosphere but retained points where the Snow White deposit was recovering after
20
passage through a dry layer (Fig. 1). Figure 4 shows overall agreement between the two sensors, emphasised by Table 1, which shows the average difference between them over the three altitude bins. Note however that the scatter increases significantly with altitude, and the analysis of sections 4 and 5 suggest that the radiosonde mea-surements are of doubtful quality above 10 km.
ACPD
4, 8357–8379, 2004
Water vapour and ozone profiles G. Vaughan et al. Title Page Abstract Introduction Conclusions References Tables Figures J I J I Back Close
Full Screen / Esc
Print Version Interactive Discussion
EGU
4. Correlation between water vapour and ozone
Following the conclusion of the previous section, that the RS80A provides a measure-ment of upper tropospheric humidity at least as reliable as the Snow White, we can now examine the distribution of ozone and water vapour in the tropopause region using a much larger database. Between December 1991 and January 2003, 324 ozonesonde
5
packages were flown from Aberystwyth, the majority in winter in support of the Euro-pean Stratospheric ozone programme. All the flights used an RS80A humidity sensor and an ECC-type ozonesonde (Science Pump types 5A or 6A, or EnSci-Z), and all were prepared and calibrated in the same way (using a standard Vaisala ground check sta-tion for humidity and standard ozonesonde preparasta-tion procedures). The ozonesonde
10
and radiosonde were coupled using TMAX-H interface cards. We now examine this database for the distribution of upper tropospheric water vapour and its correlation with ozone.
All profiles were first visually examined for evidence of sensor malfunction or icing of the humidity sensor at low levels; such profiles were discarded. Points above the
15
last maximum in relative humidity were discarded; this avoids including points in the stratosphere where the sensor’s slow response indicates a false humidity value. We do not consider in this paper errors in the ozonesonde as the ECC is considered accurate to 5% in the lower stratosphere and 6–13% in the troposphere (Komhyr et al., 1995). (The ozone data used here were analysed with a height-varying background current).
20
Scatter plots of the ozone and water vapour mixing ratios coloured according to the ambient temperature are shown in Fig. 5, for three altitude ranges and for winter and summer separately. Below 10 km the four distributions presented are reasonably con-sistent. They show a fairly consistent relationship for tropospheric values of ozone (<120 ppbv), with ozone decreasing with increasing humidity. This is consistent with
25
the chemistry and meteorology of tropospheric ozone, in that ozone is chemically de-stroyed through the reaction O(1D)+H2O→2OH, and has its main source region in the dry stratosphere (particularly in winter). For higher (stratospheric) values of ozone, a
ACPD
4, 8357–8379, 2004
Water vapour and ozone profiles G. Vaughan et al. Title Page Abstract Introduction Conclusions References Tables Figures J I J I Back Close
Full Screen / Esc
Print Version Interactive Discussion
EGU
much steeper anticorrelation and less compact relationship is evident.
This pattern is also seen in the summer 10–13 km data, but in winter at the higher altitudes there are many points with extremely low humidity (<8 ppmv) which coincide with tropospheric values of ozone. These invariably correspond to very low tempera-tures (<−70◦C). Such measurements indicate the limitations of the radiosonde sensor.
5
From this dataset we infer that radiosonde humidity values should be considered un-reliable below −70◦C and used with caution between −65◦C and −70◦C. These top panels also help to answer the question of the detection limit of the radiosonde sensor: the virtual absence of a correlation between ozone and humidity suggesting that the sensor cannot be assumed to measure reliably below 50 ppmv.
10
5. Distribution of humidity values in the upper troposphere
We now present probability distributions of humidity, based on the ozonesonde/radiosonde dataset. Because of the doubt about the accuracy of humidity measurements in the stratosphere we confine this section to the upper troposphere, defined as the region where ozone mixing ratio <120 ppbv. An ozone,
15
rather than a thermal tropopause was chosen for this criterion because it is easier to implement and generally less ambiguous, especially in cyclonic conditions (Bethan et al., 1996). It is also more conservative, since the ozone tropopause is usually below its thermal counterpart, and automatically excludes tropopause folds where the humidity sensor’s response time can cause a problem.
20
Probability distributions of the relative humidity with respect to ice from the present data are shown in Fig. 6 for 6–8 km and 8–10 km. These panels have been derived from all the humidity measurements coinciding with <120 ppbv of ozone and tempera-ture >−70◦C, excluding those points above the highest maximum in relative humidity, as explained above. Experiments were conducted relaxing these last two assumptions,
25
and also excluding points with a mixing ratio <50 ppmv of water vapour, following the results of the preceding section. The probability distributions shown proved insensitive
ACPD
4, 8357–8379, 2004
Water vapour and ozone profiles G. Vaughan et al. Title Page Abstract Introduction Conclusions References Tables Figures J I J I Back Close
Full Screen / Esc
Print Version Interactive Discussion
EGU
to these changes, and so we believe them to be correct representations of the atmo-sphere around Aberystwyth (the greatest change was in winter in the 8–10 km range, where the slope in probability between 20 and 100% was reversed). By contrast, the probability distribution for the height range 10–13 km proved much more sensitive to these changes, so much so that we do not consider that this distribution can be reliably
5
derived from the data.
Supersaturation with respect to ice was encountered on a significant number of occa-sions, becoming more frequent with altitude and more common in winter than summer (Table 2). Significantly, the RH with respect to liquid water was always ≤101%, indi-cating that the removal of profiles where the sensor was contaminated was successful.
10
These results may be compared with those of Spichtinger et al. (2003), who applied a similar analysis to one year’s radiosonde data from Lindenberg, Germany. They considered points above 600 mb where T<−30◦C, and found monthly frequencies of occurrence of ice-supersaturated layers ranging from 13% to 44%. Their data are con-sistent with an autumn/ winter maximum although their 1-year sample is too small to
15
show it clearly. They also present their data as a function of altitude with respect to the tropopause, finding an increasing occurrence of supersaturation with height up to ∼70 mb below the tropopause and decreasing occurrence thereafter. This is consistent with the distribution in Table 2 since the data presented here extend only up to 10 km.
Also comparable with the data presented here is the study of Gierens et al. (1999),
20
based on three years of data obtained with the MOZAIC humidity sensor (Marenco et al., 1998) in the range 175–275 mb. As in this study they divided their dataset into tropospheric and stratospheric parts using the MOZAIC ozone sensor; the threshold used was 130 ppbv. They found a far lower occurrence of supersaturation than we do: 13.5% overall with a maximum of 21.8% in autumn and minimum of 8.7% in summer.
25
However, the MOZAIC results are averages over diverse geographical regions and are not immediately comparable with a single station. Indeed, Gierens et al. (2000) show a much higher incidence of supersaturation in the European region at 250 mb than elsewhere (>20% over the UK) and Spichtinger et al. (2003), quoting from the same
ACPD
4, 8357–8379, 2004
Water vapour and ozone profiles G. Vaughan et al. Title Page Abstract Introduction Conclusions References Tables Figures J I J I Back Close
Full Screen / Esc
Print Version Interactive Discussion
EGU
dataset, give a probability of 26% of finding a supersaturated layer over Lindenberg. As we point out above, the present dataset cannot be used reliably above 10 km but the values in Table 2 are not obviously inconsistent with the results at 250 mb.
Also derived by Gierens et al. (1999) is a particular probability distribution function for upper tropospheric RH, with a fairly constant probability between 20 and 100% (wrt ice)
5
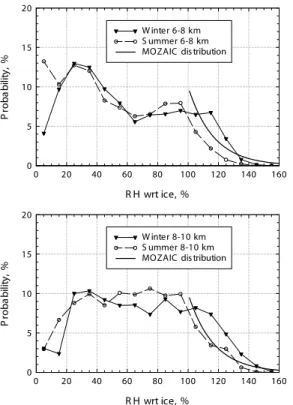
and an exponential distribution thereafter, with coefficient b∼0.06 (P∝exp(-bS) where S=RH−100%). Probability distributions of the relative humidity with respect to ice from the present data are shown in Fig. 6, with a curve based on the MOZAIC equation for comparison. The summer data between 8 and 10 km are consistent with MOZAIC – the distribution between 20 and 100% is fairly constant and that beyond 100% is
remark-10
ably consistent with the exponential curve. However, the same is not true of winter: the probability of supersaturation does not begin to decrease substantially until 120%. Spichtinger et al. (2003) carried out the same analysis with the Lindenberg radiosonde data, finding a bulge in probability near 100% RH. They claim that the MOZAIC data were cloud-cleared (although Gierens et al., 1999 do not actually say this) and attribute
15
their bulge to the presence of clouds. Without coincident cloud measurements we can-not verify whether this is the case for the present data, although the generally higher RH in winter is consistent with more frequent cirrus clouds than in summer.
For the 6–8 km altitude range the probability distribution beyond 100% follows the same pattern as the higher layer, but there is now a definite preponderance of dry air,
20
especially in summer. This indicates a preponderance of subsiding air in this midtro-pospheric height range.
6. Conclusions
We have examined humidity profiles measured by Snow White hygrometers and Vaisala RS80 radiosondes launched together with ozonesondes from Aberystwyth,
25
Wales during the period 1991–2003. Clouds (both low and high) are the norm at this coastal station so this study complements other investigations of this topic at tropical
ACPD
4, 8357–8379, 2004
Water vapour and ozone profiles G. Vaughan et al. Title Page Abstract Introduction Conclusions References Tables Figures J I J I Back Close
Full Screen / Esc
Print Version Interactive Discussion
EGU
or continental stations. The conclusions fall into three parts:
1. Based on 23 joint flights of a Snow White ASW-33 and RS80A hygrometers, we conclude that relative humidity measurements from the two sensors agree to within the margin of error when averaged over the whole sample, provided the Miloshevich et al. (2001) correction was applied to the radiosonde data.
De-5
spite our efforts to shield the Snow White inlet from ingress of hydrometeors we found that this instrument is very susceptible to contamination and is effectively unusable after passage through thick cloud. Stratospheric measurements seem to suffer from the same problem, since the phototransistor output did not show a sharp change at the tropopause as would be expected from a properly-functioning
10
hygrometer. Dry layers in the troposphere, however, did result in loss of mirror deposit as would be expected from the manufacturer’s specification. The Snow White did show a faster response time than the radiosonde at the higher levels, al-lowing it to delineate wet and dry layers above 10 km. By contrast, the radiosonde sensor is relatively unaffected by contamination – the main exceptions being total
15
icing of the sensor during passage through low-level supercooled cloud and occa-sional icing in thick cirrus. Such occurrences are rare and easily identified in the data. The greatest drawback with the radiosonde sensor is not its absolute accu-racy but the slow response time near the tropopause, which means that care must be exercised in interpreting the scatter plots of ozone and humidity presented in
20
fig. 5.
2. Using 324 ozonesonde/RS80 ascents from Aberystwyth and the result that the RS80A profiles are basically reliable if a standard correction is applied, the perfor-mance of this sensor can be investigated for a wider range of conditions than in a). Below 10 km, and for tropospheric values of ozone, ozone and absolute humidity
25
show a reasonably consistent relationship with a negative correlation. The ra-diosonde appears to be able to measure humidity values down to 50 ppbv. Above 10 km the performance clearly deteriorates, especially at temperatures <−70◦C
ACPD
4, 8357–8379, 2004
Water vapour and ozone profiles G. Vaughan et al. Title Page Abstract Introduction Conclusions References Tables Figures J I J I Back Close
Full Screen / Esc
Print Version Interactive Discussion
EGU
where the sensor reports unphysically low humidity in air with tropospheric values of ozone.
3. Using those humidity measurements from the radiosondes which appear reliable in b), the statistical distribution of relative humidity with respect to ice in the upper troposphere (defined by an ozone mixing ratio <120 ppbv) has been derived. In
5
the mid-troposphere (6–8 km) both the winter and summer distributions show a peak at 20–30% RH, while between 8 and 10 km there is a constant probability distribution between 20 and 100%. In both height ranges the summer distribution shows an exponential decay in probability beyond 100% RH, consistent with the results of Gierens et al. (1999) but for winter this is not observed, possibly because
10
of the greater incidence of cloud then.
Acknowledgement. We thank the Natural Environment Research Council (UTLS thematic pro-gramme) for supporting this work.
References
Bethan, S., Vaughan, G., and Reid, S. J.: A comparison of ozone and thermal tropopause
15
heights and the impact of tropopause definition on quantifying the ozone content of the tro-posphere, Quart. J. Roy. Met. Soc., 122, 929–944, 1996.
Fujiwara, M., Shiotani, M., Hasebe, F., V ¨omel, H., Oltmans, S. J., Ruppert, P. W., Horinouchi, T., and Tsuda, T.: Performance of the Meteolabor “Snow White” chilled-mirror hygrometer in the tropical troposphere: Comparisons with the Vaisala RS80 A/H-Humicap sensors, J.
20
Atmos. Ocean. Technol., 20, 1534–1542, 2003.
Gierens, K., Schumann, U., Helten, M., Smit, H., and Marenco, A.: A distribution law for rel-ative humidity in the upper troposphere and lower stratosphere derived from three years of MOZAIC measurements, Ann. Geophys., 17, 1218–1226, 1999,
SRef-ID: 1432-0576/ag/1999-17-1218.
25
Gierens, K., Schumann, U., Helten, M., Smit, H., and Wang, P-H.: Ice-supersaturated regions and subvisible cirrus in the northern midlatitude upper troposphere, J. Geophys. Res., 105, 22 743–22 753, 2000.
ACPD
4, 8357–8379, 2004
Water vapour and ozone profiles G. Vaughan et al. Title Page Abstract Introduction Conclusions References Tables Figures J I J I Back Close
Full Screen / Esc
Print Version Interactive Discussion
EGU
Helten, M., Smit, H. G. J., Str ¨ater, W., Kley, D., Z ¨oger, M., Busen, R., and Nedelec P.: Calibra-tion and performance of automatic compact instrumentaCalibra-tion for the measurement of relative humidity from passenger aircraft, J. Geophys. Res., 103, 25 643–25 652, 1998.
Komhyr, W. D., Barnes, R. A., Brothers, G. B., Lathrop, J. A., and Opperman, D. P.: Electro-chemical concentration cell performance evaluation during STOIC, J. Geophys. Res., 100,
5
9231–9244, 1995.
Marenco, A., Thouret, V., Nedelec, P., Smit, H. G., Helten, M., Kley, D., Karcher, F., Simon, P., Law, K., Pyle, J., Poschmann, G., Von Wrede, R., Hume, C., and T. Cook: Measurement of ozone and water vapour by Airbus in-service aircraft: The MOZAIC airborne program, An overview, J. Geophys. Res., 103, 25 631–25 642, 1998.
10
Mastenbrook, H. J.: Water vapor distribution in the stratosphere and high troposphere, J. At-mos. Sci., 25, 299–311, 1968.
Miloshevich, L. M., V ¨omel, H., Paukkunen, A., Heymsfield, A. J., and Oltmans, S. J.: Character-ization and correction of relative humidity measurements from Vaisala RS80-A radiosondes at cold temperatures, J. Atmos. Ocean Tech., 18, 135–156, 2001.
15
Oltmans, S. J.: Measurements of water vapor in the stratosphere with a frost point hygrometer, in: Measurement Control in Science and Industry, Proc. 1985 International symposium on moisture and humidity, Washington D.C., Instrument Society of America, 251–258, 1985. Oltmans, S. J. and Hofmann, D. J.: Increase in lower stratospheric water vapour at a
mid-latitude Northern Hemisphere site from 1981 to 1994, Nature, 374, 146–149, 1995.
20
SPARC: Assessment of upper tropospheric and lower stratospheric water vapour, SPARC re-port no. 2, 2000
Spichtinger, P., Gierens, K., Leiterer, U., and Dier, H.: Ice supersaturation in the tropopause region over Lindenberg, Germany, Meteorologische Zeitschrift, 12, 134–56, 2003.
Vance, A. K., Taylor, J. P., Hewison, T. J. and Elms, J.: Comparison of in situ data from aircraft,
25
dropsonde and radiosonde, J. Atmos. Ocean. Tech., 21, 921–932, 2004.
V ¨omel, H., Fujiwara, M., Shiotani, M., Hasebe, F., Oltmans, S. J., and Barnes, J. E.: The behaviour of the Snow White chilled-mirror hygrometer in extremely dry conditions, J. Atmos. Ocean. Tech., 20, 1560–1567, 2003.
ACPD
4, 8357–8379, 2004
Water vapour and ozone profiles G. Vaughan et al. Title Page Abstract Introduction Conclusions References Tables Figures J I J I Back Close
Full Screen / Esc
Print Version Interactive Discussion
EGU
Table 1. Average difference between Snow White and RS80-A humidity (SW-RS80). Altitude Range, km Mean difference, %RH Standard Error in Mean, %RH
6–8 −1.3 1.0
8–10 1.0 1.7
ACPD
4, 8357–8379, 2004
Water vapour and ozone profiles G. Vaughan et al. Title Page Abstract Introduction Conclusions References Tables Figures J I J I Back Close
Full Screen / Esc
Print Version Interactive Discussion
EGU
Table 2. Probability of supersaturation w.r.t. ice.
Height range, km Autumn/Winter (Oct.–Mar.) Spring/Summer (Apr.–Sept.)
6–8 0.182 0.082
ACPD
4, 8357–8379, 2004
Water vapour and ozone profiles G. Vaughan et al. Title Page Abstract Introduction Conclusions References Tables Figures J I J I Back Close
Full Screen / Esc
Print Version Interactive Discussion EGU 0 1 2 3 4 5 6 7 8 9 10 11 12 13 14 15 16 17 18 Altitude (km) 0 1 2 3 4 5 6 7 8 9 10 11 12 13 14 15 16 17 18 0 20 40 60 80 100 120 140 Relative Humidity (%) (bold=S-W) -80 -70 -60 -50 -40 -30 -20 -10 0 10 20 Temperature (o C) ---0 200 400 600 800 1000 1200 Ozone (ppbv) ... 0 1 2 3 4 5 6 7 8 9 10 11 12 13 14 15 16 17 18 Altitude (km) 0 1 2 3 4 5 6 7 8 9 10 11 12 13 14 15 16 17 18 1 2 3 4 log10(H2O) (ppmv)(bold=S-W) -80 -70 -60 -50 -40 -30 -20 -10 0 10 20 Temperature (o C) ---0 200 400 600 800 1000 1200 Ozone (ppbv) ...
Fig. 1. Profile measured at 16:20 UT, 11/12/2001. Dark blue: Snow white; light blue: RS80, shown as relative humidity with respect to ice on the left panel and mixing ratio on the right panel. On both panels green denotes temperature,◦C; orange: Snow White dew point,◦C; black: ozone, ppbv and magenta: phototransistor output, with 0–5 V is scaled to 0–20◦C.
ACPD
4, 8357–8379, 2004
Water vapour and ozone profiles G. Vaughan et al. Title Page Abstract Introduction Conclusions References Tables Figures J I J I Back Close
Full Screen / Esc
Print Version Interactive Discussion EGU 0 1 2 3 4 5 6 7 8 9 10 11 12 13 14 15 16 17 18 Altitude (km) 0 1 2 3 4 5 6 7 8 9 10 11 12 13 14 15 16 17 18 0 20 40 60 80 100 120 140 Relative Humidity (%) (bold=S-W) -80 -70 -60 -50 -40 -30 -20 -10 0 10 20 Temperature (o C) ---0 200 400 600 800 1000 1200 Ozone (ppbv) ... 0 1 2 3 4 5 6 7 8 9 10 11 12 13 14 15 16 17 18 Altitude (km) 0 1 2 3 4 5 6 7 8 9 10 11 12 13 14 15 16 17 18 1 2 3 4 log10(H2O) (ppmv)(bold=S-W) -80 -70 -60 -50 -40 -30 -20 -10 0 10 20 Temperature (o C) ---0 200 400 600 800 1000 1200 Ozone (ppbv) ...
ACPD
4, 8357–8379, 2004
Water vapour and ozone profiles G. Vaughan et al. Title Page Abstract Introduction Conclusions References Tables Figures J I J I Back Close
Full Screen / Esc
Print Version Interactive Discussion EGU 6 - 8 km 0 50 100 Relative Humidity SW 0 50 100 Relative Humidity RS 8 - 10 km 0 50 100 Relative Humidity SW 0 50 100 Relative Humidity RS 10- 13 km 0 50 100 Relative Humidity SW 0 50 100 Relative Humidity RS
Fig. 4. Scatter plots of relative humidity from the two sensors, over the 23 flights, grouped into altitude bins.
ACPD
4, 8357–8379, 2004
Water vapour and ozone profiles G. Vaughan et al. Title Page Abstract Introduction Conclusions References Tables Figures J I J I Back Close
Full Screen / Esc
Print Version Interactive Discussion EGU Winter 6-8 km 100 1000 Humidity, ppmv 0 100 200 Ozone, ppbv Winter 8-10 km 10 100 1000 Humidity, ppmv 0 150 300 Ozone, ppbv Winter 10-13 km 5 10 50 100 500 Humidity, ppmv 0 300 600 Ozone, ppbv Summer 6-8 km 100 1000 Humidity, ppmv 0 100 200 Ozone, ppbv Summer 8-10 km 10 100 1000 Humidity, ppmv 0 150 300 Ozone, ppbv Summer 10-13 km 5 10 50 100 500 Humidity, ppmv 0 300 600 Ozone, ppbv -70 -65 -60 -55 -50 -45 -40 -35 -30 -25 Temperature, degC
Fig. 5. Scatter plots of ozone and water vapour mixing ratio, measured by ozonesondes from Aberystwyth.
ACPD
4, 8357–8379, 2004
Water vapour and ozone profiles G. Vaughan et al. Title Page Abstract Introduction Conclusions References Tables Figures J I J I Back Close
Full Screen / Esc
Print Version Interactive Discussion EGU 0 5 10 15 20 0 20 40 60 80 100 120 140 160 W inter 6-8 km S ummer 6-8 km MOZAIC dis tribution
R H wrt ice, % P ro b a b ili ty , % 0 5 10 15 20 0 20 40 60 80 100 120 140 160 W inter 8-10 km S ummer 8-10 km MOZAIC dis tribution
R H wrt ice, % P ro b a b ili ty , %
Fig. 6. Probability distributions of relative humidity (wrt ice) measured by Humicap-A sensors launched from Aberystwyth, for two altitude ranges and for summer (April–September) and winter (October–March) half-years.