Publisher’s version / Version de l'éditeur:
Questions? Contact the NRC Publications Archive team at
PublicationsArchive-ArchivesPublications@nrc-cnrc.gc.ca. If you wish to email the authors directly, please see the first page of the publication for their contact information.
https://publications-cnrc.canada.ca/fra/droits
L’accès à ce site Web et l’utilisation de son contenu sont assujettis aux conditions présentées dans le site
LISEZ CES CONDITIONS ATTENTIVEMENT AVANT D’UTILISER CE SITE WEB.
Research Report (National Research Council of Canada. Institute for Research in
Construction), 2007-11-01
READ THESE TERMS AND CONDITIONS CAREFULLY BEFORE USING THIS WEBSITE. https://nrc-publications.canada.ca/eng/copyright
NRC Publications Archive Record / Notice des Archives des publications du CNRC : https://nrc-publications.canada.ca/eng/view/object/?id=a72305a0-1c8f-40e9-bc55-35b53d1e78be https://publications-cnrc.canada.ca/fra/voir/objet/?id=a72305a0-1c8f-40e9-bc55-35b53d1e78be
NRC Publications Archive
Archives des publications du CNRC
For the publisher’s version, please access the DOI link below./ Pour consulter la version de l’éditeur, utilisez le lien DOI ci-dessous.
https://doi.org/10.4224/20377412
Access and use of this website and the material on it are subject to the Terms and Conditions set forth at
Fire Deaths, Injuries and Monetary Losses in Canada 1986-2000
Bounagui, A.; Bénichou, N.
Fire Deaths, Injuries and
Monetary Losses in Canada
1986-2000
Research Report No. 238
Authors:
Abderrazzaq Bounagui
Noureddine Bénichou
ABSTRACT
This report presents an analysis of fire data gathered in Canada for the period 1986-2000. The study shows that fire incidents fell from 68,083 to 56,585, a decline of 16 %. The fire deaths and injuries averages also fell from 506 and 3,772 to 379 and 2,890 respectively, a decline of 25 % and 23%, respectively. The highest rate of fire deaths per million people was recorded in the Northwest Territories (94 PMP) for the period under study. Residential houses are the properties most affected: 42% of the fires, and approximately 80% of the fire deaths took place in residential properties. Cooking equipment, heating equipment, electrical distribution equipment, and smoker’s materials are the leading factors responsible for fire in Canada. They account for 42% of the fires across the country. Mechanical and electrical failures are also important circumstances leading to fire incidents.
ABSTRACT
...2
TABLE OF CONTENTS
...3
LIST OF TABLES
...4
LIST OF FIGURES
...5
1
INTRODUCTION...6
2
OVERVIEW OF FIRE LOSSES IN CANADA 1986-2000...6
3
FIRE DEATHS, INJURIES AND MONETARY LOSSES BY JURISDICTIONS...8
3.1 Fire deaths, injuries and property losses by property classification
... 12
3.2 Fire deaths, injuries and losses by residential occupancy
... 16
3.3 Fire deaths, injuries and losses by source of ignition
... 20
3.4 Fire deaths, injuries and deaths by act or omission causing the fire
... 27
SUMMARY
...32
LIST OF TABLES
Table 1. Summary of fire deaths, injuries and losses in Canada - 1986-2000
... 6
Table 2. Fire incident rates PMP by jurisdiction
... 8
Table 3. Fire deaths PMP by jurisdiction
... 9
Table 4. Fire injuries by jurisdiction
... 10
Table 5. Monetary losses per fire in CND $ by jurisdiction
... 11
Table 6. Fires by property classification
... 13
Table 7. Fire deaths by property classification
... 14
Table 8. Fire injuries by property classification
... 15
Table 9. Monetary losses (in CND $ Million) by property classification
... 16
Table 10. Average fire incidents by residential occupancy... 17
Table 11. Average fire deaths by residential occupancy ... 18
Table 12. Average fire injuries by residential occupancy ... 19
Table 13. Average losses by residential occupancy per million Canadian dollars
20
Table 14. Fires by ignition source... 22
Table 15. Fires deaths by ignition source
... 24
Table 16. Fires injuries by ignition source
... 25
Table 17. Monetary losses (in CND Million) by ignition source
... 26
Table 18. Fire by act or omission causing the fire
... 27
Table 19. Fire deaths by act or omission causing the fire
... 28
Table 20. Fire injuries by act or omission causing the fire
... 29
Figure 1. Fire deaths per million for the period 1986-2000
... 7
Figure 2. Fire injuries per million for the period 1986-2000
... 7
Figure 3. Average fire incident rates PMP by jurisdiction
... 9
Figure 4. Average fire death rates PMP by jurisdiction
... 10
Figure 5. Average fire injuries rate PMP by jurisdiction
... 11
Figure 6. Fire incident percentage by property classification
... 12
Figure 7. Average fire incidents by property classification
... 13
Figure 8. Fire death percentage by property classification
... 14
Figure 9. Fire injuries percentage by property classifications
... 15
Figure 10. Fire incidents percentage by residential occupancy
... 17
Figure 11. Fire deaths percentage by residential occupancy
... 18
Figure 12. Average fire injuries by residential occupancy
... 19
Figure 13. Fire loss percentage by residential occupancy 1986-2000
... 20
Figure 14. Fire incidents by source of ignition 1986-2000
... 21
Figure 15. Fire death percentage by source of ignition
... 23
Figure 16. Average fire death by ignition source
... 24
Figure 17. Average fire injuries by ignition source
... 26
Figure 18. Fire by act or omission causing the fire
... 28
Figure 19. Fire death by act or omission causing the fire
... 29
Figure 20. Fire injuries by act or omission causing the fire
... 30
1
INTRODUCTIONFire is a challenge faced by all countries. Analyzing the consequences of fire in terms of human lives and material damages plays an important role to aid in identifying potential hazards in the built environment. In addition, fire has significant social and economic impacts on our society. Each year, Canada sees a number of deaths occurring in different locations as a result of fires. These fires also result in injuries and losses of quality of life and property. In order to characterize the fire casualties and determine the trends, this report presents an analysis of fire statistics in Canada during the period 1986-2000 [1 to 15].
2
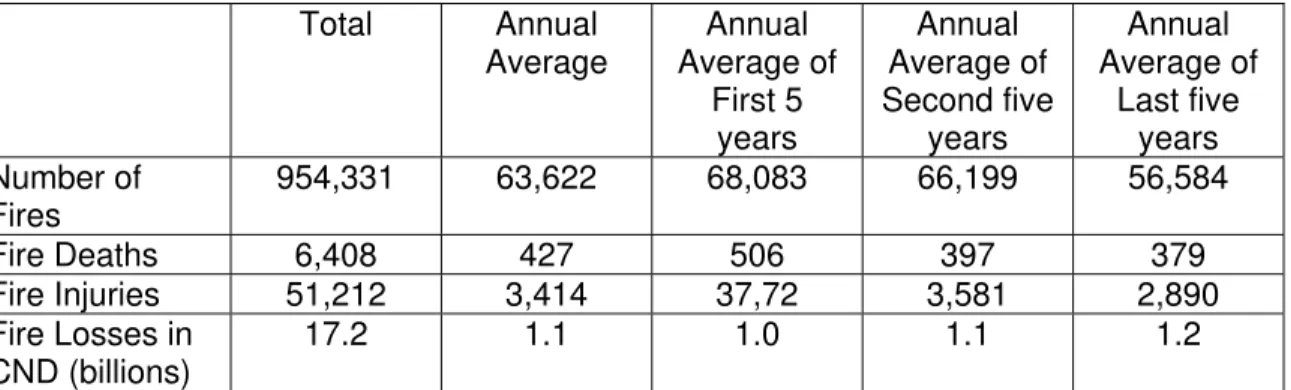
OVERVIEW OF FIRE LOSSES IN CANADA 1986-2000Every year, fires in Canada create a number of deaths and injuries and are also responsible for billions of dollars in terms of material damage. Table 1 shows a summary of fire deaths, injuries, and losses in Canada for the period 1986-2000.
Table 1. Summary of fire deaths, injuries and losses in Canada - 1986-2000
Total Annual Average Annual Average of First 5 years Annual Average of Second five years Annual Average of Last five years Number of Fires 954,331 63,622 68,083 66,199 56,584 Fire Deaths 6,408 427 506 397 379 Fire Injuries 51,212 3,414 37,72 3,581 2,890 Fire Losses in CND (billions) 17.2 1.1 1.0 1.1 1.2
An annual average of 63,622 fires occurred in Canada for a total of 954,331 declared fires over the same period under consideration. Over the first ten years, the average number of fires was above the period average and reached 68,083 and 66,199 respectively. The last five years averaged out to 56,584 fires and is by far less than the previous ones. These three averages actually indicate that the fire frequency is slowing down over the period 1986-2000, a decline of 16%. The fire frequency is still above 52,000 a year, which represents an average of more than 1,000 fires a week.
Fires in Canada for this period result in a significant loss of lives. From 1986 to 2000, 6,408 people died from fires across the nation. An average of 506 per year occurred during the first five years of the 15-year period. This average exceeds the period average of 427 deaths. Over the next ten years, the number of fire-related deaths had fallen, a decline of 25%. Figure 1 illustrates how fire-related deaths per million people (PMP) vary over the period 1986-2000.
0.00 5.00 10.00 15.00 20.00 1986 1988 1990 1992 1994 1996 1998 2000 Years
Fire Deaths per million
Figure 1. Fire deaths per million for the period 1986-2000
Fires account for 51,212 reported injuries over the period 1986-2000. Fire injuries display a similar trend to the number of fires occurring in the country. They remain high with respect to the period average (3,414) and practically constant throughout the first and second five-year periods, namely 3,772 and 3,581 injuries respectively. During the last five years of the period, the number of fire injuries fell below the average to 2,890, a decline of 23%. This similarity between the fire incidence and the fire injury trend shows that the number of fire injuries can be reduced if the fire incidents are somehow contained. Figure 2 represents the trend in fire injuries in Canada during the period.
The decline of the frequency of fire incidents, fire deaths and fire injuries noticed for the period 1986-2000 can be attributed to the improvement of fire safety in Canada.
0.00 10.00 20.00 30.00 40.00 50.00 60.00 70.00 1986 1988 1990 1992 1994 1996 1998 2000 Years
Fire Injuries per Million
The monetary losses are important in the sense that they represent a loss of resources in society as a whole. Unlike the number of fires in Canada, the monetary losses due to fire are roughly sloped upward over the period 1986-2000. Inflation is probably responsible for that unexpected variation. Over 17 billion dollars of damage were recorded in Canada from 1986 to 2000, which represents on average more than 1 billion dollars per year. The five-year averages fluctuate about the period average.
3
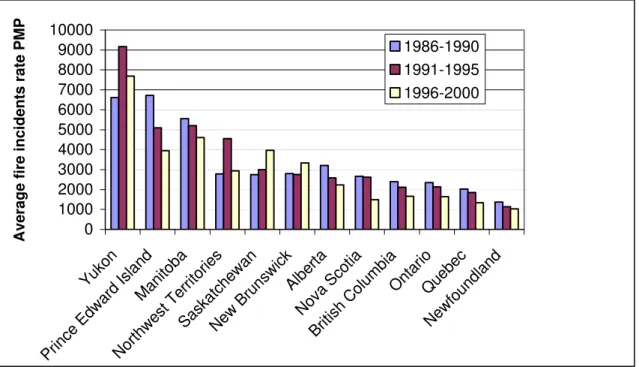
FIRE DEATHS, INJURIES AND MONETARY LOSSES BY JURISDICTIONSThis section looks at the rates of fire incidents, deaths, injuries and fire losses in various jurisdictions. Table 2 shows fire incidents PMP by jurisdictions. With the exception of the Yukon, Northwest Territories, Saskatchewan and New Brunswick, every jurisdiction registered a decline in fire incidents during the 15 year period (Figure 3). Fire incident rates are not uniformly distributed among the different parts of the country. For instance, in the last 5 years, the fire incident rate PMP varies from a low of 1,028 in Newfoundland to 7,689 in Yukon.
Table 2. Fire incident rates PMP by jurisdiction
1986- 2000 1986-1990 1991-1995 1996-2000
Yukon 7,824.8 6,613.5 9,171.2 7,689.6
Prince Edward Island 5,459.1 6,724.2 5,099.3 3,950.1
Manitoba 5,120.5 5,553.1 5,200.4 4,608.1 Northwest Territories 3,424.8 2,778.6 4,556.3 2,939.5 Saskatchewan 3,235.2 2,743.4 2,997.0 3,965.1 New Brunswick 2,964.8 2,801.2 2,756.5 3,336.6 Alberta 2,648.1 3,204.4 2,586.3 2,234.2 Nova Scotia 2,257.3 2,666.8 2,617.9 1,487.1 British Columbia 2,054.4 2,394.8 2,110.3 1,658.2 Ontario 2,039.5 2,350.0 2,128.7 1,639.9 Quebec 1,735.8 2,020.9 1,854.0 1,332.5 Newfoundland 1,189.7 1,370.7 1,137.9 1,028.4
Table 3 shows the fire deaths PMP by jurisdictions. The highest rates of deaths PMP for the period were in the Northwest Territories (94 PMP) and Yukon (40 PMP) and Prince Edward Island (30 PMP). These are projected values as these jurisdictions may have less than one million population. The fire deaths rates in these jurisdictions have declined respectively by 44 %, 81 % and 70% in the last 5-year period. This can be attributed to the improvement of the life safety measures taken in these jurisdictions. The other jurisdictions also registered a decline in the fire deaths rate during the period 1986-2000 (Figure 4). The decline of fire deaths in Canada has benefited all the jurisdictions. However the fire deaths rate varies across the country. In the last five years, the fire deaths rate PMP varies from a low of 9 in British Columbia to a high of 43 in the Northwest Territories.
0 1000 2000 3000 4000 5000 6000 7000 8000 9000 Yukon Prin ce Edwar d IslandMani toba Nor thw est Ter ritor ies Saska tchewan New Brun swickAlberta Nov a Sc otia British C olum bia Ont ario Que bec Newf ound land
Average fire incidents rate PMP
1986-1990 1991-1995 1996-2000
Figure 3. Average fire incident rates PMP by jurisdiction
Table 3. Fire deaths PMP by jurisdiction
1986-2000 Average 1986-1990 Average 1991-1995 Average 1996-2000 Average Northwest Territories 94.1 78.5 160.3 43.5 Yukon 40.5 68.5 40.2 12.9
Prince Edward Island 30.0 49.5 19.7 14.7
Nova Scotia 26.7 35.4 20.2 24.7 Manitoba 22.2 26.0 19.1 21.6 Newfoundland 21.6 28.8 17.7 17.3 New Brunswick 20.6 32.3 18.2 11.2 Saskatchewan 20.0 23.0 20.4 16.5 Alberta 15.9 22.9 12.5 12.2 Ontario 13.5 15.7 12.4 11.8 Quebec 11.9 14.9 10.9 10.0 British Columbia 11.8 17.1 9.6 8.7
0
20
40
60
80
100
120
140
160
180
Northwest Territo ries Yukon Princ e Edward IslandNov a Sc otia Mani toba Newfou ndland New B runsw ick Sask atche wan AlbertaOntarioQue bec Britis h Col umb ia
Average deaths PMP
1986-1990
1991-1995
1996-2000
Figure 4. Average fire death rates PMP by jurisdiction
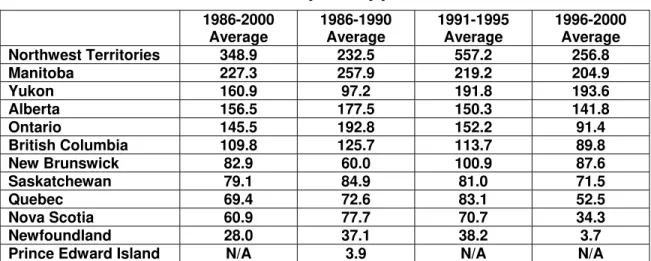
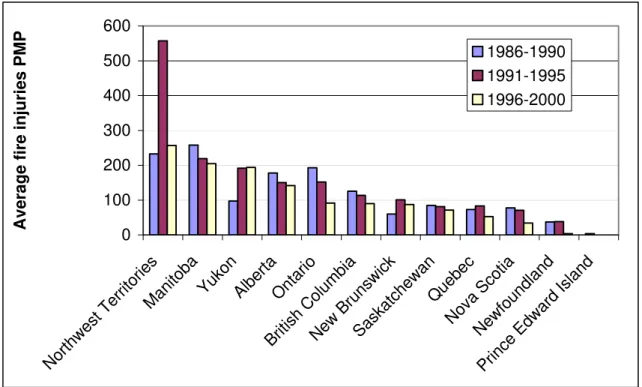
Table 4 shows the fire injuries PMP by jurisdictions. The Northwest Territories had the highest rate of fire injuries (349 PMP) in Canada. These are projected values as these jurisdictions may have less than one million population. The various jurisdictions registered a decline in the fire injuries rate for the period under consideration (Figure 5). The fire injuries rate varies across the country; for instance, in the last five years, the rate varies from a low of 4 in Newfoundland to a high of 256 in the Northwest Territories.
Table 4. Fire injuries by jurisdiction
1986-2000 Average 1986-1990 Average 1991-1995 Average 1996-2000 Average Northwest Territories 348.9 232.5 557.2 256.8 Manitoba 227.3 257.9 219.2 204.9 Yukon 160.9 97.2 191.8 193.6 Alberta 156.5 177.5 150.3 141.8 Ontario 145.5 192.8 152.2 91.4 British Columbia 109.8 125.7 113.7 89.8 New Brunswick 82.9 60.0 100.9 87.6 Saskatchewan 79.1 84.9 81.0 71.5 Quebec 69.4 72.6 83.1 52.5 Nova Scotia 60.9 77.7 70.7 34.3 Newfoundland 28.0 37.1 38.2 3.7
0 100 200 300 400 500 Northwe st Te rrito ries Manito ba Yukon Alber ta Ontario British Columbia New BrunswickSaska
tche wan Quebe c Nova Scotia Newfoun dlan d
Prince Edward Island
Average fire injuries PMP
1986-1990 1991-1995 1996-2000
Figure 5. Average fire injuries rate PMP by jurisdiction
Table 5 shows the fire losses per fire by jurisdictions. It is important to note that the fire losses are not proportionately distributed among the provinces according to the rate of fire incidents. Many more fires (as a rate PMP), for instance, occurred in the Yukon than in British Columbia (Table 2), yet they are approximately subjected to the same monetary losses over the period (Table 5).
Table 5. Monetary losses per fire in CND $ by jurisdiction
1986-2000 Average Percentage Average 1986-1990 Average 1991-1995 Average 1996-2000 Average Northwest Territories 48,335.3 20.8 30,273.7 42,580.0 80,411.2 Newfoundland 31,309.6 13.5 19,077.0 43,191.3 35,481.2 Quebec 27,979.7 12.0 22,788.6 26,591.7 37,255.3 British Columbia 21,843.4 9.4 18,673.2 21,933.6 25,349.6 Yukon 21,744.8 9.3 10,419.5 13,682.3 39,262.4 Alberta 16,887.9 7.3 14,711.8 14,916.8 21,659.5 Ontario 15,868.4 6.8 13,711.4 16,183.4 18,167.1 Saskatchewan 11,770.5 5.1 13,156.6 11,422.1 11,065.3 Manitoba 10,625.9 4.6 9,619.15 9,180.71 13,398.9 Nova Scotia 10,598.2 4.6 9,534.7 10,870.6 11,961.7 New Brunswick 8,496.9 3.7 8,188.1 10,420.7 7,165.9
3.1 Fire deaths, injuries and property losses by property classification
This section looks at the types of properties where most fires occurred and the properties that are responsible for most of the casualties. Residential properties are the main places where the majority of fires took place in Canada for the period 1986-2000. Of the declared fires, over 42% occurred in residential properties; see Figures 6 and 7. The average of fire incidents in this category fell from 31,226 in the first five years to 22,424 in the last five years, a decline of 28%. Table 6 shows a summary of fire incidents by property classification for the period.
42% 36% 3% 3% 3% 2% 4% 7% Residential Special Properties Assembly Mercantile Storage Properties
Industrial manufacturing properties Farm Properties,Business and personnel services, Institutional Miscellaneous properties
0 5000 10000 15000 20000 25000 30000 Res ident ial Spec ial P ropert ies Assem bly Mer cant ile Storage Prop erties Indust rial manuf acturing properti es Farm Prope rties Bus iness and person nel ser vices Institutional Mis cell ane ous properti es
Average fire incidents
1986-1990 1991-1995 1996-2000
Figure 7. Average fire incidents by property classification
Table 6. Fires by property classification
Annual Average Percentage 1986-1990 Average 1991-1995 Average 1996-2000 Average Residential 27,016.4 42.2 31,226.2 27,398.6 22,424.4 Special Properties 23,112.6 36.3 24,693 24,112.4 20,532.6 Assembly 2,005.9 3.2 2,090 2,029.0 1,898.8 Mercantile 1,799.7 2.8 2,049.8 1,850.2 1,499.2 Storage Properties 1,630.8 2.6 1,801.4 1,610.6 1,480.6 Industrial Manufacturing properties 1,537.1 2.4 1,806.2 1,392.6 1,412.6 Farm Properties 1,268.4 1.8 1,496.4 1,305.2 937.5
Business and Personnel
Services 587.3 0.9 588.4 558.8 614.8
Institutional 538.4 0.8 577.4 515.8 522.2
Miscellaneous
Properties 4,276.3 6.9 1,954.0 5,426.0 5,449.0
Fires are more often fatal in residential properties than in any other property group. Nearly 80% of the fire-related deaths came from residential properties; see Figure 8. The number of fire deaths in the residential properties declined by 36% during the period. See Table 7 for illustration.
79% 8% 6% 7% Residential Special Properties Institutional, Mercantile, Storage Properties, Industrial Manufacturing Properties, Assembly, Farm Properties and Business and Personal
Services
Miscellaneous Properties
Figure 8. Fire death percentage by property classification
Table 7. Fire deaths by property classification
Annual Average
Percentage Avg. First 5 years Avg. Second 5 years Avg. last 5 years Residential 335.6 79.2 420.6 315.4 270.8 Special Properties 33.8 7.98 38.8 25.2 37.4 Institutional 7.8 1.8 8.4 7.6 7.6 Mercantile 4.4 1.0 7.4 1.6 4.2 Storage Properties 3.8 0.9 4.2 3.0 4.4 Industrial Manufacturing Properties 3.7 0.9 4.6 2.6 4.0 Assembly 2.8 0.6 4.6 2.8 1.2 Farm Properties 1.9 0.5 1.8 2.4 1.5
Business and Personnel
Services 0.6 0.2 0.6 0.4 1.0
Miscellaneous
Properties 28.8 6.8 14.6 35.2 36.6
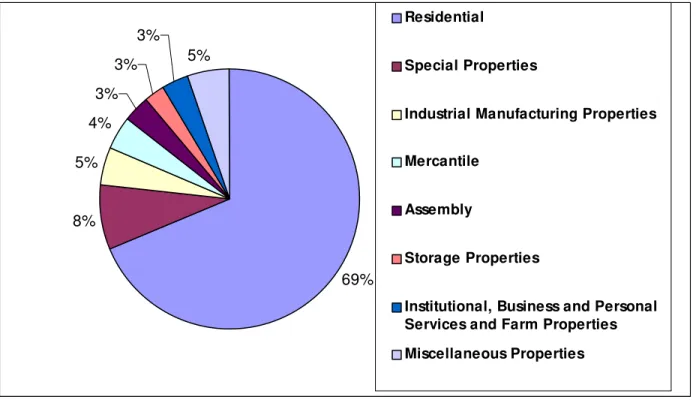
Fires in residential properties resulted in approximately 69% of fire-related injuries than in any other property group (see Figure 9). By examining the averages of fire-related injuries in the first and last five years, the fire injuries in the residential properties category declined by 26%. See Table 8 for illustration.
69% 8% 5% 4% 3% 3% 3% 5% Special Properties
Industrial Manufacturing Properties
Mercantile
Assembly
Storage Properties
Institutional, Business and Personal Services and Farm Properties Miscellaneous Properties
Figure 9. Fire injuries percentage by property classifications
Table 8. Fire injuries by property classification
Annual Average Percentage 1986-1990 Average 1991-1995 Average 1996-2000 Average Residential 2,311.6 68.4 2,573.2 2,477.4 1,884.4 Special Properties 269.1 8.0 325.2 264.6 217.6 Industrial Manufacturing Properties 164.9 4.8 191.6 129.4 173.8 Mercantile 136.4 4.0 161.8 147.4 100.0 Assembly 115.6 3.4 149.2 113.4 84.4 Storage Properties 90.4 2.6 118.4 87.2 65.8 Institutional 54.8 1.6 53.2 46.8 64.4
Business and Personnel
Services 34.5 1.0 42 32.4 29.2
Farm Properties 23.2 0.7 23.6 28.6 16.0
Miscellaneous
Properties 175.7 5.2 151.2 253.4 122.6
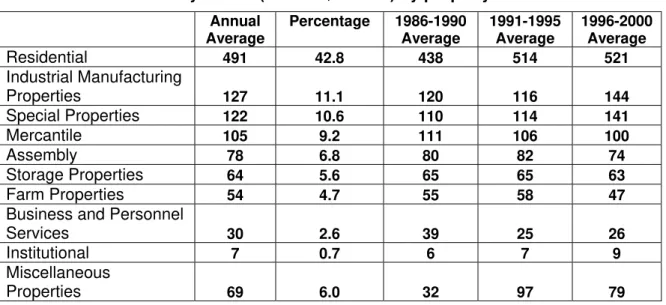
The cost of the fires is important in the residential category. In fact, 43% of the monetary losses fall into this group. The Industrial Manufacturing Properties and Special Property comes second but at a much lower level in terms of cost (11% on average). Categories such as Assembly, Mercantile, and Industrial Manufacturing are not very likely to be involved in a fire but if they are the cost is fairly high, given the nature of the equipment involved. Overall the trends sloped upward over the period 1986-2000. Inflation is
probably responsible for this variation. Table 9 gives the distribution and the variation of the monetary losses over the period.
Table 9. Monetary losses (in CND $ Million) by property classification
Annual Average Percentage 1986-1990 Average 1991-1995 Average 1996-2000 Average Residential 491 42.8 438 514 521 Industrial Manufacturing Properties 127 11.1 120 116 144 Special Properties 122 10.6 110 114 141 Mercantile 105 9.2 111 106 100 Assembly 78 6.8 80 82 74 Storage Properties 64 5.6 65 65 63 Farm Properties 54 4.7 55 58 47
Business and Personnel
Services 30 2.6 39 25 26
Institutional 7 0.7 6 7 9
Miscellaneous
Properties 69 6.0 32 97 79
3.2 Fire deaths, injuries and losses by residential occupancy
The importance of the Residential category suggests breaking it down further so that the vulnerable elements can be identified. By doing so, it is revealed that about 84% of the fires in the Residential group occurred in the following three subcategories: “one and two family residence”, “apartment, tenement, flat”, and “mobile home, trailer”. It is also remarkable that over 80% of these fires took place in the first two subcategories, which actually represent the regular homes. Figures 10 to 13 and Tables 10 to 13 clearly show the trends over the period 1986-2000 for fire incidents, deaths, injuries, and losses.
60% 20%
3% 3%
14% Apartment Tenement, Flat
Mobile Home, Trailer
Hotel, Inn, Lodge, Rooming, Board, Lodging, Motor Hotel, Motel and Dormitory
Miscellaneous
Figure 10. Fire incidents percentage by residential occupancy
Table 10. Average fire incidents by residential occupancy Annual Average Percentage 1986-1990 Average 1991-1995 Average 1996-2000 Average One and Two
Family Residence 17,115.0 60.6 20,978.8 18,435.4 11,930.8 Apartment Tenement, Flat 5,593.2 19.8 6507.0 5,933.8 4,338.8 Mobile Home, Trailer 917.9 3.3 1,132.4 883.0 738.2
Hotel, Inn, Lodge 311.9 1.1 396.0 294.2 245.6
Rooming, Board, Lodging
279.9 1.0 352.2 298.2 189.4
Motor Hotel, Motel 105.4 0.4 139.4 105.6 71.2
Dormitory 78.1 0.3 94.2 75.2 65.0
59% 19% 6% 3% 2% 11%
One and Two Family Residence
Apartment Tenement, Flat
Mobile Home, Trailer
Rooming, Board, Lodging
Hotel, Inn, Lodge, Motor Hotel, Motel, Dormitory Miscellaneous
Figure 11. Fire deaths percentage by residential occupancy
Table 11. Average fire deaths by residential occupancy Annual Average Percentage 1986-1990 Average 1991-1995 Average 1996-2000 Average One and Two
Family Residence 206.9 59.3 266.4 210.6 143.8 Apartment Tenement, Flat 67.4 19.3 86.8 59.2 56.2 Mobile Home, Trailer 21.7 6.2 24.2 21.8 19.0
Hotel, Inn, Lodge 10.7 3.1 17.6 10.0 4.6
Rooming, Board, Lodging 2.9 0.8 4.4 2.8 1.6 Motor Hotel, Motel 1.7 0.5 2.4 0.8 2.0 Dormitory 0.7 0.2 1.4 0.4 0.2 Miscellaneous 37.2 10.7 58.4 9.8 43.4
51% 33% 3% 2% 2% 9% Residence Apartment Tenement, Flat
Mobile Home, Trailer
Rooming, Board, Lodging
Hotel, Inn, Lodge, Motor Hotel, Motel and
Dormitory Miscellaneous
Figure 12. Average fire injuries by residential occupancy
Table 12. Average fire injuries by residential occupancy Annual Average Percentage 1986-1990 Average 1991-1995 Average 1996-2000 Average One and Two
Family Residence 1 168.6 51.7 1153.2 1383.4 969.2 Apartment Tenement, Flat 738.7 32.7 765.4 851.4 599.4 Mobile Home, Trailer 60.8 2.7 63. 47.2 49.4
Hotel, Inn, Lodge 53.4 2.4 69.2 80.8 32.4
Rooming, Board, Lodging 33.3 1.5 42.8 36.8 20.4 Motor Hotel, Motel 8.5 0.4 11.0 8.6 6.0 Dormitory 4.8 0.2 5.4 3.4 5.6 Miscellaneous 194.3 8.6 315.0 65.8 202.0
62.4% 15.9% 3.1% 2.3% 1.8% 14.7%
One and Two Family Residence
Apartment Tenement, Flat
Mobile Home, Trailer
Hotel, Inn, Lodge
Rooming, Board, Lodging, Motor Hotel, Motel and Dormitory Miscellaneous
Figure 13. Fire loss percentage by residential occupancy 1986-2000
Table 13. Average losses by residential occupancy per million Canadian dollars
Annual Average Percentage 1986-1990 Average 1991-1995 Average 1996-2000 Average One and Two
Family Residence 320.5 62.4 294.6 360.9 305.9
Apartment
Tenement, Flat 81.4 15.9 86.9 87.5 112.7
Mobile Home,
Trailer 15.7 3.1 15.3 15.7 16.0
Hotel, Inn, Lodge 11.7 2.3 13.4 13.0 8.5
Rooming, Board,
Lodging 5.0 1.0 5.4 5.4 4.3
Motor Hotel, Motel 3.0 0.6 3.5 3.1 2.3
Dormitory 1.3 0.3 1.5 0.8 1.6
Miscellaneous 75.3 14.7 85.6 27.6 69.8
3.3 Fire deaths, injuries and losses by source of ignition
This section looks in more detail at the source of the flame, spark or heat that first ignited the fire. This is related to the cause of the fire. It points out the specific items responsible for fires in the country. If measures can be taken to control these items, fewer fires and consequently less damage will be recorded in the future. The frequencies of the fires by the source of ignition are not distributed uniformly. Over the period 1986-2000, an average of 12% of the total fires in Canada originated from “cooking equipment”; each of
were involved in 6% of the fires (Figure 14 and Table 14). These are the 5 leading causes of fire in the country and accounted for around 42% of the fires over the period 1986-2000. Table 14 shows the distribution of these fire factors over the period. Comparing the average fire incidents in the first five years and the last five years the fires caused by cooking equipment fell by 32 %.
12%
9%
9%
6%
6%
5%
4%
3%
3%
4%
19%
20%
Cooking equipmentElectrical distribution equipment
Heating equipment
Smoker's material or "open flame" unclassified
Smoker's material
Match, lighter
Appliances and equipment
Exposure
Other electrical equipment
Cutting torch, welding equipment, No igniting object and Hot ashes, embers Miscellaneous
Undetermined
Figure 14. Fire incidents by source of ignition 1986-2000
Smoker’s material is by far the most fatal of all the fire factors; see Figure 15 and Table 15. It is the cause of over 20% of the fire deaths in Canada. The fire caused by smoker’s materials fell by 22% over the period. The same factors responsible for fires are also the most deadly ones. More than 50% of the fire-related deaths come from them. However the number of fire deaths caused by these factors decreased over the period except for smoker’s material “open flame” which increased by 15%. Table 15 and Figure 16 present the variation of fire-related deaths in Canada by source of ignition from 1986-2000.
Table 14. Fires by ignition source Annual Average Percentage 1986-1990 1991-1995 1996-2000 Cooking equipment 7,543.9 11.9 8,875.6 7,714.8 6,041.4 Electrical distribution equipment 5,972.4 9.4 7,333.8 5,796.6 4,787.0 Heating equipment 5,889.8 9.3 7,073.0 5,828.4 4,768.0 Smoker’s material or "open flame" unclassified 3,786.8 5.9 3,355.6 4,056.6 3,948.2 Smoker’s material 3,661.9 5.8 4,359.8 3,243.4 3,382.4 Match, lighter 3,083.4 4.8 3,366.8 3,462.0 2,421.4 Appliances and equipment 2,320.9 3.7 2,675.2 2,228.6 2,059.0 Exposure 2,086.0 3.3 2,043.2 1,533.4 2,681.6 Other electrical equipment 2,035.2 3.2 1,524.0 1,858.4 2,723.2
Cutting torch, welding
equipment, 1,208.8 1.9 1,952.0 848.0 826.4
No igniting object 790.5 1.2 637.8 1,193.6 540.0
Hot ashes,
embers(non-smoking material) 483.4 0.8 546.2 465.2 438.8
Miscellaneous 12,927.6 20.3 14,607.0 12,922.0 11,253.8
21% 10% 7% 7% 6% 4% 5% 14% 26% Cooking equipment Heating equipment
Smoker's material or "open flame" unclassified
Match, lighter
Electrical distribution equipment
Appliances and equipment, Other electrical equipment, No igniting object, Exposure, Cutting torch,welding equipment and Hot ahes, embers Miscellaneous
Undetermined
Figure 15. Fire death percentage by source of ignition
The five leading factors causing fire injuries are the cooking equipment 27 %, smoker’s material 14%, match, lighter 7 %, heating equipment 7 % and electrical distribution equipment 6 %. The fire injuries caused by the five factors decreased over the period. Figure 17 and Table 16 shows fire-related injuries in Canada by source of ignition from 1986-2000.
Table 15. Fires deaths by ignition source Annual Average Percentage 1986-1990 Average 1991-1995 Average 1996-2000 Average Smoker’s material 87.9 20.8 110.0 67.8 85.8 Cooking equipment 41.6 9.8 46.6 41.2 37.0 Heating equipment 29.9 7.1 44.4 26.0 19.4 Smoker’s material or "open flame" unclassified 29.5 7.0 30.0 23.4 35.2 Match, lighter 25.8 6.1 27.2 35.6 14.6 Electrical distribution equipment 16.6 3.9 24.8 14.4 10.6 Appliances and equipment 4.9 1.2 5.0 5.4 4.4 Other electrical equipment 4.4 1.0 2.6 5.2 5.4 No igniting object 3.1 0.7 3.0 4.4 2.0 Exposure 3.0 0.7 1.2 4.8 3.0
Cutting torch, welding
equipment, 3.0 0.7 4.8 2.2 2.0
Hot ashes,
embers(non-smoking material) 1.2 0.3 1.6 1.2 0.8 Miscellaneous 58.1 13.7 72.4 36.2 65.6 Undetermined 113.3 26.8 131.8 125.4 82.6
0
20
40
60
80
100
120
140
Smoker' s material Heat ing equipment Mat c h, light er Appliances and N o ignit ing object Cu ttin g to rch , w elding MiscellaneousAverage fire deaths
1986-1990
1991-1995
1996-2000
Annual Average Percentage 1986-1990 Average 1991-1995 Average 1996-2000 Average Cooking equipment 944.2 26.7 1011.2 1014.4 807.0 Smoker’s material 488.2 13.8 617.8 443.8 403.0 Match, lighter 263.1 7.4 276.6 292.0 220.8 Heating equipment 248.26 7.0 306.2 243.6 195.0 Electrical distribution equipment 200.8 5.7 246.6 192.6 163.2 Smoker’s material or "open flame" unclassified 155.9 4.4 140.0 177.2 150.6 Appliances and equipment 104.2 2.9 104.8 89.2 118.6
Cutting torch, welding
equipment, 92.7 2.6 131.0 74.0 73.2
Other electrical
equipment 77.0 2.2 62.6 79.2 89.2
Exposure 29.2 0.8 24.8 22.6 40.2
Hot ashes, embers
(non-smoking material) 17.5 0.5 13.8 14.4 24.4
No igniting object 16.9 0.5 22.0 20.8 8.0
Miscellaneous 404.7 11.4 459.0 382.2 373.0
0
200
400
600
800
1000
1200
Cooki ng e quipmen t Smok er's materialMatc h, lighte r Heati ng eq uipm ent Elec trica l distr ibution equipment
Smok
er's material or "
open flame" unclas sified Appl iances and equi pment Cutti ng tor ch, w elding equipment, Othe r elec trical equi
pme nt Exposure Hot as hes, ember s(non-smok ing mater ial) No igni ting object Miscel lane ous Undetermined
Fire Injuries by ignition source
1986-1990
1991-1995
1996-2000
Figure 17. Average fire injuries by ignition source
Even though the electrical distribution equipment leads the cost of fire over the period, it turns out that the fire loss is fairly distributed among the different fire factors; see Table 17. The weight of the five most significant fire causes relative to the total cost lies in the range 5-12% and all combined add up to 28% of the monetary cost. Table 17 gives the distribution of the fire loss by source of ignition over the period 1986-2000.
Table 17. Monetary losses (in CND Million) by ignition source
Annual Average Percentage 1986-1990 Average 1991-1995 Average 1996-2000 Average Electrical distribution equipment 132.8 11.7 135.2 133.1 129.9 Heating equipment 97.0 8.6 97.2 97.8 96.0 Cooking equipment 67.8 6.0 65.0 67.0 71.5 Smoker’s material or "open flame" unclassified 61.1 5.4 57.1 44.6 81.5 Smoker’s material 43.6 3.9 47.3 39.6 43.8
Match, lighter(not used with smoking), lamp,
candle, taper 43.0 3.8 37.8 52.8 38.4
Appliances and
Cutting torch, welding equipment, varied
torches 27.5 2.4 27.4 29.2 25.8
No igniting object(e.g
lightning) 12.1 1.1 11.6 13.8 11.0
Hot ashes,
embers(non-smoking material) 7.6 0.7 7.5 9.2 6.1
Miscellaneous 192.4 17.0 214.2 104.5 258.5
Undetermined 368.3 30.4 302.9 412.7 394.6
3.4 Fire deaths, injuries and deaths by act or omission causing the fire
This section is closely related to the previous one but it refers to distinct situations. The source of ignition identifies the different items that are actually causing the fires; this section by contrast describes the context of the fires. With an average of 23% over the period, mechanical and electrical failure or malfunction starts most of the fires in Canada. The other main acts or omissions are “other set fires”, “arson or suspected arson”, “misuse of material ignited”, and “construction, design or installation deficiency” which are each responsible for at least 4% of the fires. All these items display a downward trend over the period 1986-1999 (Table 18 and Figure 18).
Table 18. Fire by act or omission causing the fire
Annual Average Percentage 1986-1990 Average 1991-1995 Average 1996-2000 Average Mechanical, electrical failure, malfunction 14,955.8 23.2 17,661.8 14,778.8 11,794.7
Other set fires 6,416.9 9.9 6,365.8 6,098.2 6,879.3
Miscellaneous human
failing 5,860.1 9.1 7,096.2 6,327.8 3,730.5
Arson/ suspected arson 4,056.8 6.3 3,024.0 5,367.0 3,710.2
Misuse of material ignited 3,546.6 5.5 5,451.2 2,720.4 2,198.7 Child playing 1,232.2 1.9 1,306.4 1,026.6 1,396.8 Smoker’s material 1,188.5 1.8 1,450.0 1,041.6 1,045.3 Construction, design or installation deficiency 2,580.0 4.0 2,994.0 2,116.8 2,641.5 Welding, cutting, thawing 632.3 0.9 453.4 351.0 1,207.7 Misuse of equipment 959.2 1.4 1,282.4 1,205.2 247.8 Vehicle accident 555.0 0.9 644.6 647.6 327.5 Suspected impairment
by alcohol, drugs, etc. 146.2 0.2 202.0 109.2 123.0
Asleep 114.1 0.2 150.4 97.6 89.5
Unclassified 5,296.0 8.2 5,313.8 5,503.0 5,015.0
Figure 18. Fire by act or omission causing the fire
Over the period, an average of 10% of fire-related deaths caused by miscellaneous human failing, misuse of material ignited 7 %, arson/suspected arson 6 % , mechanical electrical failure, malfunction 6%, smoker’s material 6 % and other set fires 6 %. The fire
deaths by act or omission causing fire had fallen down over the period(Table 19 and
Figure 19).
Table 19. Fire deaths by act or omission causing the fire
Annual Average Percentage 1986-1990 1991-1995 1996-2000 Miscellaneous human failing 42.2 9.8 60.6 32.2 31.75 Misuse of material ignited 30.2 7.0 39.2 23.4 27.5
Arson/ suspected arson 27.8 6.5 30.2 27.2 25.8
Mechanical, electrical
failure, malfunction 26.8 6.2 38.6 21.2 19.0
Smoker’s material 26.6 6.2 37.8 24.2 15.7
by alcohol, drugs, etc. 15.6 3.6 19.0 14.0 13.3 Construction, design or installation deficiency 9.9 2.3 14.0 9.8 5.0 Vehicle accident 8.8 2.0 14.0 5.8 6.0 Misuse of equipment 6.1 1.4 9.4 6.8 1.2 Asleep 4.6 1.1 7.6 3.6 2.3 Welding, cutting, thawing 3.4 0.8 1.4 1.0 9.0 Unclassified 51.6 12.0 62.2 50.0 40.5 Miscellaneous 130.6 30.4 128.6 138.2 123.5
Figure 19. Fire death by act or omission causing the fire
Over the period, an average of 14% of fire related injuries caused by miscellaneous human failing, misuse of material ignited 12 %, mechanical electrical failure, malfunction 12 %, arson/suspected arson 7 % and other set fires 6 %. The fire injuries by act or
omission causing fire had also fallen down over the period(Table 20 and Figure 20).
Table 20. Fire injuries by act or omission causing the fire
Annual Average Percentage 1986-1990 Average 1991-1995 Average 1996-2000 Average Miscellaneous human failing 467.1 13.6 758.6 521.0 375.7 Misuse of material ignited 403.9 11.8 707.0 392.6 343.5
Mechanical, electrical
failure, malfunction 394.3 11.5 543.4 393.4 342.2
Arson/ suspected arson 246.6 7.2 355.0 268.6 166.3
Other set fires 190.9 5.6 207.8 213.2 197.0
Child playing 160.6 4.7 226.2 144.6 179.2 Smoker’s material 116.1 3.4 173.6 108.4 121.3 Construction, design or installation deficiency 86.6 2.5 125.6 74.8 79.5 Misuse of equipment 54.0 1.6 91.4 62.8 29.5 Welding, cutting, thawing 61.8 1.8 48.8 29.2 120.3 Suspected impairment
by alcohol, drugs, etc. 36.8 1.1 55.0 34.6 33.2
Asleep 22.3 0.6 33.6 22.8 20.0
Vehicle accident 20.8 0.6 35.0 21.4 11.0
Unclassified 432.0 12.6 638.0 480.4 377.7
Miscellaneous 732.1 21.4 850.2 832.2 679.0
Figure 20. Fire injuries by act or omission causing the fire
The fire loss by omission causing fire follows the same pattern as the distribution of the fires by act or omission. Around 19% of the fire cost comes from the mechanical, electrical failure, while the other set fires account for 11%. The same five factors
Table 21 and Figure 21 illustrate that fact.
Table 21. Monetary losses by act or omission causing the fire
Annual Average Percentage 1986-1990 Average 1991-1995 Average 1996-2000 Average Mechanical, electrical failure, malfunction 218.8 18.6 210.0 208.6 242.7
Other set fires 124.4 10.6 96.3 120.4 164.4
Arson/ suspected arson 89.4 7.6 100.1 100.1 62.5
Miscellaneous human failing 85.9 7.3 83.8 98.6 72. 7 Misuse of material ignited 44.8 3.8 56.0 37.9 39.3 Construction, design or installation deficiency 41.9 3.5 40.5 35.2 52.0 Child playing 16.0 1.3 12.8 14.2 22.2 Smoker’s material 14.5 1.2 14.6 12.9 16.6 Welding, cutting, thawing 14.4 1.2 11.8 9.9 23.3 Misuse of equipment 11.0 0.9 13.7 12.2 6.2 Vehicle accident 8.8 0.7 11.4 9.6 4.5 Suspected impairment
by alcohol, drugs, etc. 2.4 0.2 2.5 2.2 2.5
Asleep 1.6 0.1 1.5 1.9 1.3
Unclassified 71.6 6.1 55.0 79.8 82.0
Figure 21. Fire losses by act or omission causing the fire
SUMMARY
This report presents the analysis of fire statistics in Canada from 1986 to 2000 based on statistical information available in order to determine the trend of fire deaths, injuries and monetary losses.
The overall trend of fires is downward from 1986 to 2000. In the last five years of the period, the fire incidents average declined by 16% to 56,584 which is below the period average of 63,622; the fire deaths average declined by 25 % to 379 which is below the period average 427; and the fire injuries average declined by 23% to 2,890 which is below the period average of 3,414. The monetary loss averaged out to $1.1 billion Canadian dollars.
The highest rate of fire death per million people was recorded in the Northwest
Territories (94 PMP). Every jurisdiction registered a decline in the fire deaths rate during the period 1986-2000. The decline of fire death in Canada has benefited all the
jurisdictions and may be attributed to the improvement in fire safety in Canada.
It is also important to note that more than 42% of the fires, and approximately 80% of the fire deaths took place in residential properties. Therefore, this category requires special consideration.
Cooking equipment was the main source of ignition and responsible for 12 % of fires and 27% of injuries. The number of such fires fell by 32% to 6,041 in the last five years.
materials fell by 22% in the last five years.
Mechanical and electrical failures constitute the primary starting point of fires across the country (23%). The number of such fires fell by 33% in the last five years. However, the miscellaneous human failing and misuse of material ignited are the main causes of the fire-related deaths (respectively 9.8% and 7%) and fire-related injuries (respectively 13.6% and 11.8%).
REFERENCES
1. Fire losses in Canada “Annual report 1986”, Labour Canada 2. Fire losses in Canada “Annual report 1987”, Labour Canada 3. Fire losses in Canada “Annual report 1988”, Labour Canada 4. Fire losses in Canada “Annual report 1989”, Labour Canada 5. Fire losses in Canada “Annual report 1990”, Labour Canada
6. Fire losses in Canada “Annual report 1991”, Association of Canadian Fire Marshals and Fire Commissioners
7. Fire losses in Canada “Annual report 1992”, Association of Canadian Fire Marshals and Fire Commissioners
8. Fire losses in Canada “Annual report 1993”, Association of Canadian Fire Marshals and Fire Commissioners
9. Fire losses in Canada “Annual report 1994”, Council of Canadian Fire Marshals and Fire Commissioners.
10. Fire losses in Canada “Annual report 1995”, Council of Canadian Fire Marshals and Fire Commissioners
11. Fire losses in Canada “Annual report 1996”, Council of Canadian Fire Marshals and Fire Commissioners
12. Fire losses in Canada “Annual report 1997”, Council of Canadian Fire Marshals and Fire Commissioners
13. Fire losses in Canada “Annual report 1998”, Council of Canadian Fire Marshals and Fire Commissioners
14. Fire losses in Canada “Annual report 1999”, Council of Canadian Fire Marshals and Fire Commissioners
15. Fire losses in Canada “Annual report 2000”, Council of Canadian Fire Marshals and Fire Commissioners