Publisher’s version / Version de l'éditeur:
Vous avez des questions? Nous pouvons vous aider. Pour communiquer directement avec un auteur, consultez la première page de la revue dans laquelle son article a été publié afin de trouver ses coordonnées. Si vous n’arrivez Questions? Contact the NRC Publications Archive team at
PublicationsArchive-ArchivesPublications@nrc-cnrc.gc.ca. If you wish to email the authors directly, please see the first page of the publication for their contact information.
https://publications-cnrc.canada.ca/fra/droits
L’accès à ce site Web et l’utilisation de son contenu sont assujettis aux conditions présentées dans le site
LISEZ CES CONDITIONS ATTENTIVEMENT AVANT D’UTILISER CE SITE WEB.
Technical Report; no. TR-2011-16, 2011-12
READ THESE TERMS AND CONDITIONS CAREFULLY BEFORE USING THIS WEBSITE. https://nrc-publications.canada.ca/eng/copyright
NRC Publications Archive Record / Notice des Archives des publications du CNRC :
https://nrc-publications.canada.ca/eng/view/object/?id=3254d94c-aed4-4b59-aab4-743b35565dbf https://publications-cnrc.canada.ca/fra/voir/objet/?id=3254d94c-aed4-4b59-aab4-743b35565dbf
NRC Publications Archive
Archives des publications du CNRC
For the publisher’s version, please access the DOI link below./ Pour consulter la version de l’éditeur, utilisez le lien DOI ci-dessous.
https://doi.org/10.4224/19577542
Access and use of this website and the material on it are subject to the Terms and Conditions set forth at Wave propagation before and after the floor work in the OEB in 2010
DOCUMENTATION PAGE REPORT NUMBER
TR-2011-16
NRC REPORT NUMBER DATE
December 2011
REPORT SECURITY CLASSIFICATION
Unclassified
DISTRIBUTION
Unlimited
TITLE
Wave propagation before and after the floor work in the OEB in 2010
AUTHOR (S)
Hasanat Zaman, Emile Baddour and Shane McKay
CORPORATE AUTHOR (S)/PERFORMING AGENCY (S)
National Research Council, Institute for Ocean Technology, St. John’s, NL
PUBLICATION
SPONSORING AGENCY(S)
IOT-NRC
IOT PROJECT NUMBER
2414-26
NRC FILE NUMBER
KEY WORDS
Waves before and after floor-work in OEB, mono- and bi-chromatic waves, Second-order waves, free-waves, data comparisons PAGES ii, 320, App. 1-4 FIGS. 1 TABLES 9 SUMMARY
Recently the south-west side trenches under and in front of the wave makers in the OEB have been permanently filled-up to provide a homogeneous bottom and uniform water depth all over the basin. This work is to understand the improvement of the wave quality after the floor work. Two sets of experimental data comprised of mono- and bi-chromatic waves before and after the floor work are compared to identify the impact of the development work on the wave generation and propagation in the OEB. Results are compared between the measured wave data, before and after the floor work in the OEB. Results are shown in terms of surface elevations and wave energies propagations for measured waves, primary waves, bounded waves and unwanted second order free waves. In most of the cases it is observed from the results that the shallower the wave the better the wave quality after the floor work.
ADDRESS National Research Council
Institute for Ocean Technology Arctic Avenue, P. O. Box 12093 St. John's, NL A1B 3T5
National Research Council Conseil national de recherches Canada Canada Institute for Ocean Institut des technologies
Technology océaniques
Wave propagation before and after the floor work in the OEB in 2010
TR-2011-16Hasanat Zaman, Emile Baddour and Shane McKay December 2011
TABLE OF CONTENTS
ABSTRACT...1
1.0 INTRODUCTION ...1
2.0 DESCRIPTION OF THE TRENCHES AND FILLED-UP WORK ...1
3.0 EXPERIMENTAL SETUP...1
4.0 EXPERIMENTS AND DATA ACQUISITIONS ...2
5.0 INCIDENT WAVE CONDITIONS ...3
6.0 DATA ANALYSES...4
6.1 COMPARISONS - 1: Monochromatic waves ... 4
6.2 COMPARISONS - 2: Bichromatic waves... 5
7.0 LWAVE utilization...6
8.0 RESULTS ...7
9.0 CONCLUSIONS...7
REFERENCES ...8
Appendix-I...9
Surface elevations, wave crests and wave troughs for mono-chromatic waves Appendix-II...99
Surface elevations, wave crests and wave troughs for bi-chromatic waves Appendix-III...180
Energy distributions for measured waves (SPEC1 and SPEC2), isolated Primary Waves (PW), Bounded Wave (BW), Free Wave-1 (FW1) and Free Wave-2 (FW2) for mono-chromatic waves Appendix-IV...247 Energy distributions for measured waves (SPEC1 and SPEC2), isolated Primary
Waves (PW), Bounded Wave (BW), Free Wave-1 (FW1) and Free Wave-2 (FW2) for bi-chromatic waves
LIST OF FIGURES
Fig. 1: Layout of the experimental tank (not to scale) ... 2
LIST OF TABLES Table 1 Location of the wave probes in the OEB... 2
Table 2a Mono-chromatic incident wave parameters (h=0.4m)... 3
Table 2b Bi-chromatic incident wave parameters (h=0.4m) ... 3
Table 3a Mono-chromatic incident wave parameters (h=0.5m)... 3
Table 3b Bi-chromatic incident wave parameters (h=0.5m) ... 3
Table 4a Mono-chromatic incident wave parameters (h=0.6m)... 3
Table 4b Bi-chromatic incident wave parameters (h=0.6m) ... 4
Table 5a Mono-chromatic incident wave parameters (h=0.8m)... 4
ABSTRACT
Recently the south-west side trenches under and in front of the wave makers in the OEB have been permanently filled-up to provide a homogeneous bottom and uniform water depth all over the basin. Two sets of experimental data comprised of mono- and bi-chromatic waves before and after the floor work are compared to identify the impact of the development work on the wave generation and propagation in the OEB. Results are compared between the measured wave data, before and after the floor work in the OEB. Results are shown in terms of surface elevations and wave energies propagations for measured waves, primary waves, bounded waves and unwanted second order free waves. In most of the cases it is observed from the results that the shallower the wave the better the wave quality after the floor work.
1.0 INTRODUCTION
The OEB at NRC-IOT is a world class 3D experimental wave basin. Recently the small trenches under and in front of the south and west side wave makers were filled-up to produce a uniform floor bottom. It is important to study the impact of this work on the wave quality in the basin.
In this work two sets of experimental data are used. The first set (called before from now on) of wave data was obtained from the experimental work before the trenches were filled-up and the second set (called after from now on) of data was obtained from the experiment after the trenches were filled up. In the experiments both mono- and bi-chromatic wave are considered for different water depths. Four different water depths were also used, 0.4m, 0.5m, 0.6m and 0.8m. Comparisons of the data were done for identical wave conditions.
2.0 DESCRIPTION OF THE TRENCHES AND FILLED-UP WORK
The south trench was about 64m long, 0.4m wide and 0.3m deep. The west trench was about 26m long, 0.4m wide and 0.3m deep. These trenches are permanently filled-up. 3.0 EXPERIMENTAL SETUP
The experiment was carried out at the Offshore Engineering Basin of National Research Council Canada, Institute for Ocean Technology. The top view of the basin is shown in Fig. 1. The Offshore Engineering Basin is 75 m long x 32 m wide. 56 independently controlled segmented wave generators installed on the west wall generated the waves. Each segmented wave generator is 2 m high and 0.5 m wide. Passive absorbers, made of expanded metal sheets with varying porosities and spacing, are installed on the east wall. A solid metal wall is used to cover the north side of the basin.
During the experiment, 14 wave probes (P-1 to P-14) are installed as shown in Fig. 1. But for 0.8m water depth only 10 wave probes are used. The dotted lines in Fig. 1 show the location of the trenches in the OEB that the basin previously had. Table-1 measured the location of the wave probes throughout the basin. All the wave probes are capacitance type. All the data was acquired using GDAC (GEDAP Data Acquisition and Control) client-server acquisition system, developed by National Research Council Canada, Institute for Ocean Technology.
4.0 EXPERIMENTS AND DATA ACQUISITIONS
Experiments were carried out in three times slots: in October 2009 (PJ2298) with the presence of the trenches, in July 2010 (PJ2414) and in August 2011 (PJ2298) without trenches. In July 2010 experiments are carried out for both mono- and bi-chromatic waves on water depths 0.4m, 0.5m and 0.6m and in August 2011 experiments with 0.8m water depth are carried out. In the experiment of October 2009 all above water depths are used.
Fig. 1: Layout of the experimental tank (not to scale) Table 1 Location of the wave probes in the OEB No of the
probe
Distance from the west wall (m)
Distance from the south wall (m) 1 26.891 13.475 2 27.221 13.475 3 27.731 13.475 4 27.731 12.955 5 27.731 12.635 6 27.731 14.825 7 27.731 18.365 8 29.081 13.475 9 32.621 13.475 10 41.621 13.475 11 2.0 12.635 12 2.0 13.475 13 2.0 18.365 14 10.744 13.475 P-7 P-1 P-2 P-3 P-6 P-4 P-5 P-14 P-11 P-9 P-10 P-8 P-12 P-13 13.475 Wave-makers 2m 10.744 South wall Beach West wall
5.0 INCIDENT WAVE CONDITIONS
In the experiments both mono- and bi-chromatic waves of different wave periods, wave heights and water depths are used. See Zaman and Mak (2007) and Zaman et al (2010) for several cases of mono- and bi-chromatic waves before the floor work. Table 2 to 5 show different incident wave conditions that we used in the experiments. In the tables below T1 and T2 are wave periods, H1 and H2 are the wave heights, h is the water depth, L is the wave length and h/L is the relative water depth.
Table 2a Mono-chromatic incident wave parameters (h=0.4m) T1 (s) H1 (m) h(m) h/L M4-1 2.145 0.08 0.4 0.100 M4-2 3.116 0.06 0.4 0.067 M4-3 4.105 0.06 0.4 0.050 M4-4 3.116 0.12 0.4 0.067 M4-5 4.105 0.16 0.4 0.050
Table 2b Bi-chromatic incident wave parameters (h=0.4m) T1 (s) h(m) H1 (m) T2 (s) H2 (m) h/L
B4-1 1.25 0.4 0.06 1.17 0.06 0.195
B4-2 1.55 0.4 0.06 1.45 0.06 0.146
B4-3 2.22 0.4 0.06 2.00 0.06 0.096
Table 3a Mono-chromatic incident wave parameters (h=0.5m) T1 (s) H1 (m) h(m) h/L
M5-1 1.977 0.04 0.5 0.125
M5-2 1.977 0.08 0.5 0.125
M5-3 2.829 0.06 0.5 0.083
M5-4 3.704 0.08 0.5 0.056
Table 3b Bi-chromatic incident wave parameters (h=0.5m) T1 (s) h(m) H1 (m) T2 (s) H2 (m) h/L
B5-1 1.25 0.4 0.06 1.17 0.06 0.195
B5-2 1.55 0.4 0.06 1.45 0.06 0.146
B5-3 2.22 0.4 0.06 2.00 0.06 0.096
Table 4a Mono-chromatic incident wave parameters (h=0.6m) T1 (s) H1 (m) h(m) h/L
M6-1 0.9 0.06 0.6 0.476
Table 4b Bi-chromatic incident wave parameters (h=0.6m) T1 (s) h(m) H1 (m) T2 (s) H2 (m) h/L
B6-1 1.55 0.4 0.06 1.45 0.06 0.146
B6-2 2.22 0.4 0.06 2.00 0.06 0.096
Table 5a Mono-chromatic incident wave parameters (h=0.8m) T1 (s) H1 (m) h(m) h/L
M8-1 2.370 0.06 0.8 0.133
M8-2 3.035 0.08 0.8 0.100
M8-3 4.105 0.06 0.8 0.071
Table 5b Bi-chromatic incident wave parameters (h=0.8m) T1 (s) h(m) H1 (m) T2 (s) H2 (m) h/L B8-1 1.00 0.8 0.06 0.90 0.06 0.516 B8-2 1.55 0.8 0.02 1.45 0.02 0.236 B8-3 1.55 0.8 0.08 1.45 0.08 0.236 B8-4 2.12 0.8 0.08 2.02 0.08 0.153 B8-5 2.22 0.8 0.08 2.00 0.08 0.144 B8-6 3.33 0.8 0.08 2.85 0.08 0.090
The bottom of the basin was flat and the blanking plates were deployed to cover the north beach.
6.0 DATA ANALYSES
We have analyzed two sets of data, one for before the floor work and the other one is after the floor work. Different wave conditions and water depths are considered as shown in Tables 2 to 5. All the data are compared and the results are shown in terms of surface elevations and wave energies across the wave tank at probes 5-4-3-6-7 (Probe-5, Probe-4, Probe-3, Probe-6 and Probe-7) and at probes 11-12-13-14 (Probe-11, Probe-12, Probe-13 and Probe-14) and along the tank at probes 1-2-3-8-9-10 (Probe-1, Probe-2, Probe-3, Probe-8, Probe-9 and Probe-10), see Fig. 1. Data at Probes 10, 11, 12, 13 and 14 are not available for 0.8m water depth.
6.1 COMPARISONS - 1: Monochromatic waves
Table 2a, 3a, 4a and 5a respectively, show the incident wave conditions for monochromatic waves, respectively on 0.4m (M4), 0.5m (M5), 0.6m (M6) and 0.8m (M8) water depths. All the above cases are run with and without trenches condition in front of the south and west wave makers of the OEB. Comparisons of the results are made between both cases, with and without trenches.
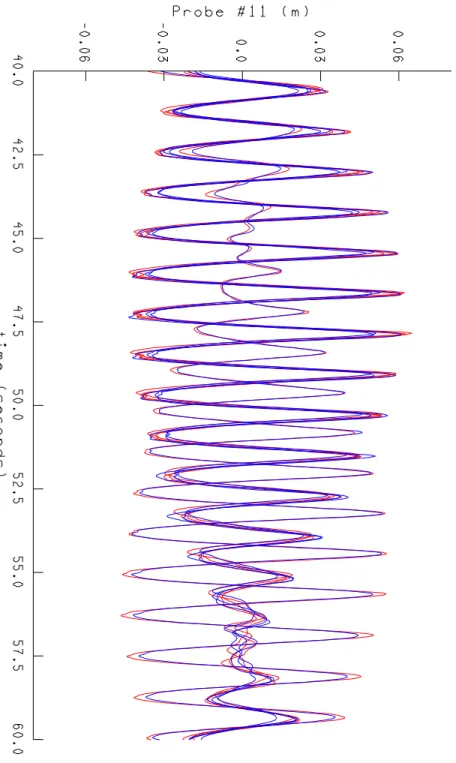
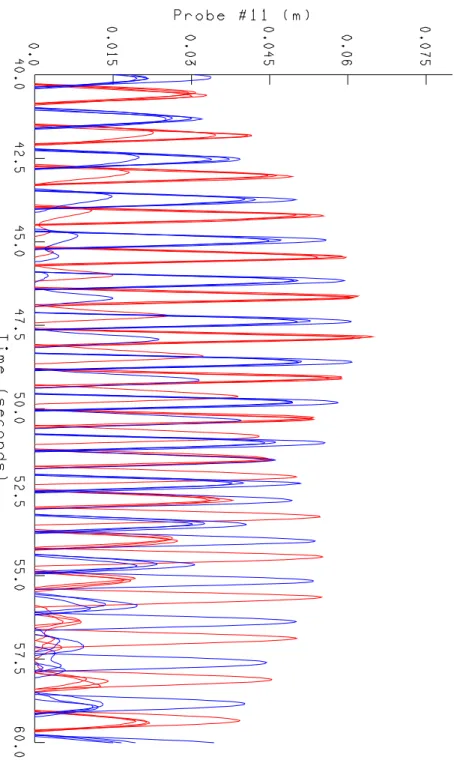
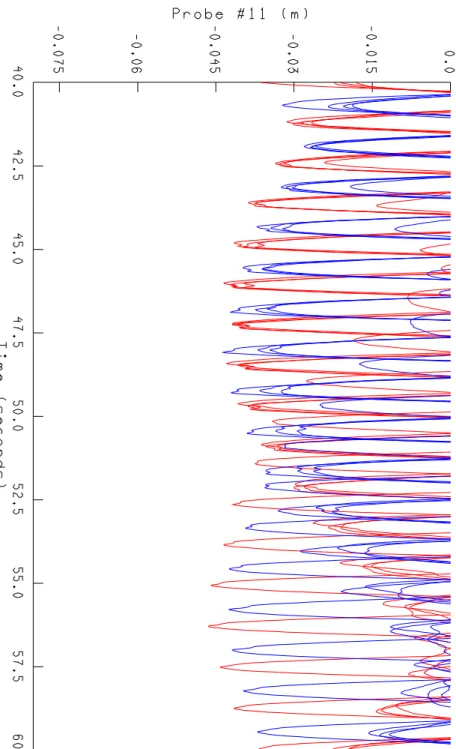
Figs. 2a to 6g show surface elevations for the mono-chromatic waves for 0.4m water depth mentioned in Table 2a. Measured water surface elevations, wave crests and troughs at across-tank probes 5-4-3-6-7 and 11-12-13-14 and at the along-tank probes
1-2-3-8-9-10 are plotted together to show the differences in the wave amplitudes after and before the floor work. On the other hand, Figs. 30a to 34l show the wave energies of the measured waves, isolated primary waves (PW), bounded waves (BW) and other unwanted second order free waves like, free waves1 (FW1) and free waves2 (FW2) at the above probes locations. FW1 is reproduced due to the mismatch of the boundary conditions at the wave paddle and FW2 appears due to the displacement of the wave paddle from its zero position.
Figs. 7a to 10g show surface elevations for the monochromatic waves for 0.5m water depth mentioned in Table 3a. Acquired water surface elevations, wave crests and troughs at across-tank probes 5-4-3-6-7 and 11-12-13-14 and at the along-tank probes 1-2-3-8-9-10 are plotted together to show the differences of the wave amplitudes after and before the floor work. On the other hand, Figs. 35a to 38l show the wave energies of the measured waves, PW, BW, FW1 and FW2 at the above probes locations.
Figs. 11a to 12g show surface elevations for the monochromatic waves for 0.6m water depth mentioned in Table 4a. Obtained water surface elevations, wave crests and troughs at across-tank probes 5-4-3-6-7 and 11-12-13-14 and at the along-tank probes 1-2-3-8-9-10 are plotted together to show the differences of the wave amplitudes after and before the floor work.
Figs. 13a to 15d show surface elevations for the monochromatic waves for 0.8m water depth mentioned in Table 5a. Measured water surface elevations, wave crests and troughs at across-tank probes 5-4-3-6-7 and 11-12-13-14 and at the along-tank probes 1-2-3-8-9-10 are plotted together to show the differences of the wave amplitudes after and before the floor work. On the other hand, Figs. 39a to 41h show the wave energies of the measured waves, PW, BW, FW1 and FW2 at the above probes locations. We don’t have enough data for other probes for this case.
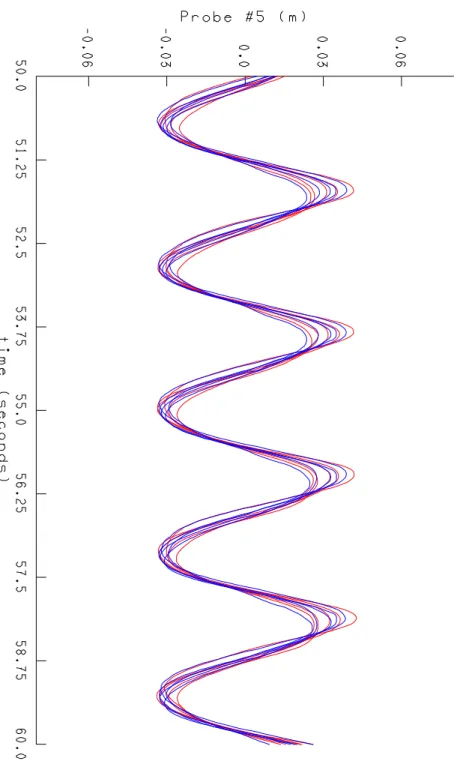
It is observed from the results that the smaller the relative water depth h L (i.e. shallower the wave) the better the wave quality after the floor work. For shallower wave at probes 5-4-3-6-7, one can see from the above results that the magnitude of the wave crests and wave troughs become closer after the floor work. It is also noted that the shallower the wave the better the wave energies distributions across the tank for measured, primary, bounded and free waves for after cases. It is also perceived that the second order wave components are reduced for shallow waves after the floor work.
6.2 COMPARISONS - 2: Bichromatic waves
Table 2b, 3b, 4b and 5b respectively, show the incident wave conditions for Bi-chromatic waves on 0.4m (B4), 0.5m (B5), 0.6m (B6) and 0.8m (B8) water depths. Here also the above cases are run for: with and without trenches conditions in front of the south and west wave makers of the OEB. Results are again compared between both cases, with and without trenches. Results are compared in terms of surface elevations and wave energies across the wave tank at probes 5-4-3-6-7 (Probe-5, Probe-4, Probe-3, Probe-6 and Probe-7) and at probes 11-12-13-14 (Probe-11, Probe-12, Probe-13 and Probe-14) and along the tank at probes 1-2-3-8-9-10 (Probe-1, Probe-2, Probe-3, Probe-8, Probe-9
and Probe-10), see Fig. 1. Data at probes 10, 11, 12, 13 and 14 are not available for 0.8m water depth.
Figs. 16a to 18g show surface elevations for the bi-chromatic waves for 0.4m water depth. The incident wave parameters are mentioned in Table 2b. Obtained water surface elevations, wave crests and troughs at across-tank probes 5-4-3-6-7, and 11-12-13-14 and at the along-tank probes 1-2-3-8-9-10 are plotted together to show the differences of the wave amplitudes after and before the floor works. On the other hand, Figs. 42a to 44l show the wave energies of the measured waves, PW, BW, FW1 and FW2 at the above probes locations. In the figures SPEC1 (0 to 1.0 Hz) and SPEC2 (0.9 to 1.5 Hz) are the wave energies that obtained from the measured wave data for given frequency ranges. Figs. 19a to 21g show surface elevations for the bi-chromatic waves for 0.5m water depth. The incident wave parameters are mentioned in Table 3b. Acquired water surface elevations, wave crests and troughs at across-tank probes 5-4-3-6-7, and 11-12-13-14 and at the along-tank probes 1-2-3-8-9-10 are plotted together to show the differences of the wave amplitudes after and before the floor works. On the other hand, Figs. 45a to 47l show the wave energies of the measured waves, PW, BW, FW1 and FW2 at the above probes locations.
Figs. 22a to 23g show surface elevations for the bi-chromatic waves for 0.6m water depth. The incident wave parameters are mentioned in Table 4b. Measured water surface elevations, wave crests and troughs at across-tank probes 5-4-3-6-7, and 11-12-13-14 and at the along-tank probes 1-2-3-8-9-10 are plotted together to show the differences of the wave amplitudes after and before the floor works. On the other hand, Figs. 48a to 49l show the wave energies of the measured waves, PW, BW, FW1 and FW2 at the above probes locations.
Figs. 24a to 29g show surface elevations for the bi-chromatic waves for 0.4m water depth. The incident wave parameters are mentioned in Table 5b. Obtained water surface elevations, wave crests and troughs at across-tank probes 5-4-3-6-7 and at the along-tank probes 1-2-3-8-9 are plotted together to show the differences of the wave amplitudes after and before the floor works. On the other hand, Figs. 50a to 55l show the wave energies of the measured waves, PW, BW, FW1 and FW2 at the above probes locations.
7.0 LWAVE UTILIZATION
A NRC-IOT computer code LWAVE that can split a measured surface elevation data set into its component waves is used for the analysis. This code is utilized to isolate the primary waves, bounded second order waves and unwanted free waves from the raw measured data at every probe location. LWAVE can only isolate the component waves form the measured wave profiles. Another computer code called VSD is utilized to compute the energies of the individual wave component. More information and mathematical derivations on LWAVE can be found in Sand (1982), Barthel et al (1983), Sand and Mansard (1986) and Mansard et al (1987).
8.0 RESULTS
In this experiment 4 different water depths (h= 0.4m, 0.5m, 0.6m and 0.8m) were used. The incident wave parameters are shown in Table 2 to Table 5 for mono- and bi-chromatic waves.
Results are compared between the measured wave data, before and after the floor work in OEB.
Appendix-I shows surface elevations, wave crests and wave troughs for monochromatic waves for all water depths at different probe locations.
Appendix-II shows surface elevations, wave crests and wave troughs for bi-chromatic waves for all water depths at different probe locations.
Appendix-III shows wave energies distributions at the across and at the along the tank probes for mono-chromatic waves on all water depths.
Appendix-IV shows wave energies distributions at the across and at the along the tank probes for bi-chromatic waves on all water depths.
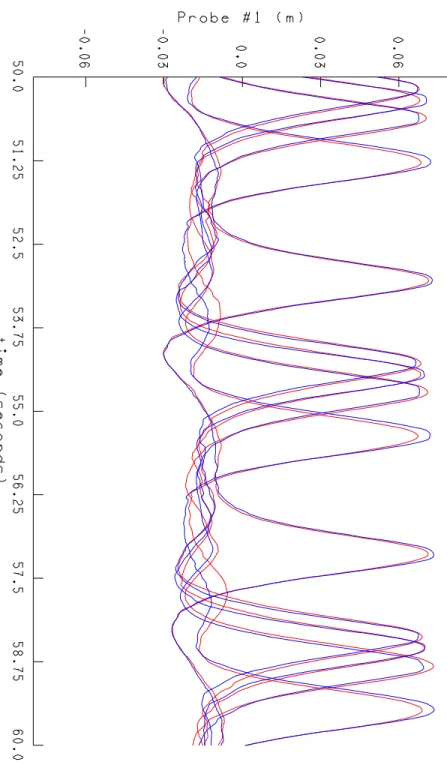
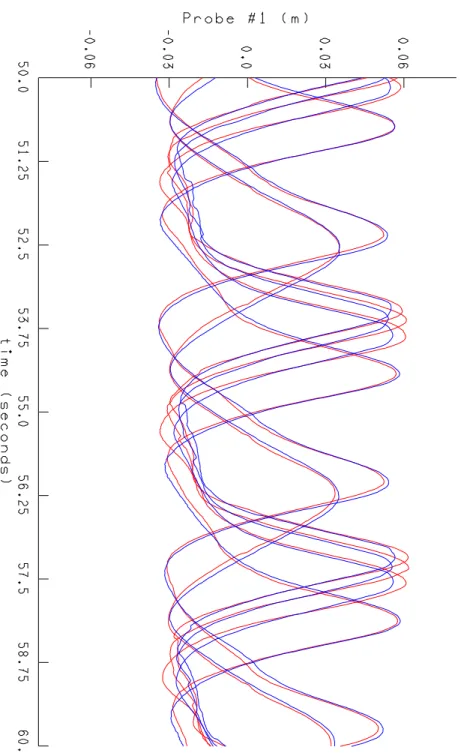
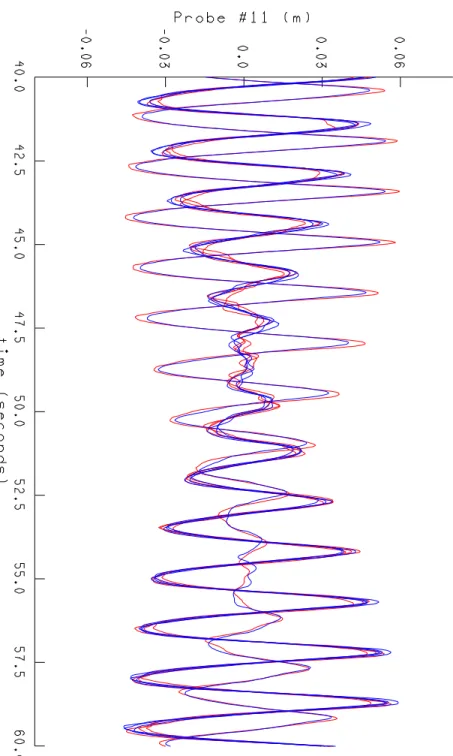
Time lag can be observed in the plots that show surface elevations at different probe locations along the wave tank (Probes 1-2-3-8-9-10), see Figs. 2b, 16b, etc for example. In some cases probes close (P-10 for example) to the beach show larger wave amplitudes due to the contamination by the reflected waves from the beach.
In several cases probes 6-7 show larger wave amplitude than other probes in the probes 5-4-3-6-7 array. This might be the reflection from the blanking wall [a solid metal wall is used to cover the north side of the basin]. See Fig. 1.
9.0 CONCLUSIONS
It is expected that when the floor of the OEB is completely flat then the wave quality for shallower waves would improve. The aim of this report is to identify and document the difference (before and after) if any, in the wave quality for wide range of waves. We have summarized this information. The presented figures are for different wave conditions and water depths to cover a wide range so that a reader can get a quick idea of the difference (before and after) for a particular wave of interest.
Comparisons of the results for surface elevations and energy propagations between the measured data before and after the floor work are shown. Deep water wave (h L0.5) will not be affected by the floor and the wave starts to feel the bottom when the relative water depth (h L) is less than 0.5. So the smaller the value of h Lmeans more the effects of the bottom on the propagating waves. It is observed from the results that the shallower the wave the better the wave quality after the floor work. For shallower wave at probes 5-4-3-6-7, one can see from the results that the magnitude of the wave crests and wave troughs become closer in after the floor work conditions. It is also perceived that the shallower the wave the better the wave energies distributions across the tank for primary, bounded and free waves for after cases. It is also found that the second order wave components are reduced for shallower waves in after the floor work conditions.
REFERENCES
Barthel V., Mansard, E.P.D., Sand, S.E. and Vis, F.C. (1983): Group bounded long waves in physical models, Ocen Eng. 10(4).
Mansard, E.P.D. and Sand, S.E. (1986): Description and production of higher harmonic waves, TR-HY-012 (NRC-25339).
Mansard, E.P.D., Sand, S.E. and Klinting, P. (1987): Sub- and superharmonics in natural waves Proc. Offshore Mechanics and Arctic Engng, Houston, Texas (1987), pp. 83–89. Sand, S. E. (1982): Long wave problems in laboratory models, Proceedings of the ASCE, J. of Waterway, Port, coast. And Ocn. Div. 198 (WW4).
Zaman, M. H. and L. Mak (2007): Second order wave generation technique in the laboratory, 26th Int. Conf. on offshore Mech. and Arctic Eng. (OMAE-2007), American Society of Mechanical Engineers (ASME), San Diego, USA, on CD-ROM.
Zaman, M. H., Peng, H., Baddour, E., Spencer, D. and Mckay, S. (2010): Identifications of spurious waves in the wave tank with shallow water, 29th Int. Conf. on offshore Mech. and Arctic Eng. (OMAE-2010), American Society of Mechanical Engineers (ASME), Shanghai, China, on CD-ROM.
APPENDIX – I
Surface elevations, wave crests and wave troughs for mono-chromatic waves Probes array:
Probes: 5-4-3-6-7 Probes: 11-12-13-14 Probes 1-2-3-8-9-10
Fig. 2a: Surface elevations at Probes: 5-4-3-6-7 M4-1 : REGP4_H0P08_T2P145
Fig. 2b: Surface elevations at Probes: 1-2-3-8-9-10 M4-1 : REGP4_H0P08_T2P145
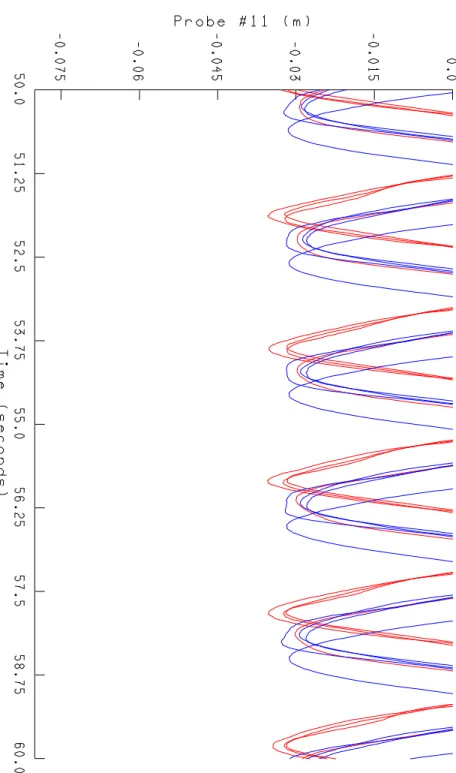
Fig. 2c: Surface elevations at Probes: 11-12-13-14 M4-1 : REGP4_H0P08_T2P145
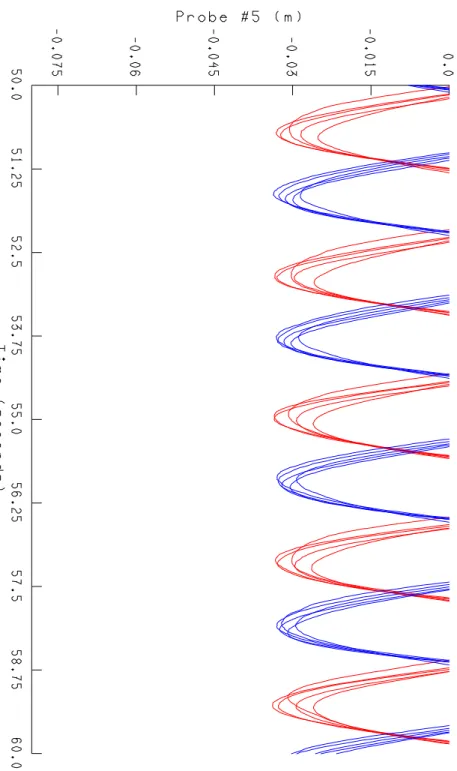
Fig. 2d: Surface elevations at Probes: 5-4-3-6-7 (Crest) M4-1 : REGP4_H0P08_T2P145
Fig. 2e: Surface elevations at Probes: 5-4-3-6-7 (Trough) M4-1 : REGP4_H0P08_T2P145
Fig. 2f: Surface elevations at Probes: 11-12-13-14 (Crest) M4-1 : REGP4_H0P08_T2P145
Fig. 2g: Surface elevations at Probes: 11-12-13-14 (Trough) M4-1 : REGP4_H0P08_T2P145
Fig. 3a: Surface elevations at Probes: 5-4-3-6-7 M4-2 : REGP4_H0P06_T3P116
Fig. 3b: Surface elevations at Probes: 1-2-3-8-9-10 M4-2 : REGP4_H0P06_T3P116
Fig. 3c: Surface elevations at Probes: 11-12-13-14 M4-2 : REGP4_H0P06_T3P116
Fig. 3d: Surface elevations at Probes: 5-4-3-6-7 (Crest) M4-2 : REGP4_H0P06_T3P116
Fig. 3e: Surface elevations at Probes: 5-4-3-6-7 (Trough) M4-2 : REGP4_H0P06_T3P116
Fig. 3f: Surface elevations at Probes: 11-12-13-14 (Crest) M4-2 : REGP4_H0P06_T3P116
Fig. 3g: Surface elevations at Probes: 11-12-13-14 (Trough) M4-2 : REGP4_H0P06_T3P116
Fig. 4a: Surface elevations at Probes: 5-4-3-6-7 M4-3 : REGP4_H0P08_T4P105
Fig. 4b: Surface elevations at Probes: 1-2-3-8-9-10 M4-3 : REGP4_H0P08_T4P105
Fig. 4c: Surface elevations at Probes: 11-12-13-14 M4-3 : REGP4_H0P08_T4P105
Fig. 4d: Surface elevations at Probes: 5-4-3-6-7 (Crest) M4-3 : REGP4_H0P08_T4P105
Fig. 4e: Surface elevations at Probes: 5, 4, 3, 6, 7 (Trough) M4-3 : REGP4_H0P08_T4P105
Fig. 4f: Surface elevations at Probes: 11-12-13-14 (Crest) M4-3 : REGP4_H0P06_T3P116
Fig. 4g: Surface elevations at Probes: 11-12-13-14 (trough) M4-3 : REGP4_H0P08_T4P105
Fig. 5a: Surface elevations at Probes: 5-4-3-6-7 M4-4 : REGP4_H0P12_T3P116
Fig. 5b: Surface elevations at Probes: 1-2-3-8-9-10 M4-4 : REGP4_H0P12_T3P116
Fig. 5c: Surface elevations at Probes: 11-12-13-14 M4-4 : REGP4_H0P12_T3P116
Fig. 5d: Surface elevations at Probes: 5-4-3-6-7 (Crest) M4-4 : REGP4_H0P12_T3P116
Fig. 5e: Surface elevations at Probes: 5-4-3-6-7 (Trough) M4-4 : REGP4_H0P12_T3P116
Fig. 5f: Surface elevations at Probes: 11-12-13-14 (Crest) M4-4 : REGP4_H0P12_T3P116
Fig. 5g: Surface elevations at Probes: 11-12-13-14 (Trough) M4-4 : REGP4_H0P12_T3P116
Fig. 6a: Surface elevations at Probes: 5-4-3-6-7 M4-5 : REGP4_H0P16_T4P105
Fig. 6b: Surface elevations at Probes: 1-2-3-8-9-10 M4-5 : REGP4_H0P16_T4P105
Fig. 6c: Surface elevations at Probes: 11-12-13-14 M4-5 : REGP4_H0P16_T4P105
Fig. 6d: Surface elevations at Probes: 5-4-3-6-7 (Crest) M4-5 : REGP4_H0P16_T4P105
Fig. 6e: Surface elevations at Probes: 5-4-3-6-7 (Trough) M4-5 : REGP4_H0P16_T4P105
Fig. 6f: Surface elevations at Probes: 11-12-13-14 (Crest) M4-5 : REGP4_H0P16_T4P105
Fig. 6g: Surface elevations at Probes: 11-12-13-14 (Trough) M4-5 : REGP4_H0P16_T4P105
Fig. 7a: Surface elevations at Probes: 5-4-3-6-7 M5-1 : REGP5_H0P04_T1P977
Fig. 7b: Surface elevations at Probes: 1-2-3-8-9-10 M5-1 : REGP5_H0P04_T1P977
Fig. 7c: Surface elevations at Probes: 11-12-13-14 M5-1 : REGP5_H0P04_T1P977
Fig. 7d: Surface elevations at Probes: 5-4-3-6-7 (Crest) M5-1 : REGP5_H0P04_T1P977
Fig. 7e: Surface elevations at Probes: 5-4-3-6-7 (Trough) M5-1 : REGP5_H0P04_T1P977
Fig. 7f: Surface elevations at Probes: 11-12-13-14 (Crest) M5-1 : REGP5_H0P04_T1P977
Fig. 7g: Surface elevations at Probes: 11-12-13-14 (Trough) M5-1 : REGP5_H0P04_T1P977
Fig. 8a: Surface elevations at Probes: 5-4-3-6-7 M5-2 : REGP5_H0P08_T1P977
Fig. 8b: Surface elevations at Probes: 1-2-3-8-9-10 M5-2 : REGP5_H0P08_T1P977
Fig. 8c: Surface elevations at Probes: 11-12-13-14 M5-2 : REGP5_H0P08_T1P977
Fig. 8d: Surface elevations at Probes: 5-4-3-6-7 (Crest) M5-2 : REGP5_H0P08_T1P977
Fig. 8e: Surface elevations at Probes: 5-4-3-6-7 (Trough) M5-2 : REGP5_H0P08_T1P977
Fig. 8f: Surface elevations at Probes: 11-12-13-14 (Crest) M5-2 : REGP5_H0P08_T1P977
Fig. 8g: Surface elevations at Probes: 11-12-13-14 (Trough) M5-2 : REGP5_H0P08_T1P977
Fig. 9a: Surface elevations at Probes: 5-4-3-6-7 M5-3 : REGP5_H0P06_T2P829
Fig. 9b: Surface elevations at Probes: 1-2-3-8-9-10 M5-3 : REGP5_H0P06_T2P829
Fig. 9c: Surface elevations at Probes: 11-12-13-14 M5-3 : REGP5_H0P06_T2P829
Fig. 9d: Surface elevations at Probes: 5-4-3-6-7 (Crest) M5-3 : REGP5_H0P06_T2P829
Fig. 9e: Surface elevations at Probes: 5-4-3-6-7 (Trough) M5-3 : REGP5_H0P06_T2P829
Fig. 9f: Surface elevations at Probes: 11-12-13-14 (Crest) M5-3 : REGP5_H0P06_T2P829
Fig. 9g: Surface elevations at Probes: 11-12-13-14 (Trough) M5-3 : REGP5_H0P06_T2P829
Fig. 10a: Surface elevations at Probes: 5-4-3-6-7 M5-4 : REGP5_H0P08_T3P704
Fig. 10b: Surface elevations at Probes: 1-2-3-8-9-10 M5-4 : REGP5_H0P08_T3P704
Fig. 10c: Surface elevations at Probes: 11-12-13-14 M5-4 : REGP5_H0P08_T3P704
Fig. 10d: Surface elevations at Probes: 5-4-3-6-7 (Crest) M5-4 : REGP5_H0P08_T3P704
Fig. 10e: Surface elevations at Probes: 5-4-3-6-7 (Trough) M5-4 : REGP5_H0P08_T3P704
Fig. 10f: Surface elevations at Probes: 11-12-13-14 (Crest) M5-4 : REGP5_H0P08_T3P704
Fig. 10g: Surface elevations at Probes: 11-12-13-14 (Trough) M5-4 : REGP5_H0P08_T3P704
Fig. 11a: Surface elevations at Probes: 5-4-3-6-7 M6-1 : REGP6_H0P06_T0P9
Fig. 11b: Surface elevations at Probes: 1-2-3-8-9-10 M6-1 : REGP6_H0P06_T0P9
Fig. 11c: Surface elevations at Probes: 11-12-13-14 M6-1 : REGP6_H0P06_T0P9
Fig. 11d: Surface elevations at Probes: 5-4-3-6-7 (Crest) M6-1 : REGP6_H0P06_T0P9
Fig. 11e: Surface elevations at Probes: 5-4-3-6-7 (Trough) M6-1 : REGP6_H0P06_T0P9
Fig. 11f: Surface elevations at Probes: 11-12-13-14 (Crest) M6-1 : REGP6_H0P06_T0P9
Fig. 11g: Surface elevations at Probes: 11-12-13-14 (Trough) M6-1 : REGP6_H0P06_T0P9
Fig. 12a: Surface elevations at Probes: 5-4-3-6-7 M6-1 : REGP6_H0P06_T1P0
Fig. 12b: Surface elevations at Probes: 1-2-3-8-9-10 M6-1 : REGP6_H0P06_T1P0
Fig. 12c: Surface elevations at Probes: 11-12-13-14 M6-1 : REGP6_H0P06_T1P0
Fig. 12d: Surface elevations at Probes: 5-4-3-6-7 (Crest) M6-1 : REGP6_H0P06_T1P0
Fig. 12e: Surface elevations at Probes: 5-4-3-6-7 (Trough) M6-1 : REGP6_H0P06_T1P0
Fig. 12f: Surface elevations at Probes: 11-12-13-14 (Crest) M6-1 : REGP6_H0P06_T1P0
Fig. 12g: Surface elevations at Probes: 11-12-13-14 (Trough) M6-1 : REGP6_H0P06_T1P0
Fig. 13a: Surface elevations at Probes: 5-4-3-6-7 M8-1 : REGP8_H0P06_T2P370
Fig. 13b: Surface elevations at Probes: 1-2-3-8-9 M8-1 : REGP8_H0P06_T2P370
Fig. 13c: Surface elevations at Probes: 5-4-3-6-7 (Crest) M8-1 : REGP8_H0P06_T2P370
Fig. 13d: Surface elevations at Probes: 5-4-3-6-7 (Trough) M8-1 : REGP8_H0P06_T2P370
Fig. 14a: Surface elevations at Probes: 5-4-3-6-7 M8-2 : REGP8_H0P08_T3P035
Fig. 14b: Surface elevations at Probes: 1-2-3-8-9 M8-2 : REGP8_H0P08_T3P035
Fig. 14c: Surface elevations at Probes: 5-4-3-6-7 (Crest) M8-2 : REGP8_H0P08_T3P035
Fig. 14d: Surface elevations at Probes: 5-4-3-6-7 (Trough) M8-2 : REGP8_H0P08_T3P035
Fig. 15a: Surface elevations at Probes: 5-4-3-6-7 M8-3 : REGP8_H0P08_T4P105
Fig. 15b: Surface elevations at Probes: 1-2-3-8-9 M8-3 : REGP8_H0P08_T4P105
Fig. 15c: Surface elevations at Probes: 5-4-3-6-7 (Crest) M8-3 : REGP8_H0P08_T4P105
Fig. 15d: Surface elevations at Probes: 5-4-3-6-7 (Trough) M8-3 : REGP8_H0P08_T4P105
APPENDIX – II
Surface elevations, wave crests and wave troughs for bi-chromatic waves Probes array:
Probes: 5-4-3-6-7 Probes: 11-12-13-14 Probes 1-2-3-8-9-10
Fig. 16a: Surface elevations at Probes: 5-4-3-6-7 B4-1 : BIP4_H0P06_T1P25_T1P17
Fig. 16b: Surface elevations at Probes: 1-2-3-8-9-10 B4-1 : BIP4_H0P06_T1P25_T1P17
Fig. 16c: Surface elevations at Probes: 11-12-13-14 B4-1 : BIP4_H0P06_T1P25_T1P17
Fig. 16d: Surface elevations at Probes: 5-4-3-6-7 (Crest) B4-1 : BIP4_H0P06_T1P25_T1P17
Fig. 16e: Surface elevations at Probes: 5-4-3-6-7 (Trough) B4-1 : BIP4_H0P06_T1P25_T1P17
Fig. 16f: Surface elevations at Probes: 11-12-13-14 (Crest) B4-1 : BIP4_H0P06_T1P25_T1P17
Fig. 16g: Surface elevations at Probes: 11-12-13-14 (Trough) B4-1 : BIP4_H0P06_T1P25_T1P17
Fig. 17a: Surface elevations at Probes: 5-4-3-6-7 B4-2 : BIP4_H0P06_T1P55_T1P45
Fig. 17b: Surface elevations at Probes: 1-2-3-8-9-10 B4-2 : BIP4_H0P06_ T1P55_T1P45
Fig. 17c: Surface elevations at Probes: 11-12-13-14 B4-2 : BIP4_H0P06_ T1P55_T1P45
Fig. 17d: Surface elevations at Probes: 5-4-3-6-7 (Crest) B4-2 : BIP4_H0P06_ T1P55_T1P45
Fig. 17e: Surface elevations at Probes: 5-4-3-6-7 (Trough) B4-2 : BIP4_H0P06_ T1P55_T1P45
Fig. 17f: Surface elevations at Probes: 11-12-13-14 (Crest) B4-2 : BIP4_H0P06_ T1P55_T1P45
Fig. 17g: Surface elevations at Probes: 11-12-13-14 (Trough) B4-2 : BIP4_H0P06_ T1P55_T1P45
Fig. 18a: Surface elevations at Probes: 5-4-3-6-7 B4-3 : BIP4_H0P06_T2P22_T2P0
Fig. 18b: Surface elevations at Probes: 1-2-3-8-9-10 B4-3 : BIP4_H0P06_ T2P22_T2P0
Fig. 18c: Surface elevations at Probes: 11-12-13-14 B4-3 : BIP4_H0P06_ T2P22_T2P0
Fig. 18d: Surface elevations at Probes: 5-4-3-6-7 (Crest) B4-3 : BIP4_H0P06_ T2P22_T2P0
Fig. 18e: Surface elevations at Probes: 5-4-3-6-7 (Trough) B4-3 : BIP4_H0P06_ T2P22_T2P0
Fig. 18f: Surface elevations at Probes: 11-12-13-14 (Crest) B4-3 : BIP4_H0P06_ T2P22_T2P0
Fig. 18g: Surface elevations at Probes: 11-12-13-14 (Trough) B4-3 : BIP4_H0P06_ T2P22_T2P0
Fig. 19a: Surface elevations at Probes: 5-4-3-6-7 B5-1 : BIP5_H0P06_T1P25_T1P20
Fig. 19b: Surface elevations at Probes: 1-2-3-8-9-10 B5-1 : BIP5_H0P06_T1P25_T1P20
Fig. 19c: Surface elevations at Probes: 11-12-13-14 B5-1 : BIP5_H0P06_T1P25_T1P20
Fig. 19d: Surface elevations at Probes: 5-4-3-6-7 (Crest) B5-1 : BIP5_H0P06_T1P25_T1P20
Fig. 19e: Surface elevations at Probes: 5-4-3-6-7 (Trough) B5-1 : BIP5_H0P06_T1P25_T1P20
Fig. 19f: Surface elevations at Probes: 11-12-13-14 (Crest) B5-1 : BIP5_H0P06_T1P25_T1P20
Fig. 19g: Surface elevations at Probes: 11-12-13-14 (Trough) B5-1 : BIP5_H0P06_T1P25_T1P20
Fig. 20a: Surface elevations at Probes: 5-4-3-6-7 B5-2 : BIP5_H0P06_ T1P55_T1P45
Fig. 20b: Surface elevations at Probes: 1-2-3-8-9-10 B5-2 : BIP5_H0P06_T1P55_T1P45
Fig. 20c: Surface elevations at Probes: 11-12-13-14 B5-2 : BIP5_H0P06_T1P55_T1P45
Fig. 20d: Surface elevations at Probes: 5-4-3-6-7 (Crest) B5-2 : BIP5_H0P06_T1P55_T1P45
Fig. 20e: Surface elevations at Probes: 5-4-3-6-7 (Trough) B5-2 : BIP5_H0P06_T1P55_T1P45
Fig. 20f: Surface elevations at Probes: 11-12-13-14 (Crest) B5-2 : BIP5_H0P06_ T1P55_T1P45
Fig. 20g: Surface elevations at Probes: 11-12-13-14 (Trough) B5-2 : BIP5_H0P06_T2P22_T2P0
Fig. 21a: Surface elevations at Probes: 5-4-3-6-7 B5-3 : BIP5_H0P06_T2P22_T2P0
Fig. 21b: Surface elevations at Probes: 1-2-3-8-9-10 B5-3 : BIP5_H0P06_T2P22_T2P0
Fig. 21c: Surface elevations at Probes: 11-12-13-14 B5-3 : BIP5_H0P06_T2P22_T2P0
Fig. 21d: Surface elevations at Probes: 5-4-3-6-7 (Crest) B5-3 : BIP5_H0P06_T2P22_T2P0
Fig. 21e: Surface elevations at Probes: 5-4-3-6-7 (Trough) B5-3 : BIP5_H0P06_T2P22_T2P0
Fig. 21f: Surface elevations at Probes: 11-12-13-14 (Crest) B5-3 : BIP5_H0P06_T2P22_T2P0
Fig. 21g: Surface elevations at Probes: 11-12-13-14 (Trough) B5-3 : BIP5_H0P06_T2P22_T2P0
Fig. 22a: Surface elevations at Probes: 5-4-3-6-7 B6-2 : BIP6_H0P06_ T1P55_T1P45
Fig. 22b: Surface elevations at Probes: 1-2-3-8-9-10 B6-2 : BIP6_H0P06_ T1P55_T1P45
Fig. 22c: Surface elevations at Probes: 11-12-13-14 B6-2 : BIP6_H0P06_ T1P55_T1P45
Fig. 22d: Surface elevations at Probes: 5-4-3-6-7 (Crest) B6-2 : BIP6_H0P06_ T1P55_T1P45
Fig. 22e: Surface elevations at Probes: 5-4-3-6-7 (Trough) B6-2 : BIP6_H0P06_ T1P55_T1P45
Fig. 22f: Surface elevations at Probes: 11-12-13-14 (Crest) B6-2 : BIP6_H0P06_ T1P55_T1P45
Fig. 22g: Surface elevations at Probes: 11-12-13-14 (Trough) B6-2 : BIP6_H0P06_T2P22_T2P0
Fig. 23a: Surface elevations at Probes: 5-4-3-6-7 B6-3 : BIP6_H0P06_ T2P22_T2P0
Fig. 23b: Surface elevations at Probes: 1-2-3-8-9-10 B6-3 : BIP6_H0P06_ T2P22_T2P0
Fig. 23c: Surface elevations at Probes: X, 12, 13, 14 B6-3 : BIP6_H0P06_ T2P22_T2P0
Fig. 23d: Surface elevations at Probes: 5-4-3-6-7 (Crest) B6-3 : BIP6_H0P06_ T2P22_T2P0
Fig. 23e: Surface elevations at Probes: 5-4-3-6-7 (Trough) B6-3 : BIP6_H0P06_ T2P22_T2P0
Fig. 23f: Surface elevations at Probes: 11-12-13-14 (Crest) B6-3 : BIP6_H0P06_ T2P22_T2P0
Fig. 23g: Surface elevations at Probes: 11-12-13-14 (Trough) B6-3 : BIP6_H0P06_ T2P22_T2P0
Fig. 24a: Surface elevations at Probes: 5-4-3-6-7 B8-1 : BIP8_H0P06_T1P0_T0P9
Fig. 24b: Surface elevations at Probes: 1-2-3-8-9 B8-1 : BIP8_H0P06_T1P0_T0P9
Fig. 24c: Surface elevations at Probes: 5-4-3-6-7 (Crest) B8-1 : BIP8_H0P06_T1P0_T0P9
Fig. 24d: Surface elevations at Probes: 5-4-3-6-7 (Trough) B8-1 : BIP8_H0P06_T1P0_T0P9
Fig. 25a: Surface elevations at Probes: 5-4-3-6-7 B8-2 : BIP8_H0P02_T1P55_T1P45
Fig. 25b: Surface elevations at Probes: 1-2-3-8-9 B8-2 : BIP8_H0P02_T1P55_T1P45
Fig. 25c: Surface elevations at Probes: 5-4-3-6-7 (Crest) B8-2 : BIP8_H0P02_T1P55_T1P45
Fig. 25d: Surface elevations at Probes: 5-4-3-6-7 (Trough) B8-2 : BIP8_H0P02_T1P55_T1P45
Fig. 26a: Surface elevations at Probes: 5-4-3-6-7 B8-3 : BIP8_H0P08_T1P55_T1P45
Fig. 26b: Surface elevations at Probes: 1-2-3-8-9 B8-3 : BIP8_H0P08_T1P55_T1P45
Fig. 26c: Surface elevations at Probes: 5-4-3-6-7 (Crest) B8-3 : BIP8_H0P08_T1P55_T1P45
Fig. 26d: Surface elevations at Probes: 5-4-3-6-7 (Trough) B8-3 : BIP8_H0P08_T1P55_T1P45
Fig. 27a: Surface elevations at Probes: 5-4-3-6-7 B8-4 : BIP8_H0P06_T2P12_T2P02
Fig. 27b: Surface elevations at Probes: 1-2-3-8-9 B8-4 : BIP8_H0P06_T2P12_T2P02
Fig. 27c: Surface elevations at Probes: 5-4-3-6-7 (Crest) B8-4 : BIP8_H0P06_T2P12_T2P02
Fig. 27d: Surface elevations at Probes: 5-4-3-6-7 (Trough) B8-4 : BIP8_H0P06_T2P12_T2P02
Fig. 28a: Surface elevations at Probes: 5-4-3-6-7 B8-5 : BIP8_H0P08_T2P22_T2P0
Fig. 28b: Surface elevations at Probes: 1-2-3-8-9 B8-5 : BIP8_H0P08_T2P22_T2P0
Fig. 28c: Surface elevations at Probes: 5-4-3-6-7 (Crest) B8-5 : BIP8_H0P08_T2P22_T2P0
Fig. 28d: Surface elevations at Probes: 5-4-3-6-7 (Trough) B8-5 : BIP8_H0P08_T2P22_T2P0
Fig. 29a: Surface elevations at Probes: 5-4-3-6-7 B8-5 : BIP8_H0P08_T3P33_T2P85
Fig. 29b: Surface elevations at Probes: 1-2-3-8-9 B8-5 : BIP8_H0P08_T3P33_T2P85
Fig. 29c: Surface elevations at Probes: 5-4-3-6-7 (Crest) B8-5 : BIP8_H0P08_T3P33_T2P85
Fig. 29d: Surface elevations at Probes: 5-4-3-6-7 (Trough) B8-5 : BIP8_H0P08_T3P33_T2P85
APPENDIX - III
Energy distributions for measured waves (SPEC1 and SPEC2), isolated Primary Waves (PW), Bounded Wave (BW), Free Wave-1 (FW1) and Free Wave-2 (FW2) for
mono-chromatic waves Probes array: Probes: 5-4-3-6-7
Probes: 11-12-13 Probes 1-2-3-8-9-10
0 0.0005 0.001 0.0015 0.002 0 1 2 3 4 5 6 Probes 5, 4, 3, 6, 7 S (f) [m 2 /H z ]
SPEC1 (before) SPEC1 (after)
Fig. 30a: Cross-tank energy distribution for measured waves (0 to 1.0 Hz) M4-1: REGP4_H0P08_T2P145 0.00E+00 1.00E-05 2.00E-05 3.00E-05 4.00E-05 5.00E-05 0 1 2 3 4 5 6 Probes 5, 4, 3, 6, 7 S (f) [m 2 /H z ]
SPEC2 (before) SPEC2 (after)
Fig. 30b: Cross-tank energy distribution for measured waves (0.9 to 1.5 Hz) M4-1: REGP4_H0P08_T2P145
Probe-5
Probe-4 Probe-3 Probe-6
Probe-7 Probe-5
Probe-4 Probe-3
Probe-6
0 0.0005 0.001 0.0015 0.002 0 1 2 3 4 5 6 Probes 5, 4, 3, 6, 7 S (f) [m 2 /H z ] PW (before) PW (after)
Fig. 30c: Cross-tank energy distribution for isolated principal waves M4-1: REGP4_H0P08_T2P145 0.00E+00 1.00E-06 2.00E-06 3.00E-06 4.00E-06 5.00E-06 0 1 2 3 4 5 6 Probes 5, 4, 3, 6, 7 S( f) [m 2 /H z ]
BW (before) FW1 (before) FW2 (before) BW (after) FW1 (after) FW2 (after)
Fig. 30d: Cross-tank energy distribution for isolated second-order waves M4-1: REGP4_H0P08_T2P145 Probe-5 Probe-4 Probe-3 Probe-6 Probe-7 Probe-5 Probe-4 Probe-3 Probe-6 Probe-7
0 0.0005 0.001 0.0015 0.002 0 1 2 3 4 5 6 7 Probes 1, 2, 3, 8, 9, 10 S 9 f) [m 2 /H z ]
SPEC1 (before) SPEC1 (after)
Fig. 30e: Along-tank energy distribution for measured waves (0 to 1.0 Hz) M4-1: REGP4_H0P08_T2P145 0.00E+00 2.50E-05 5.00E-05 7.50E-05 1.00E-04 0 1 2 3 4 5 6 7 Probes 1, 2, 3, 8, 9, 10 S (f) [m 2 /H z ]
SPEC2 (before) SPEC2 (after)
Fig. 30f: Along-tank energy distribution for measured waves (0.9 to 1.5 Hz) M4-1: REGP4_H0P08_T2P145 Probe-1 Probe-2 Probe-3 Probe-8 Probe-9 Probe-10
Probe-1 Probe-2 Probe-3
Probe-8
Probe-9
0 0.0005 0.001 0.0015 0.002 0 1 2 3 4 5 6 7 Probes 1, 2, 3, 8, 9, 10 S (f) [m 2 /H z ] PW (before) PW (after)
Fig. 30g: Along-tank energy distribution for isolated principal waves M4-1: REGP4_H0P08_T2P145 0.00E+00 1.00E-06 2.00E-06 3.00E-06 4.00E-06 5.00E-06 0 1 2 3 4 5 6 7 Probes 1, 2, 3, 8, 9, 10 S (f) [m 2 /H z ]
BW (before) FW1 (before) FW2 (before) BW (after) FW1 (after) FW2 (after)
Fig. 30h: Along-tank energy distribution for isolated second-order waves M4-1: REGP4_H0P08_T2P145 Probe-1 Probe-2 Probe-3 Probe-8 Probe-9 Probe-10 Probe-1 Probe-2 Probe-3 Probe-8 Probe-9 Probe-10
0 0.0005 0.001 0.0015 0.002 0 1 2 3 4 Probes 11, 12, 13 S (f) [m 2 /H z ]
SPEC1 (before) SPEC1 (after)
Fig. 30i: Cross-tank energy distribution for measured waves (0 to 1.0 Hz) M4-1: REGP4_H0P08_T2P145 0.00E+00 1.00E-05 2.00E-05 3.00E-05 4.00E-05 5.00E-05 0 1 2 3 4 Probes 11, 12, 13 S (f) [m 2 /H z ]
SPEC2 (before) SPEC2 (after)
Fig. 30j: Cross-tank energy distribution for measured waves (0.9 to 1.5 Hz) M4-1: REGP4_H0P08_T2P145
Probe-11 Probe-12
Probe-13
Probe-11 Probe-12
0 0.0005 0.001 0.0015 0.002 0 1 2 3 4 Probes 11, 12, 13 S (f) [m 2 /H z ] PW (before) PW (after)
Fig. 30k: Cross-tank energy distribution for isolated principal waves M4-1: REGP4_H0P08_T2P145 0.00E+00 2.50E-06 5.00E-06 7.50E-06 1.00E-05 0 1 2 3 4 Probes 11, 12, 13 S( f) [m 2 /H z ]
BW (before) FW1 (before) FW2 (before) BW (after) FW1 (after) FW2 (after)
Fig. 30l: Cross-tank energy distribution for isolated second-order waves M4-1: REGP4_H0P08_T2P145
Probe-11 Probe-12
Probe-13
Probe-11 Probe-12
0 0.00025 0.0005 0.00075 0.001 0 1 2 3 4 5 6 Probes 5, 4, 3, 6, 7 S (f) [m 2 /H z ]
SPEC1 (before) SPEC1 (after)
Fig. 31a: Cross-tank energy distribution for measured waves (0 to 1.0 Hz) M4-2: REGP4_H0P06_T3P116 0.00E+00 2.50E-06 5.00E-06 7.50E-06 1.00E-05 0 1 2 3 4 5 6 Probes 5, 4, 3, 6, 7 S (f) [m 2 /H z ]
SPEC2 (before) SPEC2 (after)
Fig. 31b: Cross-tank energy distribution for measured waves (0.9 to 1.5 Hz) M4-2: REGP4_H0P06_T3P116
Probe-5 Probe-4 Probe-3 Probe-6
Probe-7
Probe-5 Probe-4 Probe-3 Probe-6
0 0.00025 0.0005 0.00075 0.001 0 1 2 3 4 5 6 Probes 5, 4, 3, 6, 7 S (f) [m 2 /H z ] PW (before) PW (after)
Fig. 31c: Cross-tank energy distribution for isolated principal waves M4-2: REGP4_H0P06_T3P116 0.00E+00 5.00E-07 1.00E-06 1.50E-06 2.00E-06 0 1 2 3 4 5 6 Probes 5, 4, 3, 6, 7 S( f) [m 2 /H z ]
BW (before) FW1 (before) FW2 (before) BW (after) FW1 (after) FW2 (after)
Fig. 31d: Cross-tank energy distribution for isolated second-order waves M4-2: REGP4_H0P06_T3P116
Probe-5 Probe-4 Probe-3 Probe-6
Probe-7
Probe-5 Probe-4 Probe-3 Probe-6
0 0.00025 0.0005 0.00075 0.001 0 1 2 3 4 5 6 7 Probes 1, 2, 3, 8, 9, 10 S 9 f) [m 2 /H z ]
SPEC1 (before) SPEC1 (after)
Fig. 31e: Along-tank energy distribution for measured waves (0 to 1.0 Hz) M4-2: REGP4_H0P06_T3P116 0.00E+00 2.50E-06 5.00E-06 7.50E-06 1.00E-05 0 1 2 3 4 5 6 7 Probes 1, 2, 3, 8, 9, 10 S (f) [m 2 /H z ]
SPEC2 (before) SPEC2 (after)
Fig. 31f: Along-tank energy distribution for measured waves (0.9 to 1.5 Hz) M4-2: REGP4_H0P06_T3P116
Probe-1 Probe-2
Probe-3
Probe-8 Probe-9
Probe-10
Probe-1 Probe-2 Probe-3
Probe-8
Probe-9
0 0.00025 0.0005 0.00075 0.001 0 1 2 3 4 5 6 7 Probes 1, 2, 3, 8, 9, 10 S (f) [m 2 /H z ] PW (before) PW (after)
Fig. 31g: Along-tank energy distribution for isolated principal waves M4-2: REGP4_H0P06_T3P116 0.00E+00 2.50E-07 5.00E-07 7.50E-07 1.00E-06 0 1 2 3 4 5 6 7 Probes 1, 2, 3, 8, 9, 10 S( f) [m 2 /H z ]
BW (before) FW1 (before) FW2 (before) BW (after) FW1 (after) FW2 (after)
Fig. 31h: Along-tank energy distribution for isolated second-order waves M4-2: REGP4_H0P06_T3P116 Probe-1 Probe-2 Probe-3 Probe-8 Probe-9 Probe-10 Probe-1 Probe-2 Probe-3 Probe-8 Probe-9 Probe-10
0 0.0001 0.0002 0.0003 0.0004 0.0005 0 1 2 3 4 Probes 11, 12, 13 S (f) [m 2 /H z ]
SPEC1 (before) SPEC1 (after)
Fig. 31i: Cross-tank energy distribution for measured waves (0 to 1.0 Hz) M4-2: REGP4_H0P06_T3P116 0.00E+00 1.00E-06 2.00E-06 3.00E-06 4.00E-06 5.00E-06 0 1 2 3 4 Probes 11, 12, 13 S (f) [m 2 /H z ]
SPEC2 (before) SPEC2 (after)
Fig. 31j: Cross-tank energy distribution for measured waves (0.9 to 1.5 Hz) M4-2: REGP4_H0P06_T3P116
Probe-11 Probe-12 Probe-13
Probe-11
Probe-12
0 0.0001 0.0002 0.0003 0.0004 0.0005 0 1 2 3 4 Probes 11, 12, 13 S (f) [m 2 /H z ] PW (before) PW (after)
Fig. 31k: Cross-tank energy distribution for isolated principal waves M4-2: REGP4_H0P06_T3P116 0.00E+00 1.00E-07 2.00E-07 3.00E-07 4.00E-07 5.00E-07 0 1 2 3 4 Probes 11, 12, 13 S (f) [m 2 /H z ]
BW (before) FW1 (before) FW2 (before) BW (after) FW1 (after) FW2 (after)
Fig. 31l: Cross-tank energy distribution for isolated second-order waves M4-2: REGP4_H0P06_T3P116
Probe-11 Probe-12 Probe-13
0 0.001 0.002 0.003 0 1 2 3 4 5 6 Probes 5, 4, 3, 6, 7 S (f) [m 2 /H z ]
SPEC1 (before) SPEC1 (after)
Fig. 32a: Cross-tank energy distribution for measured waves (0 to 1.0 Hz) M4-3: REGP4_H0P12_T3P116 0.00E+00 1.00E-05 2.00E-05 3.00E-05 4.00E-05 0 1 2 3 4 5 6 Probes 5, 4, 3, 6, 7 S (f) [m 2 /H z ]
SPEC2 (before) SPEC2 (after)
Fig. 32b: Cross-tank energy distribution for measured waves (0.9 to 1.5 Hz) M4-3: REGP4_H0P12_T3P116
Probe-5 Probe-4 Probe-3 Probe-6
Probe-7
Probe-5 Probe-4
Probe-3 Probe-6
0 0.001 0.002 0.003 0 1 2 3 4 5 6 Probes 5, 4, 3, 6, 7 S (f) [m 2 /H z ] PW (before) PW (after)
Fig. 32c: Cross-tank energy distribution for isolated principal waves M4-3: REGP4_H0P12_T3P116 0.00E+00 1.00E-05 2.00E-05 3.00E-05 4.00E-05 5.00E-05 0 1 2 3 4 5 6 Probes 5, 4, 3, 6, 7 S( f) [m 2 /H z ]
BW (before) FW1 (before) FW2 (before) BW (after) FW1 (after) FW2 (after)
Fig. 32d: Cross-tank energy distribution for isolated second-order waves M4-3: REGP4_H0P12_T3P116
Probe-5 Probe-4 Probe-3 Probe-6
Probe-7
Probe-5 Probe-4
Probe-3
Probe-6
0 0.001 0.002 0.003 0 1 2 3 4 5 6 7 Probes 1, 2, 3, 8, 9, 10 S 9 f) [m 2 /H z ]
SPEC1 (before) SPEC1 (after)
Fig. 32e: Along-tank energy distribution for measured waves (0 to 1.0 Hz) M4-3: REGP4_H0P12_T3P116 0.00E+00 5.00E-05 1.00E-04 1.50E-04 2.00E-04 0 1 2 3 4 5 6 7 Probes 1, 2, 3, 8, 9, 10 S (f) [m 2 /H z ]
SPEC2 (before) SPEC2 (after)
Fig. 32f: Along-tank energy distribution for measured waves (0.9 to 1.5 Hz) M4-3: REGP4_H0P12_T3P116
Probe-1 Probe-2
Probe-3
Probe-8 Probe-9 Probe-10
Probe-1 Probe-2 Probe-3
Probe-8
Probe-9