Automaker Technology Strategy and the Cost of
Complying with the Corporate Average Fuel
Economy Standards
by
Samantha L. Houston
A.B.Environmental Science and Public Policy, Harvard University
(2011)
Submitted to the Institute for Data, Systems, and Society
in partial fulfillment of the requirements for the degree of
Master of Science in Technology and Policy
at the
MASSACHUSETTS INSTITUTE OF TECHNOLOGY
June 2017
@
Massachusetts Institute of Technology 2017. All rights reserved.
Signature redacted
...
. . . .
Institute fData, Systems, and SocietyAuthor...
Certified by. .
Signature redacted
May
17, 2017
David R. Keith
Mitsui Career Development Professor
Assistant Professor of System Dynamics
Signature redacted
Thesis Supervisor
Accepted by --...
Munther Dahleh
William A. Coolidge Professor, Electrical Engineering and Computer
USETTS INSTITUTE
Science
Director of the Institute for Data Systems and Society
co LU C-)(
MASSACH OF TECHNOLOGYJUN 052017
mannaAutomaker Technology Strategy and the Cost of Complying
with the Corporate Average Fuel Economy Standards
by
Samantha L. Houston
Submitted to the Institute for Data, Systems, and Society on May 17, 2017, in partial fulfillment of the
requirements for the degree of
Master of Science in Technology and Policy
Abstract
In this paper, I examine the question of how the technology choices of automakers, responding to the regulatory obligations placed on them by policymakers, influence the trajectory of technology diffusion and the cost of compliance with CAFE Stan-dards for Light Duty Vehicles (LDVs). Automakers have two main strategies to close the gap between current new vehicle fuel economy and the fuel economy mandated by CAFE: (1) deployment of fuel saving technologies to improve the fuel economy of conventional internal combustion engine (ICE) vehicles; or (2) increasing the share of high-efficiency electric vehicles (EVs) in the sales mix. I develop a model of the LDV fleet to determine the long term CAFE target compatible with limit global warming to two degrees Celsius. I then use this result to study the options for automaker strat-egy, and I optimize the strategy for both the short term (2012-2025) and long term (2012-2050) compliance cost for two CAFE regulatory regimes. I find that the extent to which automakers use the two main compliance strategies impacts the cumulative cost of complying with the CAFE standards to 2025, the cost of meeting long-term climate change goals, and the pace at which EVs penetrate the U.S. fleet. Specifi-cally, I find that early emphasis on EVs reduces the overall cost of CAFE compliance through 2050 by allowing automakers benefit from time-dependent learning feedbacks. Although the pace of EV penetration into the market varies with automaker strategy, the the 2050 market share of EVs reaches or very nearly reaches 100 percent under a 2050 CAFE target that is compatible with limiting global warming to two degrees Celsius.
Thesis Supervisor: David R. Keith
Title: Mitsui Career Development Professor Assistant Professor of System Dynamics
Acknowledgments
I would first like to thank my thesis advisor, Professor David Keith, for taking me on as a research assistant. This accomplishment would have never been possible without Professor Keith's encouragement and guidance. I am grateful to have had an advisor as accessible and as patient as he is.
I would also like to thank to the System Dynamics group for their feedback throughout this final semester.
I am grateful to the Technology and Policy Program staff-Ed Ballo, Barb DeLe-Barre, and Frank Field-for making TPP a supportive, welcoming home within MIT. My sincere thanks also goes to Jennifer Greenleaf for her guidance in combing through the literature for data and for helping me ensure my references were in top form.
I owe a debt of gratitude to my crew of TPP women with whom I laughed and cried, at times simultaneously, and with whom I always found mutual solidarity through the thesis writing process.
Finally, I would like to acknowledge my family. I am grateful to Mom and Dad for teaching me the value of education and for supporting me through all my years of higher and higher learning. And I extend a special thank you to my fiance, Eric, for loving and encouraging me in a way that overcame the 1,3757 miles between us over the last two years. .
Table of Contents
1 Introduction... 7
2 Calculation of 2050 CAFE Target ... 16
3 Strategy Model... 21
4 Results for Constant Strategic Orientation ... 28
5 Results for Optimal Strategic Orientation Under Augural 2022-2025 CAFE Standards ... 33
6 Results for Optimal Strategic Orientation Under Weak 2022-2025 CAFE Standards ... 37
7 Discussion and Conclusions... 42
8 Appendix: Commented U.S. LDV Fleet Model Code... 47
9 Appendix: Commented Strategy Model Code...53
10 Optimization settings...72
1 Introduction
Recent findings have shown climate change is outpacing even the most extreme predictions for major changes in the climate system, including the melting of the arctic ice cap, extreme droughts, and flooding due to sea-level rise (National Snow and Ice Data Center, 2017; Scherer, 2012). These occurrences underscore the need to find the largest points of leverage for limiting climate change. The United States has committed to several sets of GHG emission reduction goals. Most recently, the U.S. joined with 192 states and the European Union in agreeing to limit global warming to two degrees Celsius in the Paris Agreement during United Framework Convention on Climate Change
(UNFCCC) meeting in 2015 (United Nations, 2015). Though the U.S. Nationally
Determined Contribution to emission reductions set out through 2025 in the Agreement is not sufficient to achieve the goal of limiting temperature increase to 2 degrees Celsius, the Agreement provides a mechanism for a "global stocktake" every five years at which time the national contributions may be ratcheted-up (United Nations, 2015). In order to meet a two-degree scenario, U.S. emissions will need to be reduced eighty percent relative to 1990 levels by 2050 (Miotti, Marco, Supran, Geoffrey, Kim, Ella J., & Trancik, Jessika E., 2016).
Transportation constitutes thirty-four percent of total U.S. greenhouse gas emissions (by end-use sector), and thus presents a major opportunity for the U.S. to reduce its greenhouse gas emissions. Within the transportation sector, the light-duty vehicle (LDV) fleet comprises fifty-seven percent of emissions-more than all other types of transportation (medium- and heavy-duty trucks, aircraft, ships and boats, rail,
and other) combined. The LDV fleet is therefore responsible for nineteen percent of total U.S. GHG emissions (Figure 1). Given the magnitude of the LDV fleet contribution to emissions, it is critical to effectively address LDVs in U.S. climate policy.
Figure 1. U.S. Greenhouse Gas Emissions by End Use Sector (The White House, 2015)
Cds &1d Light iruco '
19%
Heavy Trucks and Buses
Aircraft 3% Shipping and Boating
1% Other
2% Rail 1%
The primary levers for reducing emissions from LDVs in the U.S. are the Corporate Average Fuel Economy (CAFE) and GHG Emission Standard programs. Issued as a joint rule between the National Highway Safety and Transportation
Administration (NHSTA) and Environmental Protection Agency (EPA) in coordination with the California Air Resources Board (CARB), these standards are known collectively as the National Program for Light-Duty Vehicles. The standards are set out on an annual basis through 2025, at which time the EPA emission maximum standard is 163 grams of carbon dioxide per mile (gCO2/mile) and the NHTSA CAFE minimum is 48.7 miles per
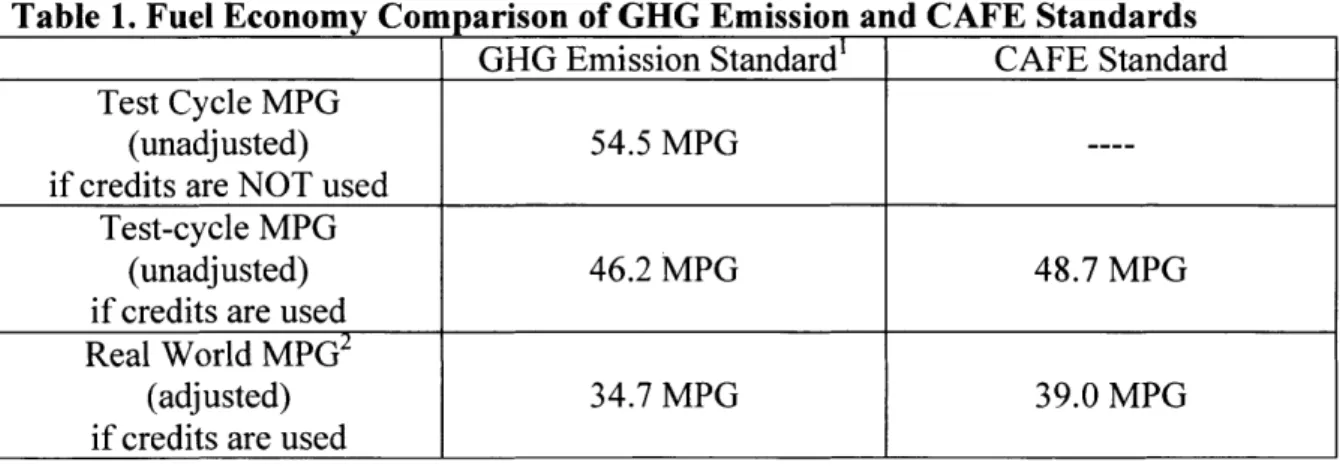
standard for 2025 refers to the fuel economy that would be required if the EPA greenhouse gas standard were achieved exclusively through improvements in fuel economy (US EPA, US NHTSA, 2012). According to the rule, automakers are allowed to, and indeed are expected to, meet a portion of the greenhouse gas standard through reducing leakage in vehicles' air conditioning system and the use of alternative refrigerants (US EPA, US NHTSA, 2012). The expected use of credits reduces the expected fuel economy required for the EPA greenhouse gas standard to 46.2 MPG (Baum, Alan & Luria, Dan, 2016). This number is, by design, comparable with the CAFE requirement set out by NHTSA. The slight discrepancy between GHG-equivalent fuel economy (46.2 MPG) and CAFE fuel economy (48.7 MPG) may be due to the
expectation that the carbon content of future fuel blends may change in the future or rounding error between the fuel economy and GHG emission cut offs for each vehicle footprint class. For a comparison, see Table 1.
Table 1. Fuel Economy Comparison of GHG Emission and CAFE Standards
GHG Emission Standard' CAFE Standard
Test Cycle MPG
(unadjusted) 54.5 MPG
----if credits are NOT used Test-cycle MPG
(unadjusted) 46.2 MPG 48.7 MPG
if credits are used Real World MPG2
(adjusted) 34.7 MPG 39.0 MPG
if credits are used
11 Automakers may claim credit for GHG emission reductions from the use of alternative refrigerants,
reducing leakage from the cooling system, and allowing the engine to cycle off when the vehicle is stopped. Credits do not apply to CAFE compliance (US EPA, US NHTSA, 2012).
2 On-road fuel economy is typically twenty percent worse and on-road greenhouse gas emissions are typically twenty five percent worse than the test cycle.
Because NHTSA is limited to making fuel economy standards in no more than five-year increments at a time, NHTSA set augural standards for 2022-2025 in the 2012 rulemaking that set EPA greenhouse gas standards through 2025 (US EPA, US NHTSA, 2012). The 2012 Rule specified an expected 2025 CAFE target of 48.7 MPG. The on-road fuel economy of vehicles in 2025 would be only about 39 MPG, as shown in Table
1, because real-world fuel economy is typically only eighty percent of the level for the test cycle (US EPA, US NHTSA, 2012). In the regulatory parlance, the 48.7 MPG target
is 'unadjusted' and refers to the fuel economy demonstrated during the prescribed test cycle, while the 39 MPG target is 'adjusted' for real-world driving. In a sense, the CAFE requirement provides a floor for the fuel economy that new vehicles must have under the National Program. Even if credits for greenhouse gas reduction were to allow for a lesser
contribution from fuel economy for the purpose of achieving EPA's greenhouse gas standard, CAFE would ensure a minimum fuel economy for new vehicles. For this
reason, I focus on the CAFE standard as the basis for discussing firm strategy, technology diffusion, and the cost of compliance for increasing fuel economy.
The CAFE standard is technology neutral in that it does not prescribe what
technologies must be used to meet the standard. Furthermore, the standard is intentionally 'technology forcing' in that it is written in consideration of what fuel efficiency
technologies may become available to commercial use during the regulatory period, rather than what is currently commercially available in 2012 when the standards were established (US EPA, US NHTSA, 2012). As such, automakers are free to decide how they will develop and deploy new technologies to close the gap between the current real-world fuel economy of new vehicles, 25 MPG, and the 39 MPG CAFE goal. Automakers
have two main strategies to close this gap: (1) deployment of fuel saving technologies to improve the fuel economy of conventional internal combustion engine (ICE) vehicles; or (2) increasing the share of high-efficiency electric vehicles (EVs) in the sales mix. The extent to which automakers use each of these strategies will impact both the cumulative cost of complying with the CAFE standards to 2025, the cost of meeting long-term climate change goals, and the pace at which EVs penetrate the U.S. fleet. In this paper, we examine the question of how the technology choices of automakers, responding to the regulatory obligations placed on them by policymakers, influence the trajectory of technology diffusion and the cost of compliance with CAFE.
The question of firm strategy and its consequences is subject to several degrees of complexity. First, there is the issue of how the cost per vehicle per fuel economy
improvement changes on the margin with the deployment of fuel saving technology in ICE vehicles versus investment in EVs. On the one hand, ICE vehicles are a mature technology for which incremental efficiency gains are increasingly expensive. As can be seen in Figure 2, the total cost of improving fuel economy for ICE vehicles rises at an increasing rate for higher and higher percent improvements in fuel economy for both the lower and upper bound estimates for cost. On the other hand, EVs are an emerging technology whose costs are expected to fall over time as a result of both investments in research and development as well as learning-by-doing in production. The battery pack is the main component of EV technology cost that is subject to learning. Historical and expected costs for different types of battery packs are shown in Figure 3, showing how battery packs have been falling since 2005 and are expected to continue to fall, though at a slower rate, through 2030 (Wolfram, Paul & Lutsey, Nic, 2016). EV charging
technologies are another component of EV ownership cost that is expected to fall over time as more EV infrastructure is deployed over time.
FIGURE 2. Pathway example for midsize ICE vehicle (Committee on the Assessment of Technologies for Improving Fuel Economy of Light-Duty Vehicles, Phase 2, Board on Energy and Environmental Systems, Division on Engineering and Physical Sciences, & National Research Council, 2014).
S2,500 - 2016 $2,000 $1,500 -S1,000 $500 %
4
so ~ ~a
I __ 00/ 5% 10%/ 15% 2025 '* igh Low $1,658 (2017-2025) # $1,181 (2017-2025) 20% 25% 30% 35% 40% 45% 50%Percent Fuel Consumption Reduction
0 0 C
I
I-i
I
(.4Figure 3. Battery pack cost history and future estimates (Wolfram, Paul & Lutsey, Nic, 2016)
2,000
* "Background data" * BEV battery pack o PHEV battery pack
1,500 0e e HFCEV battery pack
- USDOE 2022 cost target
~ - BEV battery pack, central estimate
00 o 1,000 0 0 U 0 0 0 2005 2010 2015 2020 2025 2030
That said, the rate at which learning reduces costs depends greatly on the rate at which each strategy is employed, and is subject to uncertainty, particularly for EVs. Naturally, automakers would like to minimize their compliance cost. However, it is unclear how automakers might maintain the optimal level of orientation toward one strategy or the other as these dynamics unfold through the compliance period, given the complexity of how the marginal cost of fuel economy improvement will change over time.
It is worth noting here that California and nine other states (so called section 177 states comprising about 30% of new vehicle market) are covered by the Zero Emission Vehicle (ZEV) program, rather than CAFE. Unlike CAFE, ZEV is not technology neutral. ZEV requires a certain amount of new vehicle sales in these states be zero emission vehicles (e.g. battery electric vehicles and fuel cell vehicles), though some
'transitional' zero emission vehicles that still have a gasoline engine (e.g. plug-in
may have a material impact on the cost of compliance in the CAFE portion of the U.S. market because it mandates a minimum amount of EV sales by automakers that, despite being outside of the CAFE compliance calculation, contribute to production experience and therefore learning cost reduction of EVs in the CAFE market.
A second complexity in the question of how automaker choices influence
technology diffusion and cost of compliance is that the long-term standard beyond 2025 has not been established. It is known, however, that the fuel economy of new vehicles will need to be dramatically higher than the 2025 goal if the U.S. is to meet its climate goals for deep de-carbonization. Much of the literature on climate stabilization pathways emphasizes 2050 as a critical time by which annual emissions must be reduced
substantially in order to limit global warming to two degrees Celsius (IPCC, 2014; Miotti, Marco et al., 2016). How aggressive the 2050 fuel economy goal must for this purpose depends on how much decarbonization is borne by the LDV sector, and how factors other than fuel economy (such as total vehicle miles traveled) contribute to emissions reduction from the LDV fleet. Furthermore, the stringency of the long-term fuel economy target will affect optimal automaker compliance strategy. That is to say that the optimum strategy for a very stringent 2050 fuel economy target will differ from the optimum strategy for a less stringent 2050 fuel economy target. Furthermore, the optimum strategy for any long-term 2050 perspective will differ greatly from the optimum strategy for the myopic view considering only the standards through 2025. Knowing the stringency of the 2050 fuel economy target and taking a long term view are essential for minimizing automaker cost over the long term.
A third issue increasing the complexity affecting automaker strategy is the uncertainty as to whether the augural 2022-2025 standards will be retained during the Midterm Evaluation for the National Program. As I later show, weakening CAFE
standards 2022-2025 has serious ramifications for designing an optimal compliance strategy and for the total cost associated with the National Program over the long term. Government, industry, and nonprofit organizations have published reports as part of the ongoing policy discussion around the Midterm Evaluation. With nearly all of these reports concluding that the 2025 CAFE standard is achievable with existing ICE efficiency technology at a cost lower than initially projected, the temptation is great for automakers to deploy fuel saving technology in ICE as the primary strategy for 2025. The Midterm Evaluation Technical Assessment Report for the CAFE and Greenhouse Gas Emissions Standards concluded, "PHEVs and EVs are not estimated to be cost-effective responses to the augural CAFE standards (i.e., the CAFE model identifies more cost-effective solutions than building additional PHEVs or EVs)" (U.S. EPA, NHTSA, CARB, 2016). While this may be true under the myopic view considering no standard beyond 2025, the decision to focus solely on ICE vehicles through 2025 becomes less clear when one considers the stringency of CAFE standard that is necessary in 2050 to achieve U.S. climate goals. The EPA's Final Rule for Greenhouse Gas Standards takes an even rosier view of the feasibility of the standards using only ICE vehicles noting, "[t]he standards are feasible at reasonable cost, without need for extensive electrification" because the "compliance can be achieved through a number of different technology pathways reflecting predominantly the application of technologies already in commercial production" (U.S. EPA, 2017). Analyses done by nonprofits in parallel to the regulatory
Midterm Evaluation have promoted similar findings in terms of the nearly exclusive deployment of fuel saving technology to meet the CAFE mandate (Baum, Alan & Luria, Dan, 2016). As discussed previously, however, the post-2025 regulatory regime will have to be much more aggressive through 2050, which means that focusing on ICE fuel
economy alone will get very expensive as each MPG improvement achieved cost more-driving up total compliance cost beyond what automakers might achieve with a more balanced strategy-even with the opportunity for learning as greater volumes of fuel saving technology packages are implemented.
In the following sections, I will address the issue of optimizing automaker
strategy by first calculating the 2050 CAFE target that is compatible with limiting global warming to two degrees Celsius given the augural standards through 2025. Next, I develop a strategy model and present results of this model for a range of CAFE
compliance scenarios. Finally, I discuss the results of the scenario analysis and present conclusions relevant for both regulators and automakers in the context of the ongoing Midterm Evaluation as well as post-2025 CAFE.
2 Calculation of 2050 CAFE Target
Before I turn to the question of technology strategies for short and long run CAFE compliance, I establish the desired CAFE target for 2050 that is compatible with limiting global warming to two degrees Celsius. Many studies have estimated greenhouse gas emissions reduction for the LDV fleet based on expected trajectories for vehicle-miles travelled, fuel efficiency, fuel mix, and other parameters (Massachusetts Insitute of Technology, 2015). Other studies have estimated the rate at which greenhouse gas performance standards for new vehicles are expected to diffuse lower-emitting vehicles
into the total fleet stock (Fridstrom, Vegard, & Werner Johansen, 2016). However, the existing literature does not provide an answer for what the desired CAFE target will need to be in 2050 for a two-degree scenario if CAFE continues to be the only policy lever for reducing greenhouse gas emissions from the LDV fleet. Miotti, et al. estimate that the average per-vehicle emissions for the total fleet in a two-degree scenario is 50
gCO2eq/km. This per-vehicle emission level assumes that all end-use sectors achieve the
same portion of emissions reduction (80% below 1990 level), and that total annual vehicle-miles traveled increase by 0.9% through 2050 (Miotti, Marco et al., 2016). In order to use this emissions level for determining average fuel economy, I translate it to the equivalent MPG required to achieve of this level of greenhouse gas emissions for the average greenhouse gas content of a gallon of gasoline. The MPG equivalent of
greenhouse gas (MPGghg) has begun to be used by some in the vehicle transportation, such as the Union of Concerned Scientists, to meaningfully compare the global warming potential of EVs and ICE vehicles (Anair, Don & Mahmassani, Amine, 2012). The calculation is as follows: 50 gCO2eq/km is equivalent to 80.5 gCO2eq/mile. This per mile emission rate translates to 110 MPGghg given that there are 8,887 grams of carbon dioxide equivalent in the average gallon of gasoline (U.S. EPA, 2014).
In order to determine what CAFE target for new vehicles in 2050 will lead to 110 MPGghg for the entire U.S. LDV fleet, I develop a cohort model of the U.S. LDV fleet with cohort-specific hazard rates that tracks the fuel economy of each cohort (Sterman, John, 2000). The structure of the fleet and fuel economy progression is shown in Figure 4.
Figure 4. U.S. LDV Fleet Age and Fuel Economy Model
Cohort Hazard
Aging a Rate a
Initial Fleet a +
initil FEPer Vintage
Initial FE
Distribution c
<Total Retirements a Total
Retirements> ale Retirements
Average Fleet -b- Average Fleet
GPM MPG Switch for 2025 Target Time Adjustment Increment Economy + Introduction Retirement
Initial New of Fuel of Fuel +
Vehicle GPM + CAFE GPM Economy Economy ca
2021 CAFE + + 2050 CAFE
Target GPM Target GPM
2025+CAFE 2025 CAFE <Average Time <Time> FE Cohort Per Vintage>
Target GPM Tm>Progression c
2050 CAFE
2021 CAFE 2025 CAFE Target MPG
Target MPG Target MPG
I model the progression of each model year through an aging chain in which vehicles are introduced as sales and leave the fleet by retiring according to the hazard rate for their age (Fleeta times Hazard Ratea for each age cohort "a"), while the surviving vehicles proceed to the subsequent age cohort after each year. The total fleet of vehicles, 250 million, is reduced by thirty percent to reflect only the vehicles in CAFE states (U.S. EPA, NHTSA, CARB, 2016). For the purposes of estimating the requisite fuel economy of new vehicles in 2050, I assume the 175 million vehicles in the U.S. CAFE state fleet are in steady state. That is to say, the total number of vehicles is constant, and new
steady state assumption primarily serves to simplify the calculation, it is a defensible approximation of the real world. First, per person, per licensed driver, and per household vehicle ownership rates peaked between 2001 and 2006. Though projected population increase will tend to increase the number of vehicles in the future, societal changes such as increases in telecommuting and public transportation use will tend to decrease the total number of vehicles (Sivak, Michael, 2013). Second, other uncertain factors, such as vehicle automation and shifting the paradigm from vehicle ownership to mobility as a service, on balance, may have either a positive or negative effect on the fleet growth (increase or decrease fleet stock over time) (Greenblatt, Jeffrey B. & Saxena, Samveg, 2015; Wadud, Zia, MacKinzie, Don, & Leiby, Paul, 2016). What is more, both
automation and mobility as a service would tend to increase the vehicle-miles traveled per vehicle. Because the vehicle hazard rate is highly correlated to VMT, this would result in quicker retirements of vehicles and, consequently, a quicker diffusion of higher fuel efficiency vehicles into the fleet.
The fuel economy attribute of new vehicles progresses through the fuel economy stock and flow structure in a manner similar to how vehicles progress through the fleet structure. Fuel economy is introduced into the fleet in terms of new vehicle sales times the gallons per mile (GPM) per vehicle of those new vehicles. The fuel economy attribute then progresses through an aging chain in which fuel economy passes out of the fuel
economy stock according to the retirements of vehicles times the fuel economy of those vehicles. The remaining fuel economy of the model year cohort progresses to the next age in parallel to the vehicles having that trait. CAFE targets are structured such that they may be exogenously imposed in MPGghg, as occurs in the CAFE regulations. Next, the
model converts the MPGghg fuel economy to efficiency units of gallons per mile (GPM). I assume that efficiency (in GPM) improves linearly from the current new vehicle fuel economy of 0.04 GPM (25 MPGghg) to the 2025 goal of 0.026 GPM (39 MPGghg) and from 2025 through the 2050 fuel efficiency target.
I calculate vehicle age hazard rates from survivability data from the NHTSA National Center for Statistics and Analysis, while the total initial vehicle fleet and the average fuel economy by model year data are from the DOT Bureau of Transportation
Statistics (Bureau of Transportation Statistics, n.d.; Lu, S., 2006).
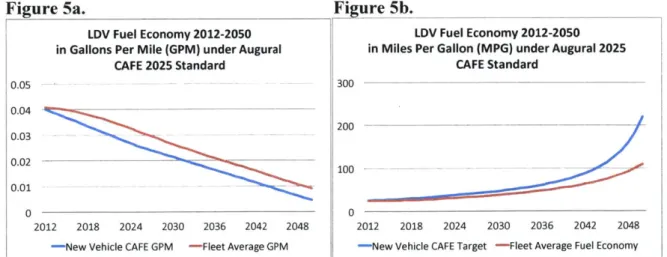
The output of the model is the Average Fleet MPG as calculated from the average fleet fuel economy averaged across all vehicle age cohorts, as seen in Figures 5a and 5b. In order to reach 0.0092 GPM (110 MPGghg) by 2050 given the 2025 goal of 0.026 GPM (39 MPGghg), one must impose a 2050 CAFE target of 0.0049 GPM (220 MPGghg). 220 MPGghg, then, is the 2050 CAFE target for new vehicles in the U.S. LDV fleet that will result in a fleet average of 110 MPGghg, as is compatible with a two degree warming
scenario.
Figure 5a. Figure 5b.
LDV Fuel Economy 2012-2050 LDV Fuel Economy 2012-2050 in Gallons Per Mile (GPM) under Augural in Miles Per Gallon (MPG) under Augural 2025
CAFE 2025 Standard CAFE Standard
005 -1300
200
100 ----
-_----0
2012 2018 2024 2030 2036 2042 2048
-New Vehicle CAFE Target -Fleet Average Fuel Economy
0.04
0.03
0.02
0.01
2012 2018 2024 2030 2036 2042 2048
-New Vehicle CAFE GPM -Fleet Average GPM
I I 0
3 Strategy Model
Now that I have calculated the necessary 2050 CAFE target for a two-degree scenario, I turn to assessing the effects of automaker CAFE compliance strategy on technology diffusion and the cost of compliance. I combine several theories and
empirical observations into a model; I present this model in terms of the key feedbacks that affect regulatory cost and technology outcomes. Figure 6 begins with the challenge facing automakers, namely there is a gap between the current Average Model Years Fleet Fuel Economy and the CAFE Fuel Economy Target. Consequently, automakers feel CAFE regulatory pressure according to the size of the Fuel Economy Gap and the Time Remaining in the regulatory period to close the gap.
Figure 6. The Challenge Facing Automakers
Average MY Fleet Fuel
Economy CAFE Fuel
I Economy
Target Fue
Economy Gap
!(Time
Remaining
CA Pressure
In Figure 7, we see one strategy automakers employ in order to close the Fuel Economy Gap: deploying fuel saving technology to increase the efficiency, and hence the fuel economy, of ICE vehicles. As fuel saving technology is deployed in each ICE
vehicle, the fuel economy of ICE vehicles increases and, consequently, the fuel economy for the next model year's fleet increases. The effect is that the ICE Efficiency strategy balances for the imposition of the CAFE Fuel Economy Target.
Figure 7. ICEV Efficiency Pathway
+ Fuel Economy
+ of ICE Vehicles +
Avera e M
Eco ny CAFE Fuel
I Economy
Target Economy Gap
Ren aSnving Technology In
- ICE Vehicles
Pressure
ICE
****-.Prssure
The second strategy automakers may use to close the fuel economy gap is to sell more EVs, that is to say, electrify their fleet, as shown in Figure 8. Automakers respond to regulations that pressure the automakers to sell EVs by subsidizing the price of EVs. These subsidies may take the form of discounts or rebates as well as investments that advance the technologies relevant to EVs (such as batteries and charging infrastructure). These investments reduce the purchase price of EVs to the consumer, which increases the consumer utility of EVs relative to ICE vehicles, and increases the market share of EVs. Because EVs have a higher MPGghg than ICE vehicles, a greater market share of EVs in new vehicle sales results in a higher average fuel economy for new vehicles. Again, we see a balancing effect for the imposition of the CAFE Fuel Economy Target, this time through the Electrification pathway.
Figure 8. Electrification Pathway
EV Market
+ Share % Fuel Economy
~~fICE Vehicles + Average M
Fleet Fuel
Economy CAFE Fuel
EV U lity Economy
EV11a
Target
ang Econom Gap
cost Time ICE Vehicle
Electrification Remaning Efficiency t o
EV Purchase RmiigDpomn fFe
Price ISaving Technology in
Per Vehicle + ICE IEVhce
q- Prsure + Pressure
It is important at this point to note that automaker resources are finite, and so there is a tradeoff between investments made to increase the sale of EVs and investments made in fuel saving technology for ICE vehicles. I represent this trade off, a coupling constraint, with the concept of Strategic Orientation Toward EVs (shown in Figure 9).
Strategic Orientation Toward EVs dictates what fraction of the automakers strategic resources are oriented toward electric vehicles. The complementary fraction (one minus the Strategic Orientation Toward EVs) represents the portion of automakers strategic
Figure 9. Strategic Orientation applied to Competing Pathways
EV Market
+ Share ~ ~ +Fuel Econmy
+
~of
ICE Veohicles
+
ICE V icle Average MY
Utility Fleet Fuel
Economy CAFE Fuel EV U lity ICE Vehicle Economy
- ICE fehec la Operatng Cost - Target
Purchase Price
Operating Cos EicrfiainEcnmBGpTm Economy Gap ICE Vehicle
ElectifictionTime Efficiency
EV Purchase Remaining De1,loyme t of Fuel
Price Prvinn Tehnology In
- ICE Vehicles
CAE
\EV centives Pressure
Per Vehicle + EV A0 0 ICE
'Pressure Pressure
Oric ntation
The compliance strategy story becomes more dynamically complex when one considers the sides effect of pursuing one strategy versus the other. Both strategies benefit from learning-by-doing. Learning-by-doing, or progressing along a learning curve, has been documented in many manufacturing organizations (Argote & Epple,
1990). Learning may constitute "individuals learning how to do their jobs better [...] technological developments, and improved coordination of the production process"
(Argote & Epple, 1990). Learning is acquired through production experience, which is typically measured by proxy in terms of cumulative number of units produced (Argote & Epple, 1990), as I have done in this model. In allocating effort to the ICE Efficiency pathway, automakers accumulate production experience accumulates as fuel saving technology is deployed in each new ICE vehicle across the nearly 12 million new vehicles sold in CAFE states each year. This FST production experience translates to learning that reduces the marginal cost of each FST package produced. As previously discussed, the internal combustion engine is a mature technology, and as such, each marginal gain in fuel economy costs more than the last. The effect of learning on the
marginal cost curve is to reduce the magnitude of each marginal increase, as shown in Figure 10.
Figure 10.
Effect of Learning on Cost of Fuel
Economy Improvement in ICEs
Learning shifts the cost curve 4- -_down. 0 0
Fuel Economy Improvemeent
The learning effect of experience combined with the amount of Fuel Saving Technology Deployed in each ICE vehicle together tell us the total cost of fuel saving technology deployed per vehicle. According to the marginal cost, the total cost of fuel saving technology per vehicles also increases with each gain in fuel economy. In the model, we track the Total Cost of Fuel Saving Technology per Vehicle because it is the total cost, rather than the marginal cost, that affects the consumer utility of ICE (Figure 11). The first consequence for FST deployment is a reinforcing effect whereby more FST is deployed per vehicle accumulates as more experience in the deployment of fuel saving technology, which increases learning and reduces the cost of fuel saving technology for the given level of fuel saving technology deployed per vehicle.
It is important to note here that I assume the consumer pays a portion of the FST cost, while automakers bear the balance of the FST cost. The consumer willingness to
pay for FST is modeled as a function of gas price. As gas price increases, consumers are willing to pay more for FST up to half of the FST cost. Decreasing the cost of the fuel saving technology package through learning decreases purchase price and increases consumer utility of ICE. The higher utility leads to a greater market share of ICE, and this impedes the improvement in average fuel economy, which ultimately leads to more deployment of FST in ICE vehicles. The second consequence of deploying more FST is a balancing feedback wherein the more FST is deployed (e.g. leveling up the technology package), the more the FST costs per vehicle, which increases the cost of each ICE vehicle, reducing its utility and in turn the ICE market share. Consequently, relatively more EVs are sold, which increases the average fuel economy and reduces the fuel economy gap. A reduced gap decreases CAFE pressure, resulting in less fuel saving technology deployment in ICE vehicles.
Figure 11. Learning and Cost Side Effects of Fuel Saving Technology Deployment
EV Market
Share Ecnm
ICE V cle Av ef ICE Vehicles + Purchase Price
e ti + Econoy Gap
E ostn CP~r Electrification Tie C Vei T C Veice uenvn
EV PUrhs eEcmag
Iit
RC Efecy Doeploymet of FuelFSLerig TcnlyPrice
4.1
SavIngTechnology e nS ta i Cost of ICEge
In Figure 12, we see how learning occurs similarly as a consequence of pursuing
incentives, the reduced purchase price results in higher EV consumer utility and increases EV Market Share. A greater EV Market Share means that more EVs are sold each year. These annual sales accumulate as production experience with EVs, leanding to learning for batteries and charging technology that further reduces EV Purchase Price by reducing the cost of producing each EV. The effect is reinforcing in that offering incentives for EVs ultimately increases in EV Market Share, which drives down costs and further increases EV market share.
Figure 12. Electric Vehicle Learning Effect
Annua IEV V Mark+et
CFSttes + Share FeEoomy
V cle Averae uM " of ICE Vehicles, +
ICE - F eFulCmatv
1 .CA FE StatUy Shm
+eplomeEtcnFuy
tL - Economy CAFE Fuel Cumulative
cumulative EV EV U lity C ICE Yea Econ*omrge Saving Technology
EV Sales Learning E ICE ce Operating t E Target
Purchase Price
EV Learning ope ting Economy Gap +
r
ost iC
ICEICE
Vehicle
EV MSRP EV Purchase to Remaining Efficiency Deployment of Fuel FST Learning Technology
Price
4/Savi
Tchnoogy In LearningCA
EV incentives are not the only way to
jump-start
the reinforcing EV Learningfeedback. As discussed previously, the Zero Emission Vehicle (ZEV) program requires automakers to sell an increasing number of ZEV vehicles, primarily EVs, each year.
Because sales of EVs in ZEV states contribute to the cumulative experience with EVs for automakers, ZEV sales of EVs are exogenously included in the learning capacity for the
Figure 13. ZEV Program Learning Spillover to CAFE Vehicle Market ZEV EV Annual EV
es CAFE States+ Share + Fua Econ
RE Utility i Icle Av~Fleet
Fuel Cmltv
. - Economy CAFE Fuel Cumulative
Cumlaiv E E Ity j' i~ ICEEonm Deployment of Fuel
EV Sales Learning - L ICE ehicle O perating Cost Target y o
Purhae PriceIC -?ceEIr'
EVLArning EV + Etc ®R
SEV La Operating Econom y Gap E+n
Or ICE Veh cle CE Vh
Coa Elctifiat~nTime IEVhceICE Vehicle Fulvn
i To wad ema's n Efficiency
EV MSRP EV Purchase
I
eann fiinyDeploy tof Fuel FST Learning Technology~m Price
4 /Savln~
Technology In LearningTechno y Per
4 Results for Constant Strategic Orientation
In order to understand how Strategic Orientation Toward EVs (SO) will affect both the Short Term Cumulative Cost of Compliance (2012-2025) and the Long Term Cumulative Cost of Compliance (2012-2050), I examine the Cumulative Compliance Cost (CCC) for both timeframes under the full range of values of SO from 0 to 1 in increments of 0.05. Model parameters for this analysis are shown in Table 2. Figures 14a and 14b show the expected Total CCC and Automaker CCC (Total CCC less the cost of fuel saving technology borne by consumers through higher ICE vehicle prices) plotted for each SO on the x-axis.
Table 2. Model Parameters
Variable Description Default Value Units
cents pergallon of
201 srne PGasoline price at the beginning of the regulatory period. 250 gas energy
Gasoline
equivalent (gge))
2025 Fuel Economy Target Fuel economy required by 2025 under augural CAFE standards. 39 MPGghg
2050 % Greening of EV Percent by which the grid greens over the regulatory period. 0.8 Dimentionless Electricity
050 Fuel Economy Target Fuel economy required by 2050 to achieve a two-degree 220 MPGghg
scenario.
2050 Gasoline Price Gasoline price at the end of the regulatory period. 350 cents/gge
Annual Light-Duty Vehicle
Number of LDVs sold each year in the U.S. 17million vehicles Sales
Rate at which future costs of compliance are discounted across 0.04 Dimentionless
the regulatory period.
EV Constant for Consumer Disutility of Evs relative to ICE vehicles due to lack of familiarity -4 Dimentionless
Utility with EVs, EV range anxiety, etc.
EV Market Share Threshold EV market share past wich sales tip to all Evs 0.98 Dimentionless Dollar value of incentives offered on each vehicle based on the $/vehicle*year*gge/
MPG/year CAFE pressure. mile
CAFE fraction of market Fraction of the U.S. LDV market that is under the CAFE program, 0.7 Dimentionless
rather than the ZEV program.
Price of electricity for the energy equivalent of a gallong of
kwh price gsln.384 cents/gge
gasoline.
Lamda Exponent governing learning for Evs. 0.9 Dimentionless
Lamda2 Exponent governing learning for FST. 0.9 Dimentionless
Max MxWTP Frcin0.5 W Fraction Maximum fraction of FST cost consumers are willing to pay as Dimentionless part of ICE vehicles purchase price, as a function of gas price.
Household income used to normalize the consumer utility 50000 $
functions for EVs and ICE vehicles.
Willingness to Pay Offset Offset used in consumer willingness to pay for FST function. 25 Dimentionless
Operating Cost Coefficient Disutility of costs associated with operating a vehicle. -0.17 1/$*mile
Price Coefficient Disutility of costs associated with purchase price of a vehicle. -0.361 vehicle/$ Reference EV Sales Automaker experience with EVs in terms of units produced 5000000 vehicles
before the beginning of the regulatory period.
Reference Fuel Economy of Average fuel economy equivalent to greenhouse gas emission of 60 MPGghg
EVs EVs at the beginning of the regulatory period.
Reference Fuel Economy of Average fuel economy of ICE vehicles at the beginning of the 25 MPGghg
ICE vehicles regulatory period.
Automaker experience in deploying FST in terms of cumulative units produced before the beginning of the regulatory period.
Reference Price of Evs Average price of EVs at the beginning of the regulatory period. 40000 $/vehicle Reference Price of ICE Average price of ICE vehicles at the beginning of the regulatory 20000 $/vehicle
Vehciels period.
Sensitivity of Consumer Sensitivity of consumer response to gas prices for calculating
0.05 Dimentionless
Response WTP for FST.
CAFE Pressure Expectation Time over which automakers for expectations about CAFE 1
year
Smooth Time pressure.
Time delay over which utility-indicated EV market share is
Figure 14a. Short Term Cumulative Compliance Figure 14b. Long Term Cumulative Compliance
Cost (2012-2025) of Constant Strategic Orientation Cost (2012-2050) of Constant Strategic Orientation
toward EVs toward EVs
250.0 200.0 150.0 100.0 50.0 A I. ___________________________-________________ .- ~.--. -I I 6.0 5.0 4.0 3.0 2.0 1.0 An 0.00 0 0.2 0.4 0.6 0.8 1 0 0.2 0.4 0.6 0.8 2
- 2025 Cost to Automakers - 2025 Total Cost - 2050 Cost to Automakers 2050 Total Cost
The results of the constant-SO policies have several significant features. First, both the short- and long-term CCC follow an asymmetric U shape across the range of Strategic Orientations toward EVs. CCC associated with values of SO from zero to the minimum value have a shallower schedule of decreasing CCC than values to the right of the minimum, which are characterized by exponential increase. The U shape results from
the amount spent on the two compliance pathways before the vehicle costs cross over. Once ICE vehicle cost is sufficiently higher than EV cost, EV's higher consumer utility will drive EV adoption and balance the fuel economy gap. This means automakers spend less and less on compliance as the EV market share increases through consumer utility preferences.
For low EV strategies (SO close to zero), costs of FST are initially low, but quickly increase such that ICE vehicles cost more than EVs by around 2036 (see Figure 15a). Though the cost of EVs remains relatively high, EVs enjoy an increase in market
I I I
share because they cost less than ICE vehicles. The market tipping point lags the cross-over in price for two reasons. First, consumers prefer EVs less than ICE vehicles all else equal, so EVs must cost less than price parity to overcome the vehicle utility penalty. Second, changes in market share are subject to an adjustment time, which means that there is a delay between EVs achieving higher utility than ICE vehicles and the time at
which the market share reflects the market share indicated by consumer utility. The increase in market share of EVs allows EVs to bear the burden of increasing the average fleet fuel economy toward the end of the period without the need for significant EV spending. In this case, low SO means nothing or very little is spent on incentivizing the sale of EVs early on, and as a consequence, the learning feedback that brings down the cost of EVs is not strong until after EVs start to gain market share due to the cost cross-over.
The effect of a mid-range constant SO is similar to the behavior resulting from a low SO (see Figure 15b). A key difference is the point at which the vehicle costs and market share tip in favor of EVs. Because automakers offer incentives for EVs from the beginning of the period, EV learning occurs earlier. This reduces EV costs and allows the market to tip toward EVs slightly earlier. In contrast, high EV strategies (SO close to one) are characterized by significant learning in the EV pathway (see Figure 15c). However, the learning for EVs alone is not sufficient to lower the cost of EVs below the cost of ICE vehicles. Even so, the market tips toward EVs earlier than the low- and mid-range SO values, because automaker incentives for EVs lower the purchase price of EVs for consumers such that the consumer utility of EVs is greater than ICE vehicles. The costs of high-SO policies are much greater than low-SO policies, because the cost of EVs
never crosses below ICE vehicles enough (or at all) to allow consumer utility to drive the adoption of EVs. As a consequence, automakers have to continuously offer large
subsidies to encourage the adoption of EVs and reduce the regulatory pressure they feel
from CAFE.
Figure 15a. Vehicle Cost and Figure 15b. Vehicle Cost and Figure 15c. Vehicle Cost and
Market Share with SO = 0. Market Share with SO = 0.5. Market Share with SO =1.
VE -aE
--EV -ICE -EV -ICE -EV -ICE
A second notable feature in the results of constant strategic orientation is that the SO that gives a minimum CCC in 2025 (Figure 14a) is less than (to the left of) the SO
that gives a minimum CCC in 2050 (Figure 14b). A lower optimal constant SO for 2025
versus 2050 is not surprising given the relative cost of a fuel economy increase from EV incentives versus deploying fuel saving technology in ICE vehicles. As previously mentioned, the cost of early improvements in fuel economy is greater for the
Electrification pathway than for the ICE Efficiency pathway. The shorter timeline
(2012-2025, rather than 2012-2050) truncates the benefit an automaker might capture by
jumpstarting the EV learning feedback through offering EV incentives early on. This result entails that it is rational for automakers to focus very little (twenty percent or less)
on EVs under the myopic view considering only the 2025 standard, whereas automakers get a better result in 2050 if they focus about half of their effort to comply with CAFE on EVs.
A third notable feature of the CCC versus SO plots is that the Total CCC is much higher than Automaker CCC for low values of SO and converges to the same values as
SO approaches one. This feature arises because I estimate that consumers will pay a portion of the cost of fuel saving technology (FST) packages resulting from gas prices. EVs, on the other hand, are sold at or below cost (purchase price being cost less
incentives). Therefore, I assume that cost of deploying EVs is absorbed entirely by the automaker. As SO progresses from zero to one, the fraction of CCC made up of EV incentives increases until EV incentives make up the entire CCC for SO equal to one. Automaker CCC is sensitive to the assumption how much of the FST cost is passed to consumers, which I discuss further in the following section. For now, it is sufficient to note that both Total CCC and Automaker CCC follow the same general trend.
5
Results for Optimal Strategic Orientation Under Augural
2022-2025 CAFE Standards
The results across the range of constant strategic orientations offer some insights into the dynamics of CAFE compliance. However, a constant strategic orientation does not reflect the full suite of options available to automakers. The ability of firms to vary strategic orientation over time is likely to give a lower minimum cost than can be achieved with a constant SO because it allows firms to capture time-dependent benefits of holding a particular strategy at a particular time without having to hold that strategy over the entire period. Here I reintroduce one of the core complexities of the challenge of
selecting a CAFE compliance strategy. Specifically, the level and timing of the SO may dramatically affect the CCC for the regulatory period, and it is not clear what criteria automakers ought to weigh in deciding the strategy. In order to study this problem, I undertake an optimization using the same base parameters as were used to examine constant SO policies in the CAFE auto market. I allow the optimization to explore both the range of levels of SO and the time over which the SO is held by automakers in order to minimize CCC over the specified time horizon (2012-2025 or 2012-2050). Further details on the optimization follow in Section 10.
First, I assume the automakers collectively ascribe to the myopic view that 2025 standard is the only standard for which the CCC is considered. Under this view, I get the result shown in Figure 16.
Figure 16. Result of Optimization of 2025 CCC: Market Share, Strategic Orientation Toward EVs, and Cumulative Cost of Comaliance Curves
Market Share of New Vehicles Strategic Orientation Toward EVs
1 1.00 0.8 0.80 0.6 0.60 0.4 0.40 0.2 -- 0.20 0 0.00 -2012 2014 2016 2018 2020 2022 2024 2012 2014 2016 2018 2020 2022 2024
- WEVs I"CEVs --- Strategic Orientation Toward EVs
Notably, the SO varies greatly across the regulatory period. It starts at zero and then rises to 0.4-0.45 through the middle of the regulatory period before returning to zero for the last two years. Under this SO trajectory, automakers take advantage of cheap, early fuel economy gains in ICE vehicles before focusing a portion on their effort on incentives for EVs. In general, the optimization will seek the lowest marginal cost of fuel economy improvement. The reason that automakers focus on EVs in the middle of the period, rather than only at the end, is because incurring costs for EVs earlier in the period results in learning that reduces marginal costs later in the period. This reduces total costs (sum of marginal costs) across the whole period. Toward the end of the period,
automakers return their focus to ICE efficiency so that the ICE vehicles demanded by
Cumulative Cost of Compliance
25 20 15 - Total CCC -' Automaker CCC 10 em Automaker EV Incentives ccn-Automaker FST Cost 0 2012 2014 2016 2018 2020 2022 2024
consumers, nearly 100 percent of the market, will be efficient enough to meet the fleet average requirement. In the end, the optimized strategy results in a 2025 CCC for Automakers that is three percent lower ($11.3 billion versus $11.6 billion) than the best constant strategy.
Next, I assume the automakers consider the long-term view of minimizing the CCC through 2050. Under this view, I get the result shown in Figure 17.
Figure 17. Result of Optimization of 2050 CCC: Market Share, Strategic Orientation Toward EVs, and
Cumulative Cost of Comnliance Curves
Strategic Orientation Toward EVs Market Share
0.6 0.8 0.6 - 0.6 0.4 0M2
I
OAJW--0.2V S 2012 2016 2020 2024 2028 2032 2036 2040 2044 2048 2012 2016 2020 2024 2028 2032 2036 2040 2644 2' C
St0rategk Onientabon Toward E~ -EVS -- iCEVs
Under the long-range 2050 vision, SO follows a very different strategy to the myopic 2025 perspective. Automakers start with an SO of 1, which allows them to
achieve rapid initial increase in fuel economy and to jumpstart the EV learning feedback. Subsequently, automakers scale back their focus on EVs as the pressure of meeting the
Cumulative Cost of Compliance
2000 1800 1600 -- Total CCC = 1400 1200 -7 Automaker CCC C 1000 800 in Automaker EV 600 Incentives 400 200 o- i Automaker FST Cost 0 S(N L ro r m w o) mi Ln 0D0 0 00 0 C 00C DD0 00 " r (4 " C4 (N C4 "N C4 (N rA "N "
2025 standard is lessened by their progress in closing the fuel economy gap. When the 2050 CAFE target kicks in in 2025, automakers again shift their focus to EVs to achieve early gains and reinforce EV learning. This time the emphasis on EVs, peaking in 2025 and again in 2042, and cost reduction through learning reinforce the EV market share gains such that the market tips in favor of EVs beginning in 2041. Eventually, the market tips fully toward EVs. In the end, the optimized strategy results in a 2050 CCC for Automakers that is fourteen percent lower ($1.4 trillion versus $1.2 trillion) than the best
constant strategy.
6 Results for Optimal Strategic Orientation Under Weak
2022-2025 CAFE Standards
So far, I have established that optimizing for 2025 versus 2050 cost gives a markedly different optimal level and schedule of SO over the regulatory period. Another
scenario worth considering in the discussion of CAFE compliance optimization is a weakened CAFE regime. As outlined above, the 2022-2025 CAFE standards are at risk of being weakening or eliminating during the Midterm Evaluation. What, in this case, would the optimal strategies for 2025 versus 2050 be? And how might the rate of EV diffusion into the fleet and the total cost of CAFE to 2050 in this scenario compare to the 2050 cost of retaining the augural 2022-2025 standards?
I model the Weak CAFE case in the extreme, which is to say, that the 2022-2025 standards stay constant at the 2021 level. Under a flattened 2022-2025 CAFE target trajectory, we also have to reconsider the 2050 goal. Eliminating the 2022-2025 standards halts the progress of fuel economy improvement in new vehicles. This effect is amplified
stock, even when the progress toward a two-degree scenario compatible 2050 target resumes in 2025. I assess the effect of eliminating the 2022-2025 CAFE rules in the U.S. LDV Fleet Model discussed previously. According to the U.S. LDV Fleet Model, the
average new vehicle would need to achieve 330 MPGghg in 2050 under these weak CAFE conditions. That is to say, the average new vehicle in 2050 will have to achieve 110 additional MPGghg between 2025 and 2050 for the sake of avoiding 7 MPGghg fuel economy increase between 2021 and 2025. What is more, a goal of this magnitude demands additional greening of the electric sector in order for 330 MPGghg to be feasible. The result of the LDV Fleet Model is shown in Figures 18a and 18b. Given that the 330 MPGghg target presupposes the political will to achieve emissions reductions compatible with a two-degree scenario, I assume, for the time being, that the additional greening in the electric sector will be undertaken, up to 82.5% from 80%. Later, I discuss the
consequences of eliminating the 2022-2025 standards in terms of reducing the political will to strive for limiting climate change to two degrees of global warming. Table 3 shows the parameters that differ from the optimization under the augural 2025 standards.
Figure 18a. Figure 18b.
LDV Fuel Economy 2012-2050 LDV Fuel Economy 2012-2050 in Gallons Per Mile (GPM) under Weak 2025 in Miles Per Gallon (MPG) under Weak 2025
CAFE Standard CAFE Standard
0.05 0.04 0.03 0.02 -0.01 -2012 2018 2024 2030 2036 2042 2048
-New Vehicle CAFE GPM -Fleet Average GPM
400.0 300.0 - -200.0 100.0 0.0 2012 2018 2024 2030 2036 2042 2048
Table 3. Model Parameters Changed for Weak CAFE scenario.
Variable Description Default Value Units
2021 Fuel Economy Target Fuel economy required by 2021 under augural CAFE 32 MPGghg
standards.
2050 % Greening of EV Percent by which the grid greens over the regulatory period. 0.825 Dimentionless
Electricity ________ 1_____________________________ ____________
2050 Fuel Economy Target Fuel economy required by 2050 to achieve a two-degree 330 MPGghg
scenario. I I
Again, I begin by finding the optimal level and schedule of SO under the short-term view considering only the 2025 standard for the purpose of minimizing CCC. Under this view, I get the result shown in Figure 19. As expected, the CCC from 2012 to 2025 absent the 2022-2025 goal is lower than if the standards had been maintained (thirty-eight percent, $ 7 billion versus $11.3 billion).
Figure 19. Result of Optimization of 2025 CCC for Weak CAFE: Market Share, Strategic Orientation
Toward EVs, and Cumulative Cost of Compliance Curves
Strategic Orientation Toward EVs Market Share
1
F1
1 fl8 012 20I
I
0.6 0.4 0.2 0 14 2016 2018 2020 2022 2024 2012 2014 2016 2018 2020 2022 2024rategic Orientation Toward EVs EVs -ICEVs
Cumulative Cost of Compliance
14 12 10 8 6 4 2 0 2012 2014 2016 2018 2020 2022 2024 P inTotal CCC inAutomaker CCC in Automaker EV Incentives m Automaker FST Cost 0.8 0.6 0.4 0.2 0 C 0 2
The optimal SO strategy for 2025, absent the 2022-2025 standards, is to focus solely on ICE efficiency until the end of the compliance period, at which point automakers focus for the last two years3 on EVs in as a final gap-closing measure to meet the standard. Market share remains nearly 100 percent ICE vehicles, and as such, the Automaker CCC tracks almost identically with Automaker FST Cost while Automaker EV Incentives remain nearly zero.
I now find the optimal level and schedule of SO under the long-term view of minimizing the CCC through 2050 for the Weak CAFE scenario. Under this view, I get the result shown in Figure 20. The optimal Strategic Orientation under Weak CAFE is a similar shape to the shape of the optimal Strategic Orientation under the augural CAFE standards to 2025. Notably, the temporary shift from Electrification to ICE Efficiency around 2016 is much shorter under Weak CAFE. This is not entirely surprising given that automakers stand to gain much through EV learning as they seek to achieve 330 MPGgbg in 2050. The shorter period of low SO around 2016 under Weak CAFE results in an earlier shift in market share to 100 percent EVs. This shift is driven initially by
automakers offering incentives for EVs up to about 2036, at which time the cumulative Automaker EV Incentives level off. After 2036, EV market share is sustained by EVs having relatively lower prices than ICE vehicles. In this scenario, ICE vehicles play less of a role in compliance strategy because the cost of improving the fuel economy of ICE becomes nearly infinite as ICE vehicles approach the practical limit on the fuel economy this platform can achieve. The Automaker CCC for Weak CAFE is eight percent higher
than the Automaker CCC for baseline CAFE through 2050, if each is achieved by an optimal SO schedule.
Figure 20. Result of Optimization of 2050 CCC for Weak CAFE: Market Share, Strategic Orientation
Toward EVs. and Cumulative Cost of Compliance Curves
Strategic Orientation Toward EVs
0.8 0.6 0.4 0.2 - - ---2012 2016 2020 2024 2028 2032 2036 2040 2044 2048 1! 1500 1000 500
Cumulative Cost of Compliance 2000 -Total CCC i Automaker CCC i Automaker EV Incentives -- Cumulative Spending on FST Deployment 0 N N N N N4 N 4 Market Share 1 0.8 0.6 0.4 0.2 0 2012 2016 2020 2024 2028 2032 2036 2040 2044 2048 - EVs - ICEVs