Publisher’s version / Version de l'éditeur:
Journal of Fuels, 2014, pp. 1-7, 2014-01-02
READ THESE TERMS AND CONDITIONS CAREFULLY BEFORE USING THIS WEBSITE.
https://nrc-publications.canada.ca/eng/copyright
Vous avez des questions? Nous pouvons vous aider. Pour communiquer directement avec un auteur, consultez la première page de la revue dans laquelle son article a été publié afin de trouver ses coordonnées. Si vous n’arrivez pas à les repérer, communiquez avec nous à PublicationsArchive-ArchivesPublications@nrc-cnrc.gc.ca.
Questions? Contact the NRC Publications Archive team at
PublicationsArchive-ArchivesPublications@nrc-cnrc.gc.ca. If you wish to email the authors directly, please see the first page of the publication for their contact information.
NRC Publications Archive
Archives des publications du CNRC
This publication could be one of several versions: author’s original, accepted manuscript or the publisher’s version. / La version de cette publication peut être l’une des suivantes : la version prépublication de l’auteur, la version acceptée du manuscrit ou la version de l’éditeur.
For the publisher’s version, please access the DOI link below./ Pour consulter la version de l’éditeur, utilisez le lien DOI ci-dessous.
https://doi.org/10.1155/2014/390261
Access and use of this website and the material on it are subject to the Terms and Conditions set forth at
Potential of NMR spectroscopy in the characterization of
nonconventional oils
Majid, Abdul; Pihillagawa, Indu
https://publications-cnrc.canada.ca/fra/droits
L’accès à ce site Web et l’utilisation de son contenu sont assujettis aux conditions présentées dans le site LISEZ CES CONDITIONS ATTENTIVEMENT AVANT D’UTILISER CE SITE WEB.
NRC Publications Record / Notice d'Archives des publications de CNRC:
https://nrc-publications.canada.ca/eng/view/object/?id=2c5ade62-2252-4f07-8869-de7d314dad54 https://publications-cnrc.canada.ca/fra/voir/objet/?id=2c5ade62-2252-4f07-8869-de7d314dad54
Research Article
Potential of NMR Spectroscopy in the Characterization of
Nonconventional Oils
Abdul Majid and Indu Pihillagawa
NRC Energy, Mining and Environment Portfolio, National Research Council of Canada, Ottawa, ON, Canada K1A 0R6 Correspondence should be addressed to Abdul Majid; abdul.majid@nrc.gc.ca
Received 9 April 2013; Accepted 25 August 2013; Published 2 January 2014 Academic Editors: E. M. Cuerda-Correa, X. Lu, and O. Senneca
Copyright © 2014 A. Majid and I. Pihillagawa. his is an open access article distributed under the Creative Commons Attribution License, which permits unrestricted use, distribution, and reproduction in any medium, provided the original work is properly cited.
NMR spectroscopy was applied for the characterization of two biomass based pyrolysis oil samples. he samples were extracted in various solvents and the extracts were investigated by both1H and13C NMR spectroscopy. Subsequent evaluation of the integrated analytical data revealed chemical information regarding semiquantitative estimation of various functional groups. his information could not have been obtained readily from the individual spectroscopic techniques. Semiquantitative estimation of the various functional groups allowed a comparison of the extraction eiciency of these groups in various solvents. he method is based on the premise that although the number of individual molecular species in pyrolysis oil liquid is large, most of these species are composed of a limited number of functional groups. he methodology provided information on the concentration of chemical functionalities that are potentially useful for synthetic modiications and may help to guide the use of pyrolysis oil as a chemical feedstock. he approach described is expected to be generally applicable to complex mixture of hydrocarbon oils such as bio-oils, oil sands bitumen, and coal pyrolysis oils.
1. Introduction
Due to the extremely complex nature of nonconventional oils such as bio-oils, oil sands bitumen, and coal pyrolysis oils, structural and compositional analysis of these oils poses a formidable challenge to analytical chemists. A detailed analysis requires careful, laborious combination and inte-gration of voluminous chromatographic and spectroscopic data. Complete analysis of all components of a complex oil containing nonvolatile and/or highly polar or reactive components is generally not within the reach of current ana-lytical methodologies. Although in recent years impressive advances have been made with the physical coupling of two or more chromatographic and/or spectroscopic techniques, such as gas chromatography-mass spectrometry (GC/MS), liquid chromatography-mass spectrometry (LC/MS), and gas chromatography-Fourier transform infrared spectroscopy (GC/FTIR), true integration of the analytical data from these methods is too complex and laborious and is rarely even attempted.
Recently, nuclear magnetic resonance (NMR) spec-troscopy has emerged as a very powerful and versatile
tool for characterization [1–3]. In contrast to most used characterization methods such as chromatography and mass spectroscopy, NMR allows the investigations in solids as well as in solution. Also, over the last few decades, NMR hardware, computer technology, and experimental design have developed simultaneously thus producing modern gen-eration of NMR spectrometers capable of probing complex structures. his has resulted in substantial improvements in the processing and display of spectral data. his has allowed the simpliication of complex NMR spectra.
As an alternative to the conventional analysis, NMR spectrometry method does not require sample pretreatment and thus reduces considerably manipulation time. It is also considered environmentally friendly as it enables the use of minimum amount of solvents with practically no waste gen-eration compared, for instance, to chromatographic methods. NMR method is also capable of simultaneously detecting and quantifying a number of constituents in a single spectrum. he direct NMR spectrometry quantitative method presents advantages over some routine methods: simplicity; rapid-ity; selective recognition; and quantitative determination of metabolites in complex biological matrixes [4]. Quantitative Volume 2014, Article ID 390261, 7 pages
2 Journal of Fuels
1H NMR spectrometry has been reported for the analysis of
natural products, such as olive oil, fruit juice, ginkgo, and ginger powder [5–8]. he use of NMR spectroscopy as a routine analytical tool for process optimization or to follow the progress of separation/extraction eiciency of a particular compound or a group of compounds such as phenols or lignin from bio-oils would be highly desirable.
Bio-oil may be more valuable as a raw material for the manufacturing of value-added chemicals and products than as a fuel. If bio-oils are to be a future source of chemicals production, efective separation methods must be developed to generate fractions of similar polarity and to concentrate the valuable components. In this investigation, we have attempted to assess the feasibility of the preferen-tial concentration of valuable components of two biomass based pyrolysis oil samples by progressive extraction with increasingly polar solvents. NMR data was used to estimate the concentrations of various chemical functional groups in the extracts.
Severe peak overlap in the NMR spectra of complex materials is a detriment to quantization and characterization. However, it is possible to get valuable quantitative infor-mation within±10% precision, by integrating peak clusters representing speciic hydrogen or carbon types [9]. his ofers a powerful tool for the characterization of complex oils. he objective of this investigation was to test the application of this novel NMR method to compare the separation and solvent extraction eiciency of two biomass based pyrolysis oil samples and their characterization. he spectra were integrated over spectral regions to quantify classes of carbon and hydrogen atoms in each oil sample.
2. Experimental Methods
2.1. Materials. Two biomass based oil samples used for this investigation were kept in a cold, dark refrigerator at 5∘C in tightly closed glass bottles. Solvents and reagents used in this investigation were obtained from Aldrich and were of 99– 99.8% purity (veriied by capillary GC).
2.2. Total Methanol Insolubles [10]. Total methanol insolubles (solids content sometimes referred to as char) were deter-mined using modiied Dean-Stark method with methanol as solvent for∼24 hrs. [11–13]. Whatman 43× 123 mm cellulose double thickness extraction thimbles were used for this investigation. Prior to use, 3 rolled Kimwipes were inserted into thimble. himble was placed in a weighing bottle and dried, uncapped, for 1 hour at 120∘C. Ater drying, the weighing bottle was capped and stored in desiccators until needed. At the time of use, weighing bottle plus thimble was weighed to the nearest 0.001 g and placed in its support basket ater removing Kimwipes. Bio-oil sample was transferred to the thimble. Sample bottle was wiped with Kimwipes and Kimwipes were then placed in the thimble. Sample weight was determined from the weights of sample bottle before and ater transfer. Heat with methanol and maintain the relux for 24 hours or until the solvent (methanol) dripping from the thimble becomes colorless. Remove the thimble from its
Oil Pentane Pentane insolubles Toluene Toluene insolubles EA insolubles MeOH Pentane solubles (fraction 1) Toluene soluble (fraction 2) EA solubles (fraction 3) (fraction 4)
MeOH insolubles MeOH solubles (fraction 5)
Ethyl acetate (EA)
CH2Cl2
CH2Cl2insolubles
CH2Cl2solubles
solid-state13C NMR
Figure 1: Solvent extraction scheme.
support and return it to its original weighing bottle. Dry at 120∘C in the uncapped weighing bottle. Cool it in a desiccator and weigh it to the nearest 0.001 g to estimate the methanol insolubles. his represents solids (char) content of bio-oil sample.
2.3. Fractionation. Fractionation was carried out according to the scheme shown inFigure 1. 20 g of oil was successively extracted in diferent solvents using soxhlet extraction [12,
13]. soxhlet extraction apparatus consisted of a 500 mL glass bottle (kettle) and a double thickness cellulose thimble. he sample was transferred to the thimble as described under total methanol insolubles. It was then separated into soluble oil, water, and insoluble by reluxing with the solvent in an extraction apparatus. Condensed solvent and codistilled water were continuously separated in a trap, with the water being retained in the graduated section of the trap. he sol-vent recycled through the extraction thimble of the extraction apparatus to dissolve the oil. he resulting oil/solvent and noniltered solids fractions were separated by centrifuging. he solids (solvent insoluble) were determined gravimetri-cally by combining the contributions for solids retained by the extraction thimble and for the noniltered solids. he trap and its contents (water) were cooled to room temperature and the volume of water in the trap was estimated to the nearest 0.05 mL. hese values compared well with the Karl Fisher titration value (ASTM D-1744). he solvent was removed from each extract by rotary evaporator and the residue was dissolved in deuterated chloroform for NMR investigation. 2.4. Physicochemical Properties. he water content of the oil samples was determined by Karl Fisher titration (ASTM D-1744). he viscosity was measured by ASTM D445. Carbon,
H, N, and S were determined using a LECO CHNS-932 analyser. Ash content of the oil was determined according to ASTM method D-482.
2.5. NMR. NMR analyses were recorded on a Varian Unity Inova spectrometer at a resonance frequency of 399.961 MHz for1H and 100.579 MHz for13C using a 5 mm pulsed ield gradient indirect detection probe or a 10 mm broadband probe.1H and13C NMR spectra were obtained from samples dissolved in CDCl3. he solvent signals (CDCl31H 7.25 ppm,
13C 77.00 ppm) were used as the internal reference. he
peak areas of the spectra were determined by cutting and weighing the desired regions of such spectra that were expanded ten times in the�-axis direction. he values may not be absolute because of signal overlapping. In the case of the examined samples with identical recording conditions and quantiication techniques, however, the signal intensity values are comparable between the samples.
3. Results and Discussion
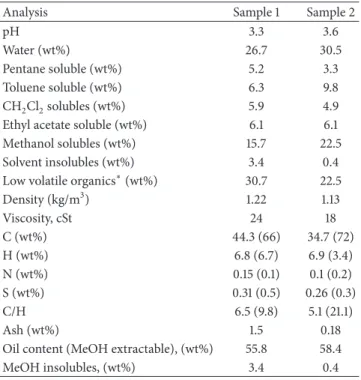
he physicochemical characteristics of the two biomass derived pyrolysis oil samples investigated by NMR are sum-marized inTable 1. Both samples were progressively extracted with increasingly polar solvents using a scheme shown in
Figure 1. A comparison of the extraction eiciency in various solvents suggests that the maximum amount of the oil was extracted in methanol followed by toluene. Also, there were considerably more solvent extractables from bio-oil sample 2 as compared to sample 1. he amount of extractables, solvent insoluble, and water did not add up to 100% of the initial weight of oil. A considerable amount remained unaccounted for and was presumed to be low boiling volatiles lost during solvent removal stage. Compared with bio-oil sample 2, there were considerably more low boiling volatiles in bio-oil sample 1.
he extracts were analyzed by NMR to estimate the concentrations of various chemical functional groups that are potentially useful for synthetic modiications in using bio-oil as a chemical feedstock. he method is based on the assumption that although the number of individual molecular species in the bio-oil samples is large, most of these species are composed of a limited number of functional groups. he relative concentrations of the functional groups may provide useful information to assess the bio-oil as a chemical feedstock for the potential end products. he individual spectra and subspectra were divided into smaller sections based on the chemical shit ranges that correspond to diferent chemical functional groups, and this was followed by integration. he integrated peak areas in each section were then calculated as percentage of total peak area of the whole spectrum. his was assumed to be proportional to the concentration of compounds in the section [13]. he assignments are based on published work [14–21].
he comparative proton NMR spectra of various extracts from two biooil samples are shown in Figures2(a)and2(b), and the integral values of selected regions of the spectra on a percentage basis are presented inTable 2. A comparison
Table 1: Physicochemical properties of bio-oil samples investigated.
Analysis Sample 1 Sample 2
pH 3.3 3.6
Water (wt%) 26.7 30.5
Pentane soluble (wt%) 5.2 3.3 Toluene soluble (wt%) 6.3 9.8 CH2Cl2solubles (wt%) 5.9 4.9 Ethyl acetate soluble (wt%) 6.1 6.1 Methanol solubles (wt%) 15.7 22.5 Solvent insolubles (wt%) 3.4 0.4 Low volatile organics∗(wt%) 30.7 22.5 Density (kg/m3) 1.22 1.13 Viscosity, cSt 24 18 C (wt%) 44.3 (66) 34.7 (72) H (wt%) 6.8 (6.7) 6.9 (3.4) N (wt%) 0.15 (0.1) 0.1 (0.2) S (wt%) 0.31 (0.5) 0.26 (0.3) C/H 6.5 (9.8) 5.1 (21.1) Ash (wt%) 1.5 0.18
Oil content (MeOH extractable), (wt%) 55.8 58.4 MeOH insolubles, (wt%) 3.4 0.4
∗By diference, calculated as 100− (total extractables recovered + water +
solvent insolubles).
Values in parenthesis are for methanol insoluble solids.
of these results suggests that there are no major diferences in the overall chemical makeup of the two biooils. he most upield region of the spectra, from 0 to 4.4 ppm, representing aliphatic protons that are attached to carbon atoms, at least two bonds, removed from a C=C double bond or heteroatom (O or N) as well as protons on carbon atoms next to an aliphatic alcohol or ether, or a methylene group that joins two aromatic rings, was most populated for both samples. he later moiety would exist in partially decomposed lignin oligomer present in the bio-oil [17]. It has been reported that aliphatic portions of molecules, even those bonded to aromatic portions or near heteroatoms, are more prevalent for the higher energy containing bio-oils [15]. he data suggests a signiicant amount of higher energy containing components in these bio-oils. he data also indicates limited selectivity for some components. Alcohols, ethers, and car-bohydrate components appear to be more concentrated in polar solvents such as methanol, ethyl acetate, and methylene chloride compared with nonpolar solvents such as pentane and toluene. Aromatic and phenolic components were more concentrated in nonpolar solvents. Extracts from sample 1 had relatively higher concentrations of aldehyde, ketone, and acid components than sample 2.
he bar chart in Figure 3 compares the total amount of various functional groups ater taking into account the extract yield in diferent solvents. he highest amounts of aliphatic components (region between 0–4.4 ppm) were extracted in methanol followed by toluene. he extracts in other solvents had the least amount of protons in this category.
4 Journal of Fuels
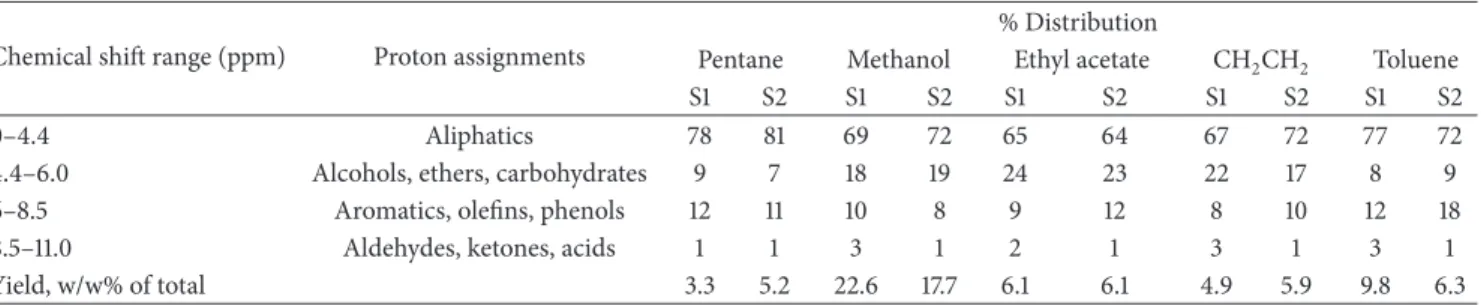
Table 2: % of H based on1H NMR analysis of bio-oil extracts in various solvents∗.
Chemical shit range (ppm) Proton assignments
% Distribution
Pentane Methanol Ethyl acetate CH2CH2 Toluene
S1 S2 S1 S2 S1 S2 S1 S2 S1 S2
0–4.4 Aliphatics 78 81 69 72 65 64 67 72 77 72
4.4–6.0 Alcohols, ethers, carbohydrates 9 7 18 19 24 23 22 17 8 9 6–8.5 Aromatics, oleins, phenols 12 11 10 8 9 12 8 10 12 18
8.5–11.0 Aldehydes, ketones, acids 1 1 3 1 2 1 3 1 3 1
Yield, w/w% of total 3.3 5.2 22.6 17.7 6.1 6.1 4.9 5.9 9.8 6.3
∗Grouped according to chemical shit range; S1, S2 = bio-oil samples 1 and 2.
0 1 2 3 4 5 6 7 8 9 10 11 0 20 40 60 80 1 H NMR chemical shifts (ppm) Methanol CH2CH2 Ethyl acetate Toluene Pentane ×108 (a.u .) (a) 0 20 40 60 ×108 0 1 2 3 4 5 6 7 8 9 10 11 1 H NMR chemical shifts (ppm) Methanol CH2 Ethyl acetate Toluene Pentane (a.u .) Cl2 (b)
Figure 2: Comparative1H NMR of biooil samples in various solvents. (a) Sample 1. (b) Sample 2.
he region between 4.4 and 6.0 ppm represents aromatic ether protons (i.e., lignin derived methoxyphenols) and many of the hydrogen atoms of carbohydrate-like molecules. hese protons are also most prevalent for methanol followed by ethyl acetate and are found in smaller amounts in other solvents.
he region between 6 and 8.5 ppm in the spectrum rep-resents aromatics, oleins, and lignin derived phenolics. his region may be important for potential end products made from bio-oil. he distribution of these protons essentially follows the same trend as aliphatics.
he downield spectral regions (8.5–11 ppm) of the extracts contain resonances that most likely arise from aldehydes, ketones, and carboxylic acids. he proton NMR data suggests a slightly diferent distribution pattern in this region. Most of these components are present in methanol extract followed by toluene extract. All other extracts have very little amounts of these components.
he data presented inFigure 3suggests that the selective concentration of the potentially useful components from bio oil samples solely by the solvent extraction scheme used in this investigation may not be feasible. However, a selective separation scheme could start with methanol extract as it contained the highest concentration of all compo-nents. For example, the formation of inclusion complexes with cyclodextrins could be worth exploring as one of the potentially promising inexpensive methods for the selective separation of aromatics from methanol extract [22–24].
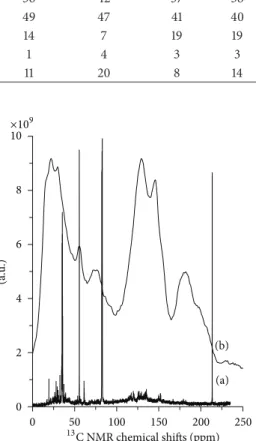
Bio-oil sample 1 and char were also investigated using13C NMR spectroscopy for comparison purposes. he13C NMR spectra of these samples are shown inFigure 4. he data from integration values of various regions are tabulated inTable 3.
Table 3 provides an overview of the entire carbon content within a given chemical shit range, providing information on the types of chemical functional groups that are present in that range, as well as their relative amounts. he percentage
Table 3: Percentage distribution of carbon based on13C NMR data for char and bio-oil sample 1.
13C Chemical shit range (ppm) Assignments % Distribution
Pentane Methanol Ethyl acetate CH2CH2 Toluene Char
0–60 Aliphatics 41 36 42 37 38 26
60–110 Alcohols, ethers, and carbohydrates 47 49 47 41 40 27
110–165 Aromatics, oleins, and phenols 10 14 7 19 19 34
165–220 Aldehydes, ketones, and acids 2 1 4 3 3 13
60–80 Intact carbohydrates 9 11 20 8 14 8 0 5 10 15 20 25 Aliphatics
Alcohols, ethers, and carbohydrates Aromatics, phenols
Aldehydes, ketones, and acids
S1 S2 S1 S2 S1 S2 S1 S2 S1 S2
S = Sample
MethanolEthyl acetate Toluene
Pentane CH2Cl2 A s f rac tio n yield (T ab le 1)
Figure 3: Total amount of functional group distribution from proton NMR data.
values in the upield regions listed in Table 3 for the bio-oil extracts do not agree well with those from1H NMR as seen from a comparative plot in Figure 5. In general, the values for aliphatic region obtained from 13C NMR data are a lot lower compared with the corresponding values obtained from proton NMR data. he amounts of carbon in the ether, alcohols, and carbohydrate region are a lot higher than of the corresponding hydrogen. However, the total of the two regions compares well, suggesting that the arbitrary assignments for the two data sets may not be compatible.
Contrary to upield regions, there is much better compar-ison between the downield regions of the1H and13C NMR data sets. his could be signiicant because the detection and relative quantiication of aldehydes and ketones provide potentially useful information for applications involving the synthetic modiication of bio-oils [15].
A comparison of the13C NMR data for char and solvent extracts suggests the following.
(a) Aliphatics, ethers, and alcoholic components are enriched in solvent extracts but depleted in the char.
0 50 100 150 200 250 0 2 4 6 8 10 (a) (b) (a.u .) 13 C NMR chemical shifts (ppm) ×109
Figure 4: 13C NMR spectra of bio-oil sample 1. (a) Solution in CDCl3, (b) solid-state char.
(b) Aromatics, aldehydes, ketones, and acidic compo-nents are enriched in the char fraction.
hus, extracts could be source of higher energy fuels, while char can be used as a feedstock for value-added chemicals [15].
he presence of intact carbohydrates estimated from carbons found between 60 and 80 ppm may represent an important consideration for some end products [15].Table 3
lists the amount of intact carbohydrates estimated from13C NMR data. he highest amount of intact carbohydrates (20%) was found in ethyl acetate extract, suggesting that selective extraction of these components by solvent extraction may be feasible.
4. Summary and Conclusions
he NMR data for the two bio-oil samples investigated demonstrates that it can provide important information about not only the kinds of chemicals in bio-oils but also their relative concentrations. A combination of1H and13C NMR techniques is expected to ofer a powerful tool for the characterization of bio-oils.
6 Journal of Fuels 0 20 40 60 80 100 w/w% o f t o ta l
MethanolEthyl acetate Toluene Char
Pentane CH2Cl2 1 H 13 C 1 H 13 C 1 H 13 C 1 H 13 C 1 H 13 C 13 C Aliphatics
Alcohols, ethers, and carbohydrates Aromatics, phenols
Aldehydes, ketones, and acids
Figure 5: Comparison of 1H and13C NMR data for sample 1.
A solvent extraction scheme employing extraction with increasingly polar solvents was tested for preferential con-centration and separation of valuable components of two biomass based pyrolysis oil samples. Proton NMR spec-troscopy was employed to characterize extracts and to mea-sure the extraction eiciency of various solvents. he analyses of the NMR data led to the following conclusions.
(1) he maximum amount of the oil was extracted in methanol followed by toluene. Also, there were considerably more solvent extractables from bio-oil sample 2, as compared to sample 1.
(2) Compared with bio-oil sample 2, there were more low boiling volatiles in bio-oil sample 1.
he NMR data allowed semi-quantitative estimation of the various functional groups by integrating peak clusters rep-resenting speciic hydrogen types. he method is capable of simultaneously detecting and quantifying a number of chemical functionalities in a single spectrum. he spectra were divided into four regions corresponding to speciic functionalities.
Region 1, 0–4.4 ppm, represents aliphatic protons that are associated with higher energy containing components signiicant for the use of oil as a fuel; region 2, 4.4– 6.0 ppm, represents protons belonging to alcohols, ethers, and carbohydrates; region 3, 6–8.5 ppm, represents aromatic, oleins, and phenolic protons; and region 4, 8.5–11.0 ppm, represents aldehyde, ketone, and acidic functional groups. An examination of the1H NMR data suggests the following.
(1) here are no major diferences in the overall chemical makeup of the two bio-oil samples.
(2) he major components of both bio-oil samples were aliphatic protons that contribute to higher energy and make the oil suitable as a fuel.
(3) Alcohols, ethers, and carbohydrate components were more concentrated in polar solvents such as methanol, ethyl acetate, and methylene chloride compared with nonpolar solvents such as pentane and toluene.
(4) Nonpolar solvents extract more aromatics.
(5) Aldehyde, ketones, and acids were mostly present in methanol extract followed by toluene. All other extracts had very little amount of these components. (6) Compared with sample 2, the extracts from sample
1 had relatively higher concentrations of aldehydes, ketones, and acidic components.
(7) Lignin derived methoxy protons and many of the hydrogen atoms of carbohydrate like molecules were more prevalent in methanol extract followed by ethyl acetate.
In conclusion, the1H NMR data suggests that the selective concentration of potentially useful components from bio-oil samples solely by the solvent extraction scheme used in this investigation may not be feasible. However, based on our previous work [22–24], it may be possible to develop a poten-tially promising selective separation method for value-added chemicals from aromatics rich fractions using cyclodextrins. Methanol extract can also be used as a feedstock for the selective separation of aromatics using cyclodextrins com-plexation process.
he percentage of functional groups calculated from1H and13C NMR data in the upield regions did not compare well because of the noncompatibility of the arbitrary NMR chemical shit assignments in the two data sets. However, the comparison in the downield regions was much better.
A comparison of the13C NMR data for char and solvent extracts from sample 1 suggests major diferences in the overall chemical makeup of the two. Aliphatics, ethers, and alcoholic components were more prevalent in the extracts, but aromatics, aldehydes, and ketones had higher concen-trations in char. his suggests that char may be used as a feedstock for value-added chemicals.
he13C NMR data also suggests the highest concentra-tions of intact carbohydrates in ethyl acetate extracts.
Acknowledgments
he authors are grateful to Dr. Stephen Lang for solid-state
13C NMR spectra of char sample and Gilles Robertson for
solution13C NMR spectra. his paper is supported by NRCC no. 53088.
References
[1] J. W. Finley, S. J. Schmidt, and A. S. Serianni, NMR Applications in Biopolymers, Plenum Press, New York, NY, USA, 1990. [2] J. Joseph, C. Baker, S. Mukkamala et al., “Chemical shits and
lifetimes for nuclear magnetic resonance (NMR) analysis of biofuels,” Energy and Fuels, vol. 24, no. 9, pp. 5153–5162, 2010. [3] G. D. Strahan, C. A. Mullen, and A. A. Boateng, “Characterizing
biomass fast pyrolysis oils by 13C NMR and chemometric analysis,” Energy and Fuels, vol. 25, no. 11, pp. 5452–5461, 2011. [4] E. Hiltunen, L. Alvila, and T. T. Pakkanen, “Characterization
of Brauns’ lignin from fresh and vacuum-dried birch (Betula pendula) wood,” Wood Science and Technology, vol. 40, no. 7, pp. 575–584, 2006.
[5] G. F. Pauli, B. U. Jaki, and D. C. Lankin, “Quantitative1H NMR: development and potential of a method for natural products analysis,” Journal of Natural Products, vol. 68, no. 1, pp. 133–149, 2005.
[6] G. Vlahov, “Application of NMR to the study of olive oils,” Progress in Nuclear Magnetic Resonance Spectroscopy, vol. 35, no. 4, pp. 341–357, 1999.
[7] I. Berregi, G. Campo, R. Caracena, and J. I. Miranda, “Quanti-tative determination of formic acid in apple juices by1H NMR spectrometry,” Talanta, vol. 72, no. 3, pp. 1049–1053, 2007. [8] Y. H. Choi, H.-K. Choi, A. Hazekamp et al., “Quantitative
analysis of bilobalide and ginkgolides from Ginkgo biloba leaves and Ginkgo products using1H-NMR,” Chemical and Pharmaceutical Bulletin, vol. 51, no. 2, pp. 158–161, 2003. [9] L. L. Landucci, “Quantitative carbon-13 NMR characterization
of lignin 1. A methodology for high precision,” Holzforschung, vol. 39, pp. 355–359, 1985.
[10] M. E. Boucher, A. Chaala, and C. Roy, “Bio-oils obtained by vacuum pyrolysis of sotwood bark as a liquid fuel for gas turbines—part I: properties of bio-oil and its blends with methanol and a pyrolytic aqueous phase,” Biomass and Bioen-ergy, vol. 19, no. 5, pp. 337–350, 2000.
[11] J. T. Bulmer and J. Starr, Syncrude Analytical Methods for Oil Sand and Bitumen Processing, Syncrude Canada, Edmonton, Canada, 1979.
[12] A. Majid and B. D. Sparks, “Total analysis of mineral wastes con-taining bitumen, solvent, water and solids,” AOSTRA Journal of Research, vol. 1, pp. 21–29, 1984.
[13] A. Majid and J. Woods, “Rapid determination of Bitumen, Varsol and other Solvents using Proton NMR,” ACS Division of Fuel Chemistry, vol. 28, no. 1, pp. 188–195, 1983.
[14] C. A. Mullen, G. D. Strahan, and A. A. Boateng, “Characteri-zation of various fast-pyrolysis bio-oils by NMR spectroscopy,” Energy and Fuels, vol. 23, no. 5, pp. 2707–2718, 2009.
[15] K. Lundquist, “1H NMR spectral studies of lignins, quantitative estimates of some types of structural elements,” Nordic Pulp and Paper Research Journal, vol. 6, pp. 140–146, 1991.
[16] K. Lundquist, “1H NMR spectral studies of lignins,” Nordic Pulp and Paper Research Journal, vol. 7, pp. 4–8, 1992.
[17] K. Lundquist and K. Stern, “Analysis of lignins by1H NMR spectroscopy,” Nordic Pulp and Paper Research Journal, vol. 3, pp. 210–213, 1989.
[18] K. Lundquist, “Proton (1H) NMR spectroscopy,” in Methods in Lignin Chemistry, S. Y. Lin and C. W. Dence, Eds., pp. 242–249, Springer, New York, NY, USA, 1992.
[19] J. Sorvari, E. Sj¨ostr¨om, A. Klemola, and J. E. Laine, “Chemical characterization of wood constituents, especially lignin, in
fractions separated from middle lamella and secondary wall of Norway spruce (Picea abies),” Wood Science and Technology, vol. 20, no. 1, pp. 35–51, 1986.
[20] J. B. Stothers, Carbon-13 NMR Spectroscopy, Academic Press, 1972.
[21] K. Lundquist, “NMR studies of lignins. 4. Investigation of Spruce lignin by1H NMR spectroscopy,” Acta Chemica Scan-dinavica B, vol. 34, pp. 21–26, 1980.
[22] A. Majid and J. A. Ripmeester, “Inclusion complexes of cyclodextrins by agglomeration,” United States patent no. 5070081, December 1991.
[23] A. Majid and J. A. Ripmeester, “Inclusion complexes of cyclodextrins by agglomeration,” Canadian patent no. 1321192, August 1993.
[24] A. Majid and J. A. Ripmeester, “Spherical agglomeration-a novel technique for simultaneous pelletization and preparation of cyclodextrin inclusion compounds,” Cyclodextrin News, vol. 4, pp. 49–50, 1990.
Submit your manuscripts at
http://www.hindawi.com
Hindawi Publishing Corporation http://www.hindawi.com
Journal of
Engineering
Volume 2013
Energy
Journal ofHindawi Publishing Corporation
http://www.hindawi.com Volume 2013
Journal of
Hindawi Publishing Corporation
http://www.hindawi.com Volume 2013
Renewable Energy
ISRN Chemical Engineering
Hindawi Publishing Corporation
http://www.hindawi.com Volume 2013
Hindawi Publishing Corporation
http://www.hindawi.com Volume 2013
Solar Energy
Journal ofPower Electronics
Hindawi Publishing Corporation http://www.hindawi.com
Volume 2013
Advances in
Hindawi Publishing Corporation
http://www.hindawi.com Volume 2013
International Journal of
Photoenergy
ISRN
Biotechnology
Hindawi Publishing Corporation
http://www.hindawi.com Volume 2013
Hindawi Publishing Corporation
http://www.hindawi.com Volume 2013
Nuclear Energy
International Journal of Hindawi Publishing Corporationhttp://www.hindawi.com Volume 2013
Wind Energy
Journal of ISRN Mechanical EngineeringHindawi Publishing Corporation
http://www.hindawi.com Volume 2013
Fuels
Journal ofHindawi Publishing Corporationhttp://www.hindawi.com Volume 2013
ISRN
Renewable Energy
Hindawi Publishing Corporation
http://www.hindawi.com Volume 2013
Hindawi Publishing Corporation
http://www.hindawi.com Volume 2013
High Energy PhysicsAdvances in
Hindawi Publishing Corporation
http://www.hindawi.com Volume 2013
Mechanical Engineering
Advances in
Hindawi Publishing Corporation
http://www.hindawi.com Volume 2013Number 1
Science and Technology of
Nuclear
Installations
Hindawi Publishing Corporation
http://www.hindawi.com Volume 2013 Hindawi Publishing Corporation
http://www.hindawi.com Volume 2013
The Scientiic
World Journal
ISRN
High Energy Physics
Hindawi Publishing Corporation
http://www.hindawi.com Volume 2013
Combustion
Journal ofHindawi Publishing Corporation