Publisher’s version / Version de l'éditeur:
Journal of the American Chemical Society, 134, 35, pp. 14609-14617, 2012-08-10
READ THESE TERMS AND CONDITIONS CAREFULLY BEFORE USING THIS WEBSITE.
https://nrc-publications.canada.ca/eng/copyright
Vous avez des questions? Nous pouvons vous aider. Pour communiquer directement avec un auteur, consultez la première page de la revue dans laquelle son article a été publié afin de trouver ses coordonnées. Si vous n’arrivez pas à les repérer, communiquez avec nous à PublicationsArchive-ArchivesPublications@nrc-cnrc.gc.ca.
Questions? Contact the NRC Publications Archive team at
PublicationsArchive-ArchivesPublications@nrc-cnrc.gc.ca. If you wish to email the authors directly, please see the first page of the publication for their contact information.
NRC Publications Archive
Archives des publications du CNRC
This publication could be one of several versions: author’s original, accepted manuscript or the publisher’s version. / La version de cette publication peut être l’une des suivantes : la version prépublication de l’auteur, la version acceptée du manuscrit ou la version de l’éditeur.
For the publisher’s version, please access the DOI link below./ Pour consulter la version de l’éditeur, utilisez le lien DOI ci-dessous.
https://doi.org/10.1021/ja306227p
Access and use of this website and the material on it are subject to the Terms and Conditions set forth at
Variable temperature 17O NMR studies allow quantitative evaluation of
molecular dynamics and hydrogem bond energies in organic solids
Kong, Xianqi; O'Dell, Luke A.; Terskikh, Victor; Ye, Eric; Wang, Ruiyao; Wu,
Gang
https://publications-cnrc.canada.ca/fra/droits
L’accès à ce site Web et l’utilisation de son contenu sont assujettis aux conditions présentées dans le site LISEZ CES CONDITIONS ATTENTIVEMENT AVANT D’UTILISER CE SITE WEB.
NRC Publications Record / Notice d'Archives des publications de CNRC:
https://nrc-publications.canada.ca/eng/view/object/?id=aeae244f-b5e6-4cb0-a2c2-6b8d918c18dc https://publications-cnrc.canada.ca/fra/voir/objet/?id=aeae244f-b5e6-4cb0-a2c2-6b8d918c18dcVariable-Temperature
17
O NMR Studies Allow Quantitative
Evaluation of Molecular Dynamics in Organic Solids
Xianqi Kong,
†Luke A. O’Dell,*
,‡,⊥Victor Terskikh,
‡Eric Ye,
§Ruiyao Wang,
†and Gang Wu*
,††
Department of Chemistry, Queen’s University, 90 Bader Lane, Kingston, Ontario K7L 3N6, Canada ‡
National Research Council Canada, 100 Sussex Drive, Ottawa, Ontario K1A 0R6, Canada §
Department of Chemistry, University of Ottawa, 10 Marie Curie Private, Ottawa, Ontario K1N 6N5, Canada
*
S Supporting InformationABSTRACT: We report a comprehensive variable-temperature solid-state 17O NMR study of three 17O-labeled crystalline
sulfonic acids: 2-aminoethane-1-sulfonic acid (taurine, T), 3-aminopropane-1-sulfonic acid (homotaurine, HT), and 4-amino-butane-1-sulfonic acid (ABSA). In the solid state, all three compounds exist as zwitterionic structures, NH3+−R−SO3−, in
which the SO3−group is involved in various degrees of O···H−N
hydrogen bonding. High-quality 17O NMR spectra have been
obtained for all three compounds under both static and magic angle spinning (MAS) conditions at 21.1 T, allowing the
complete set of17O NMR tensor parameters to be measured. Assignment of the observed17O NMR parameters to the correct
oxygen sites in the crystal lattice was achieved with the aid of DFT calculations. By modeling the temperature dependence of17O
NMR powder line shapes, we have not only confirmed that the SO3−groups in these compounds undergo a 3-fold rotational
jump mechanism but also extracted the corresponding jump rates (102−105s−1) and the associated activation energies (E a) for
this process (Ea= 48 ± 7, 42 ± 3, and 45 ± 1 kJ mol−1for T, HT, and ABSA, respectively). This is the first time that SO3−
rotational dynamics have been directly probed by solid-state 17O NMR. Using the experimental activation energies for SO 3−
rotation, we were able to evaluate quantitatively the total hydrogen bond energy that each SO3−group is involved in within the
crystal lattice. The activation energies also correlate with calculated rotational energy barriers. This work provides a clear illustration of the utility of solid-state 17O NMR in quantifying dynamic processes occurring in organic solids. Similar studies
applied to selectively17O-labeled biomolecules would appear to be very feasible.
1. INTRODUCTION
The bulk properties of a solid material can be influenced by dynamic processes as well as by structure. A detailed understanding of the various motions occurring in a system can therefore be just as important as a knowledge of the molecular or crystal structure itself, perhaps more so. Solid-state nuclear magnetic resonance (NMR) spectroscopy has for many decades been a valuable tool for the characterization of molecular dynamics in materials.1−4In particular, quadrupolar nuclei (with spin numbers I > 1/2) can be used to quantify dynamics in terms of rate constants, motional geometries, and activation energies, providing a detailed picture of vibrational, rotational, or translational motions that might not be possible to obtain using other techniques.5−7 The integer spin 2H
isotope (I = 1) has been especially useful in this regard due to several factors. The isotope’s low natural abundance (0.012%) requires hydrogen sites to be selectively labeled, allowing specific dynamic regions such as methyl groups to be targeted in large or complex molecular systems.8−15Solid-state2H NMR
spectra are relatively easy to obtain, and their analysis is straightforward due to the relative simplicity of the 2H spin
system, in which only an axially symmetric, first-order quadrupolar interaction (FOQI) oriented along the covalent
bond needs to be modeled. The most common experimental approach is to obtain2H NMR spectra from a static powder
sample over a range of temperatures using a spin−echo pulse sequence and then to fit these line shapes to simulated patterns calculated under various dynamic models and rates. Solid-state
2H NMR continues to be an invaluable tool in this regard, and
the same principles have also been applied to 14N, another
integer spin (I = 1) isotope.16 However, since approximately three-quarters of NMR-active isotopes are half-integer quadru-poles (I = n/2, n = 3, 5, 7, or 9), the development of the above methodology for such nuclei is of considerable interest. In this case, it is generally only the central transition (+1/2 ↔ −1/2) that is observed, with the powder line shape broadened by both the second-order quadrupolar interaction (SOQI) and chemical shift anisotropy. It is important to note that the SOQI is more complex to model than the FOQI due to the presence of both second- and fourth-rank tensor terms. Recent years have seen much progress made in developing theoretical descriptions of the effects of dynamics on the central transition powder patterns for half-integer quadrupolar nuclei.17−21
Received: June 26, 2012
Published: August 10, 2012
Due to the importance and ubiquity of oxygen in inorganic, organic, and biological systems, the potential of the17O nucleus
as a probe of dynamic processes in solids is becoming increasingly recognized. The17O isotope (I = 5/2) has a very
low natural abundance (0.037%) and thus is inherently insensitive but otherwise relatively straightforward to study using solid-state NMR, particularly at higher magnetic field strengths.22,23Its relatively modest quadrupole moment (−25.6 mb) combined with a chemical shift range in excess of 1500 ppm means that17O NMR spectra of relatively high resolution
can often be obtained under magic angle spinning (MAS) conditions. Although broadening due to the SOQI can be completely eliminated by using advanced techniques such as dynamic-angle spinning (DAS),24,25 double rotation (DOR),26−28 multiple-quantum MAS (MQMAS),29,30 or satellite transition MAS (STMAS),31their applications to17O
NMR have been almost exclusively limited to studies of small molecules.32−49For biological macromolecular systems, the low sensitivity associated with very dilute17O concentrations often
makes it rather difficult to apply these advanced techniques. In these cases, as demonstrated recently by Zhu et al.50in a solid-state 17O NMR study of ligand−protein complexes, a
combination of MAS and high magnetic field strength can allow different sites to be resolved.
While considerable progress has been made in recent years in solid-state 17O NMR studies of inorganic and organic
molecules, fewer examples can be found in the literature regarding17O NMR studies of molecular dynamics in the solid
state.17,51−57 The first use of 17O NMR powder patterns to
extract dynamic information was reported by Witschas et al.17 who studied the rotation of PO43− ions in crystalline Na3PO4
over a range of temperatures and demonstrated the shapes of the spectra to be sensitive to both the rate and geometry of the motion. In other applications,17O MAS experiments were used
to study oxygen dynamics in ionic conductors with jump rates on the order of 104 s−1,51
and two-dimensional exchange experiments yielded information about much slower motions on the order of 10 s−1.52
More recently, Ba et al.57used solid-state17O NMR to probe water molecular reorientation in ice
and tetrahydrofuran (THF) clathrate hydrate.
The vast majority of 17O NMR dynamics studies reported
thus far have been restricted to oxygen sites in tetrahedral MO4
groups present within inorganic crystal structures, which feature relatively small quadrupolar interactions and give correspond-ingly narrow MAS line widths. Oxygen sites within organic or biological molecules typically exist within sites of lower local symmetry and therefore give broader 17O NMR line widths,
making them more difficult to study.23Moreover, the dynamic mechanisms they exhibit will seldom involve simple tetrahedral reorientation between equivalent oxygen environments. We have recently used a combination of 17O isotopic enrichment
and high-field NMR (21.1 T) to measure the 17O tensor
parameters in crystalline taurine, resolving the three individual oxygen sites in a sulfonate group for the first time.58Herein, we use variable-temperature solid-state 17O NMR to study the
rotational dynamics of this functional group in three 17
O-labeled crystalline sulfonic acids: 2-aminoethane-1-sulfonic acid (taurine, T), 3-aminopropane-1-sulfonic acid (homotaurine, HT), and 4-aminobutane-1-sulfonic acid (ABSA). These compounds belong to a group of organic amino sulfonic acids that have been shown either to be important to brain functions or to have potential applications in the treatment of central nervous system disorders. In particular, taurine is a
neurotransmitter and has multiple biological functions,59−62 while homotaurine has been shown to bind to β-amyloid and has therapeutic effects in the treatment of Alzheimer’s disease.63−68
In the solid state, as illustrated in Figure 1, each molecule adopts a zwitterionic structure with the sulfur atoms existing as
sulfonate groups (SO3−). The S−O bond distances vary
between 1.445 and 1.471 Å, while the C−S−O bond angles range from 105.5° to 107.6°. The sulfonate groups of T and HT show close to C3symmetry about the C−S bond, with each
oxygen atom involved in one or more hydrogen bonds of the O···H−N type.69,70 ABSA is expected to exhibit similar structural features; however, its crystal structure has not yet been reported in the literature. In this work, we use single-crystal XRD to determine the single-crystal structure of ABSA in order to obtain a complete set of structural data for the three compounds studied. We then determine the activation energies of the sulfonate rotations directly from the17O NMR spectra
using numerical spectral simulations and a detailed knowledge of the various interaction tensors for each oxygen site. Subsequently, we correlate these data with the hydrogen bond energy, as well as rotational energy barriers calculated from the crystal structures.
2. EXPERIMENTAL DETAILS
2a. Sample Preparation. Three 17O isotopically enriched
compounds were prepared for this investigation. Synthesis of 17
O-enriched 2-aminoethane-1-sulfonic acid ([17O
3]-taurine) was reported
in a previous study.58 Sodium sulfite (300 mg, 2.38 mmol) was dissolved in [17O]-water (1.16 g, 41%17O-enriched, purchased from
CortecNet, France). The solution was kept at room temperature for 23 h. Then to the solution was added 2-bromoethylamine hydrochloride (585 mg, 2.86 mmol). The mixture was stirred at 65 ± 3 °C in an oil bath for 13 h. The [17O]-water was recovered. The residual material
was refluxed in methanol (30 mL) for 30 min, cooled to room temperature, collected (filtration), washed with ethanol (2 × 10 mL), Figure 1. The crystallographic molecular structures of the three compounds studied, (a) taurine, (b) homotaurine, and (c) ABSA. Color codes are as follows: hydrogen (white), carbon (gray), nitrogen (blue), sulfur (yellow), and oxygen (red).
Journal of the American Chemical Society Article
dx.doi.org/10.1021/ja306227p | J. Am. Chem. Soc. 2012, 134, 14609−14617
and dried at 80 °C. The crude product was dissolved in 1 mL of 40% hydrobromic acid and filtered through sintered glass. To the filtrate was added ethanol (35 mL) to precipitate out the product. The solid material was then washed with ethanol (4 × 10 mL) and dried in an oven (80 °C) overnight, giving 220 mg white solid (74% yield). The
17O enrichment in [17O
3]-taurine was determined to be 23% by
solution 17O NMR. [17O
3]-3-Aminopropane-1-sulfonic acid ([17O3
]-homotaurine) and [17O
3]-4-aminobutane-1-sulfonic acid ([17O3
]-ABSA) were synthesized in the same fashion as described for [17O
3]-taurine, except that 3-bromopropylamine hydrochloride and
4-bromobutylamine hydrochloride were used respectively. The level of
17O-enrichment was estimated from solution17O NMR spectra: 17%
in [17O
3]-homotaurine; 24% in [17O3]-ABSA.
2b. Crystal Structure Determination for ABSA. A colorless crystal of ABSA (size 0.25 × 0.15 × 0.06 mm3) obtained from slow
evaporation of an aqueous solution was mounted on a glass fiber with grease and cooled to −93 °C in a stream of nitrogen gas controlled with Cryostream Controller 700. Data collection was performed on a Bruker SMART APEX II X-ray diffractometer with graphite-monochromated Mo Kα radiation (λ = 0.71073 Å), operating at 50 kV and 30 mA over 2θ ranges of 5.40−52.00°. No significant decay was observed during the data collection. Data were processed on a PC using the Bruker AXS Crystal Structure Analysis Package: Data collection, APEX2 (Bruker, 2010); cell refinement, SAINT (Bruker, 2009); data reduction, SAINT (Bruker, 2009); structure solution, XPREP (Bruker, 2008) and SHELXTL (Bruker, 2008); structure refinement, SHELXTL; molecular graphics, SHELXTL; publication materials, SHELXTL. Neutral atom scattering factors were taken from Cromer and Waber.71 The crystal is monoclinic, space group P21/c,
based on the systematic absences, E statistics, and successful refinement of the structure. The structure was solved by direct methods. Full-matrix least-squares refinements minimizing the function ∑w(Fo2 − Fc2)2 were applied. All non-hydrogen atoms
were refined anisotropically. All H atoms were placed in geometrically calculated positions, with C−H = 0.99 and N−H = 0.99 Å, and refined as riding atoms, with Uiso(H) = 1.2Ueq(C) or 1.5Ueq(N). Convergence
to final R1 = 0.0306 and wR2 = 0.0789 for 1166 (I > 2σ(I))
independent reflections and R1= 0.0375 and wR2= 0.0832 for all 1362
(R(int) = 0.0203) independent reflections, with 83 parameters and 0 restraints, was achieved. The largest residual peak and hole were 0.338 and −0.299 e/Å3, respectively. Crystallographic data, atomic
coordinates, and equivalent isotropic displacement parameters, bond lengths and angles, anisotropic displacement parameters, hydrogen coordinates and isotropic displacement parameters, torsion angles, and hydrogen bonding information are given in the Supporting Information.
2c. Solid-State17O NMR and Spectral Analysis.All17O NMR
spectra reported herein were obtained at 21.1 T on a Bruker Avance II 900 spectrometer (National Ultrahigh-field NMR Facility for Solids, Ottawa, Canada), corresponding to an 17O resonance frequency of
122.0 MHz. Static and MAS spectra were acquired using a spin−echo pulse sequence (π/2 − τ − π/2 − acquire), with a central transition-selective π/2 pulse length of 2 μs and the delay τ set to 50 μs. Between 64 and 2048 scans were acquired for each spectrum depending on the observed signal-to-noise ratio, and the recycle delay varied between 1 and 20 s depending on the sample and temperature. The MAS experiments were conducted using Bruker double channel H/X MAS probes (4.0 mm for T, 2.5 mm for HT and ABSA). Powder samples were packed in ZrO2rotors and spun at 20 kHz (12.5 kHz for T)
without1H decoupling. The actual sample temperature was calibrated
prior to the experiments using the 207Pb NMR signal from solid
Pb(NO3)2 under the same MAS conditions.72 For the
variable-temperature17O NMR experiments on stationary samples, a 7 mm
home-built double channel H/X solenoid probe was used with a low-E dual resonator design.73Continuous-wave1H decoupling of (γ/2π)B
1
≈30 kHz was applied during acquisition. Samples were packed in 7 mm o.d. Teflon tubes (Norell) to minimize the unwanted 17O
background signal. The sample temperature was controlled to within or better than 1 °C accuracy using a Bruker BVT 3000 unit. The actual sample temperature was calibrated prior to the experiments using the
1H NMR signal from methanol.74
Samples were equilibrated for at least 10 min at each target temperature before acquiring the spectra. Data processing was carried out using the NUTS software (Acorn NMR), while the Dmfit software75was used to fit the low-temperature
spectral line shapes in the absence of dynamic effects, allowing for the extraction of 17O quadrupole coupling and chemical shift tensor
parameters. Conventions for these parameters are as follows: The electric field gradient (EFG) tensor is defined with the three principal components in the order of |V33|≥ |V22| ≥ |V11|. The quadrupolar
coupling constant is given by CQ = eQV33/h (where eQ is the
quadrupole moment of 17O and h is Planck’s constant) and the
asymmetry parameter is defined as ηQ = (V11 − V22)/V33. Nuclear
magnetic shielding tensors are defined such that the principal components are ordered as σ33 ≥ σ22≥ σ11. The relative orientation
of these tensors is described by three Euler angles α, β, and γ, which transform the principal axis system of the EFG tensor into coincidence with that of the shielding tensor via three positive rotations; α about
V33, followed by β around the new V22direction, and finally γ about
the new V33. Experimentally, chemical shifts are measured, rather than
magnetic shielding constants. We therefore report calculated shielding tensors in the form of chemical shift tensors with principal components defined as δ11≥ δ22≥ δ33.76
The EXPRESS software21 was used within MATLAB 7.10 to
simulate the effects of the SO3 group rotations on the 17O NMR
spectra. These dynamics were modeled as Markovian jumps between the three oxygen sites within the SO3group. The relative orientations
of the EFG and chemical shift tensors for each oxygen site were measured experimentally, while their absolute orientations in the crystal frame of reference were determined by DFT calculations as outlined in the next section. The spin-echo experiment was simulated with ideal π/2 pulses for the central transition and an echo delay of 50 μs to match the experimental value. Powder averaging was conducted over approximately 10 000 crystallite orientations calculated using the ZCW method. Simulated spectra were processed within EXPRESS. For each compound,17O NMR spectra were simulated with various
jump rates, and their line shapes were matched to the experimental spectra by visual inspection.
2d. DFT Calculations. DFT calculations were carried out on a neutron diffraction structure for T,69 a previously reported X-ray diffraction structure for HT,70 and a newly determined X-ray diffraction structure for ABSA (see section 2b). Geometry optimization of the hydrogen atom positions was performed for the crystal structures of HT and ABSA, but not for that of T due to the accuracy of their positions in the neutron diffraction structure.77
Calculations were performed using the CASTEP software78 and the
Materials Studio 4.3 program (Accelrys) running on a Linux server with eight processing cores and 32 GB of RAM. Perdew, Burke, and Ernzerhof (PBE) functionals were used with a plane wave basis set cutoff of 610 eV and a 3 × 1 × 2 Monkhorst-Pack k-space grid. Electric field gradient and shielding tensors were then calculated for all nuclei. Calculated shielding values (σcalc) for17O were converted to chemical
shift values (δcalc) using the expression δcalc= σref− σcalc, with the value
for σref previously reported as 265 ppm.49 Calculated values for the
Euler angles were extracted from the CASTEP output files using the EFGShield software.79
To calculate the rotational energy barriers for the sulfonate groups, the SO3groups in the crystal structures were rotated in increments of
5° about the S−C bond and the energy of the unit cell was calculated each time using the CASTEP code. Each increment took approximately 5−10 min of CPU time. The energy barriers for individual sulfonate groups were then obtained by dividing the energy difference for the unit cell by the number of SO3groups within it. To
ensure that these energies were not adversely affected by the synchronous rotation of all sulfonate groups, tests were also run with the unit cell set to P1 symmetry and only a single sulfonate group rotated and also with a cluster of eight molecules inside a 20 × 20 × 20 Å3unit cell, again with only a single sulfonate group at the center of
the cluster rotated. These calculations took considerably longer to run (several hours of CPU time) but gave the same result for the energy difference, to within 0.1 eV.
3. RESULTS AND DISCUSSION
3a. Experimental and Calculated 17O NMR tensor
Parameters.Figure 2 shows the solid-state17O NMR spectra
obtained under both static and MAS conditions at 21.1 T from T, HT, and ABSA. These spectra represent slow motion regime line shapes where the effects of the sulfonate group dynamics are absent. In the case of T, the slow motion regime spectra were obtained at room temperature, 290 K, whereas the spectral line shapes of HT and ABSA were observed to change significantly upon cooling, and required temperatures of 216 and 241 K, respectively, to observe the slow motion regime patterns. These spectra were simulated to extract experimental values for the various parameters describing the 17O
quadrupolar coupling and chemical shift tensors. The high signal-to-noise ratios of the spectra combined with sharply defined discontinuities, particularly in the MAS line shapes, allowed the individual oxygen sites to be resolved without the need for advanced methods such as MQMAS or DOR. The MAS spectra were used to obtain accurate values for δiso, CQ,
and ηQ, and these parameters were then fixed in the simulations
of the static spectra. Such spectral analyses allowed not only the tensor components to be measured but also the three Euler angles α, β, and γ, which describe the relative orientation between the chemical shift and EFG tensors.
All the experimental 17O NMR tensor parameters are
summarized in Table 1, alongside the calculated values.
Because the observed and computed values for both CQ and
ηQare all very similar among different oxygen sites in the three compounds, no further analysis was performed for them. In contrast, as seen from Table 1, the17O chemical shifts exhibit
some variations among the different oxygen sites. Since the17O
chemical shift calculations were performed using the gauge including projector-augmented wave (GIPAW)80,81 method as implemented in the CASTEP program, the entire crystal lattice was considered. Assignment of the experimental parameters to specific crystal sites for T and ABSA was based primarily on the
17O chemical shifts. For HT, because two of the oxygen sites
are crystallographically equivalent, the assignment was determined by the 2:1 intensity ratio of the17O NMR signals.
As seen from Figure 3, the overall agreement between the experimental and calculated 17O chemical shift tensor
components is satisfactory given the similarity of the oxygen environments in all three compounds. This type of accuracy is consistent with those reported previously for17O chemical shift
tensors in other systems.48,82−84 The experimental and computed Euler angles also show a reasonably good correlation. The tensor orientations in the molecular frame were consistent with those reported for T in our previous study58for all oxygen sites, with V33and δ33both aligned approximately parallel to the
S−O bond. It is interesting to note that, as seen in Figure 3, δ33
exhibits the largest variation among the three tensor components. This is quite different from the previous observations for carbonyl compounds in which δ11 typically is
most sensitive to chemical bonding including hydrogen bonding.23 However, this apparent discrepancy becomes understandable when we compare the 17O chemical shift
tensor orientations in the molecular frame of reference between the two functional groups. In carbonyl compounds, δ11 is
typically along the CO bond, whereas in the present case, δ33
is along the S−O bond. It is well-known that a particular chemical shift tensor component is most sensitive to any bonding change occurring within a plane perpendicular to the direction of that tensor component. In organic carbonyl compounds and the three sulfonates studied here, the relevant O···H−N hydrogen bonds may be considered to lie in an approximate plane perpendicular to the CO and S−O bond, respectively. As a result, it is expected that the 17O chemical
shift tensor component along either CO or S−O bond direction that should be most sensitive to the O···H−N hydrogen bonding. This is indeed the case.
3b. 17O NMR Line Shapes under Sulfonate Rotation.
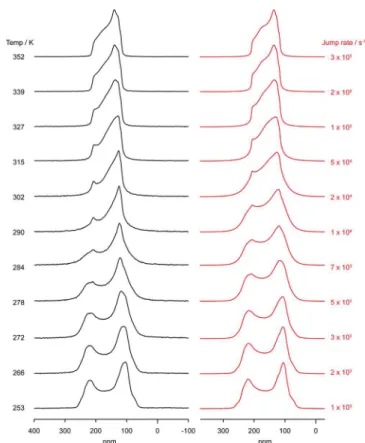
Figure 4 shows the17O NMR powder patterns obtained from
ABSA at 21.1 T over a temperature range of approximately 100 K. Clearly, the17O NMR line shape varies significantly over this
temperature range, and this is due to the rotational dynamics of the sulfonate groups about the C−S bond in the crystal lattice. The reorientation of the 17O NMR interaction tensors on a
time scale similar to that of the experiment causes anisotropic relaxation across the powder pattern, thereby giving rise to unique line shapes that can be modeled to extract the jump rates and the geometry of the reorientation. It is worth noting that, for half-integer quadrupolar nuclei such as17O, the central
transition powder pattern in the limit of fast motion does not correspond to a typical second-order quadrupolar powder pattern and therefore cannot be simulated without accounting for the dynamics. This is because the second- and fourth-rank tensors present in the second-order quadrupolar interaction are weighted differently under the fast motion limit.7,18,19This is in contrast to the situation for integer spin nuclei, where a
Figure 2.Experimental17O NMR spectra obtained from T at 290 K
(a, d), HT at 216 K (b, e), and ABSA at 241 K (c, f) at 21.1 T are shown in black. Spectra a, b, and c were obtained under MAS conditions, while d, e, and f were obtained from stationary samples. Red lines are simulated spectra while the simulations of powder patters from individual oxygen sites are shown below (blue for O1, purple for O2, and green for O3; see crystal structures for site designations). Spectra a and d have been previously reported58but are included here
for completeness.
Journal of the American Chemical Society Article
dx.doi.org/10.1021/ja306227p | J. Am. Chem. Soc. 2012, 134, 14609−14617
standard first-order quadrupolar line shape is obtained in the fast motion limit.
The rotation mechanism used in the simulated line shapes was specified as a straightforward exchange between the three oxygen sites, that is, a 3-fold jump process of approximately C3
symmetry, with the relative interaction tensor orientations Table 1. Experimental and Computed (CASTEP)17O NMR Tensor Parameters for T, HT, and ABSAa
δiso, ppm δ11, ppm δ22, ppm δ33, ppm CQ, MHzb ηQ α, deg β, deg γ, deg
T expt O1 170.4 203 192 115 −6.70 0.14 270 −20 270 O2 179.0 213 199 125 −6.65 0.16 180 0 0 O3 187.4 217 205 139 −6.80 0.05 0 −5 0 CASTEP O1 178.2 229 192 114 −7.17 0.08 266 −15 250 O2 187.3 224 203 136 −6.97 0.16 123 12 12 O3 190.8 216 205 151 −6.76 0.04 10 −11 17 HT expt O1 174.4 212 182 129 −7.15 0.08 0 10 0 O2/O2′ 172.2 215 189 113 −6.75 0.15 298 14 159 CASTEP O1 171.8 204 186 125 −6.89 0.13 0 8 0 O2/O2′ 179.2 224 197 116 −7.23 0.23 283 14 117 ABSA expt O1 172.8 210 183 126 −6.40 0.10 123 4 320 O2 177.0 220 183 127 −7.25 0.09 309 12 212 O3 173.6 205 192 124 −7.00 0.12 292 17 160 CASTEP O1 178.7 229 184 122 −6.96 0.15 118 12 294 O2 182.5 212 195 141 −6.86 0.10 328 11 190 O3 179.6 219 188 131 −6.93 0.09 260 18 106
aExperimental uncertainties for these parameters varied in each case, and for clarity the individual values are not shown, but typical values are δ
iso=
±0.2 ppm, δii(i = 1,2,3) = ±10 ppm, CQ= ±0.03 MHz, ηQ= ±0.04, α = ±10°, β = ±4°, and γ = ±10°.bThe values for T have been previously
reported58but are included here for completeness. The sign of experimental C
Qvalues was assumed to be the same as the computed ones.
Figure 3. A comparison of experimental and calculated 17O NMR
parameters for all three compounds: (a) chemical shift tensor components and (b) the Euler angles. Red lines are linear fits. Error bars on data points are omitted for clarity. In panel b, an expanded region for β angles is shown as an inset.
Figure 4.Experimental (left) and simulated (right) variable-temper-ature17O NMR spectra obtained from a static powder sample of ABSA
having been ascertained in the previous section. As can be seen in Figure 4, the evolution of the simulated line shapes as the jump rate is increased matches the changes occurring in the experimental spectra, thereby allowing the jump rate at each temperature to be determined. The match is extremely close in both the slow and fast limits. In the intermediate regime, the line shapes show good agreement for the shapes and positions of the sharper features, but there are discrepancies in the relative intensities of the high and low frequency regions (most visible in the ABSA spectrum obtained at 290 K, see Figure 4). Two other dynamic models were therefore tested for all three samples, namely, C6rotation with random jumps among all six
sites and C6 rotation with sequential jumps between
neighboring sites (approximating free rotation). Tensor parameters used for the three new oxygen positions in these models were calculated using DFT from crystal structures in which the sulfonate groups were rotated by 60° about the S−C bond. Both of these models resulted in worse fits to experiment than the straightforward three-site exchange, confirming the latter mechanism. The variable-temperature17O NMR spectra
and simulations for samples T and HT are given in the Supporting Information.
All measured jump rates for the three samples are shown in Figure 5 in the form of an Arrhenius plot. The slope of the
linear fit in such a plot is equal to −Ea/R, where Ea is the
activation energy for the dynamic process and R is the gas constant (8.314 J K−1 mol−1). Only four data points were
obtained for T due to the limited temperature range of the NMR probe used and the relatively high temperature at which the effects of the dynamics begin to affect the 17O NMR
spectrum. Nonetheless, a linear fit was made for all three compounds, allowing the extraction of the activation energies as
Ea= 48 ± 7, 42 ± 3, and 45 ± 1 kJ mol−1for T, HT, and ABSA,
respectively. To our knowledge, this is the first time that this kind of information has been obtained for sulfonate functional groups in the solid state.
3c. Correlation with Hydrogen Bonding Interactions. In this section, we examine the relationship between the measured activation energies for sulfonate group rotation and
the hydrogen bonding environment around each of the sulfonate groups in the crystal structure. Figure 6 shows the
crystal packing in each of the unit cells. It is interesting to note that T and ABSA exhibit very similar packing. In each compound, all three oxygen atoms of the sulfonate group are involved in hydrogen bonding to the surrounding NH3+groups.
Interestingly, T also exhibits a unique intramolecular hydrogen bond between the SO3− and NH3+ groups. The detailed
hydrogen bond geometries found in the three compounds are summarized in Table 2. Because the sulfonate group rotation about the C−S bond is known to be essentially barrier-free in isolated or gas-phase molecules,85 the measured activation energies for SO3 rotation in the solid state must be due to
intermolecular interactions present in the crystal lattice. In the three compounds studied here, because the SO3 rotation
involves the breaking of all O···H−N hydrogen bonds, it is reasonable to assume that the activation energy should be correlated to the total hydrogen bonding energy. Furthermore, if we assume that the O···H−N hydrogen bonding interaction is the predominant factor, we can actually quantify the total hydrogen bond energy for each sulfonate group by using the measured activation energy value. In this study, we use the following simple empirical equation to describe the hydrogen bond energy, EHB(in kJ mol−1), as a function of the hydrogen
bond length, rH···O (in pm):86
= − ···
EHB A0(1/rH O)3.8 (1)
where A0is the only adjustable parameter for a particular type
of hydrogen bond. Using the experimental activation energies, we obtained the best-fit value for A0 = 0.55 × 10¹⁰ kJ mol−1
pm3.8 and the associated hydrogen bond energies as listed in Figure 5. Arrhenius plots of the sulfonate group jump rates for T
(green triangles), HT (red circles), and ABSA (black squares). Linear fits are also shown for each sample. Error bars on data points are omitted for clarity.
Figure 6.Crystal packing in (a) T (space group P21/c, a = 5.279, b =
11.645, c = 7.931 Å, β = 94.00°, Z = 4), (b) HT (space group Pmn21, a
= 7.059, b = 5.492, c = 7.428 Å, Z = 2), and (c) ABSA (space group
P21/c, a = 5.2815, b = 14.9489, c = 8.7463 Å, β = 91.692°, Z = 4).
Atom color codes are: hydrogen (white), carbon (gray), nitrogen (blue), sulfur (yellow), and oxygen (red).
Journal of the American Chemical Society Article
dx.doi.org/10.1021/ja306227p | J. Am. Chem. Soc. 2012, 134, 14609−14617
Table 2. It is satisfying to see that this simple analysis yields quite reasonable hydrogen bond energies.
Although the observed 17O δ
isovalues for the three sulfonic
acids span a relatively small range (∼10 ppm), close inspection reveals a clear relationship between this NMR parameter and the hydrogen bond length, as shown in Figure 7. In general, δiso
decreases as the hydrogen bond length of the oxygen atom under study decreases (or equivalently as the hydrogen bond strength increases). This trend is similar to that found in carbonyl compounds reported previously.87−91It is also seen in Figure 7 that the data point for O3of T lies clearly outside the
group. This is attributed to the fact that this particular oxygen
atom is also involved in an intramolecular hydrogen bond, as mentioned earlier. A similar hydrogen bonding effect was previously known for1H chemical shifts.92,93
3d. Correlation with Calculated Rotational Barriers.As discussed in the previous section, the activation energies for the sulfonate group rotations increase in the order of HT < ABSA < T, which reflects the total hydrogen bond energy for each sulfonate group. Certainly this order is intuitively consistent with the temperatures at which the slow motion regime spectra were obtained (216, 241, and 290 K, respectively), but it is also of interest to see whether DFT calculations can reproduce this trend if the rotational energy barriers for the sulfonate groups are calculated. Calculated energy profiles for the rotation of the sulfonate groups around the C−S bond are shown for all three samples in Figure 8. The profile for HT is symmetric due to the
C−S bond lying on a mirror plane in the crystal structure, while the profiles for T and ABSA are asymmetric, reflecting the lack of symmetry in their hydrogen bonding environments as well as the slight differences in S−O bond lengths and C−S−O bond angles. From this plot, the energy barriers can be ascertained as 132, 87, and 113 kJ mol−1for T, HT, and ABSA, respectively
(representing an average of the two barrier heights for T and ABSA). This puts the samples in an order that matches that of the experimental activation energies, that is, HT < ABSA < T. The widths of the energy barriers also reflect this sequence. It is clear that the calculated energy barriers are overestimated compared with the experimental Ea values. We attribute this
overestimation primarily to thermal factors that are not taken into account by the DFT calculations, which assume a temperature of 0 K. For example, thermal vibrations experienced by the molecules in the crystal lattice and fast rotation of NH3+ groups94 would allow a certain amount of
structural relaxation to occur during the SO3−rotation process.
We attempted to account for this by rerunning the calculations to include the geometry optimization of hydrogen atoms in close proximity to the sulfonate groups such as those from the NH3+group, or all hydrogen atoms. These calculations reduced
the energy barriers by a few tens of kilojoules per mole, while optimization of all the atomic positions except the sulfonate Table 2. Experimental Hydrogen Bond Geometriesa
and Computed Hydrogen Bond Interaction Energies for T, HT, and ABSA
rO···H, pm rO···N, pm ∠O···H−N, deg −EHB, (kJ mol−1)
T O1 178.4 278.9 165.4 17.0 O2 243.0 293.9 110.9 5.3 O3 196.5 289.0 152.7 11.8 226.8b 293.0 120.5 6.8 223.5 301.7 131.3 7.2 total = 48.1 HT O1 222.0 289.2 121.0 7.4 O2 182.1 283.7 162.1 15.7 O2′ 182.1 283.7 162.1 15.7 total = 38.8 ABSA O1 179.3 281.6 162.9 16.7 200.7 301.5 159.4 10.9 O2 254.6 300.4 110.7 4.4 O3 189.3 285.0 150.9 13.6 total = 45.6 aFor taurine, a neutron diffraction crystal structure69 was used. For
HT and ABSA, the hydrogen atoms in the original X-ray crystal structures (ref 70 and this work) were optimized with CASTEP.
bIntramolecular hydrogen bond.
Figure 7.Dependence of δiso(17O) found in T, HT, and ABSA on the
hydrogen bond length. For oxygen atoms involved in multiple hydrogen bonds, the shortest hydrogen bond length is used in the plot. A linear fit (red line) excluding the data point (■) from O3 of T is shown as a visual aid.
Figure 8.Calculated energy changes arising from the rotation of a sulfonate group around the C−S bond in T (green triangles), HT (red circles), and ABSA (black squares).
group reduced the energy barriers to almost zero. Small expansions of the unit cell size, which would occur upon heating, were also found to reduce the barrier sizes. While thermal effects such as these could potentially be investigated using molecular dynamics simulations, they are not trivial to account for in the DFT methods we have used here.95,96 We therefore report only the values calculated with the simple rotation of the sulfonate group, a reproducible and consistent approach that, despite overestimating the barriers, nevertheless provides numbers that match qualitatively with our exper-imental results.
4. SUMMARY
Solid-state17O NMR experiments carried out at 21.1 T over a
range of temperatures have been used to study the rotation of sulfonate (SO3−) groups in three crystalline amino sulfonic
acids: taurine, homotaurine, and ABSA. A complete set of17O
NMR tensor parameters are reported for all three compounds and have been assigned to the correct oxygen sites in the crystal structures with the aid of DFT calculations. By modeling the
17O powder line shapes over a range of temperatures we have
not only confirmed that the SO3− groups undergo a 3-fold
rotational jump mechanism but also extracted the jump rates (102to 105s−1) and activation energies for this process (E
a=
48 ± 7, 42 ± 3, and 45 ± 1 kJ mol−1for T, HT, and ABSA
respectively). Experimental rotational energy barriers were used to quantify the total hydrogen bond energies for each SO3−
group. We also found that DFT calculations of rotational energy barriers, while giving overestimated values, nevertheless reproduced the correct order for the three compounds (HT < ABSA < T). This work demonstrates the potential of solid-state
17O NMR, particularly in combination with modern DFT
methods, for quantifying dynamic processes occurring in organic solids. The combination of isotopic labeling and high magnetic field strength allowed 17O NMR spectra of high
quality to be obtained in a relatively short time frame. The application of this approach to study dynamics occurring in large, selectively 17O-labeled biomolecules is therefore very
feasible.
■
ASSOCIATED CONTENT*
S Supporting InformationExperimental and simulated variable-temperature 17O NMR
spectra for T and HT, a figure showing the sensitivity of the line shape to the Euler angle β, a crystallographic information file (CIF) for the crystal structure of ABSA, tables containing crystallographic data, atomic coordinates, and equivalent isotropic displacement parameters, bond lengths and angles, anisotropic displacement parameters, hydrogen coordinates and isotropic displacement parameters, torsion angles, and hydro-gen bonding information, and CIF files for crystal structures of HT and ABSA in which all hydrogen atom positions were optimized with CASTEP. This material is available free of charge via the Internet at http://pubs.acs.org.
■
AUTHOR INFORMATIONCorresponding Author
luke.odell@deakin.edu.au; gang.wu@chem.queensu.ca
Present Address
⊥
Institute for Frontier Materials, Deakin University, Waurn Ponds Campus, Geelong, Victoria 3220, Australia
Notes
The authors declare no competing financial interest.
■
ACKNOWLEDGMENTSThis work was supported by the Natural Sciences and Engineering Research Council (NSERC) of Canada. We thank Prof. Robert Vold for providing the EXPRESS software and for advice on its use. Dr. Christopher Ratcliffe and Dr. Dennis Klug (NRC Canada) are also acknowledged for helpful discussions. Access to the 900 MHz NMR spectrometer was provided by the National Ultrahigh Field NMR Facility for Solids (Ottawa, Canada), a national research facility funded by the Canada Foundation for Innovation, the Ontario Innovation Trust, Recherche Québec, the National Research Council Canada, and Bruker BioSpin and managed by the University of Ottawa (www.nmr900.ca). NSERC is acknowledged for a Major Resources Support grant.
■
REFERENCES(1) Spiess, H. W. Dynamic NMR spectroscopy. In NMR: Basic
Principles and Progress; Diehl, P., Fluck, E., Kosfeld, R., Eds.;
Springer-Verlag: Berlin, 1978.
(2) Duer, M. J. Introduction to Solid State NMR Spectroscopy; Blackwell: Oxford, U.K., 2002; Chapter 6.
(3) Tycko, R. Nuclear Magnetic Resonance Probes of Molecular
Dynamics; Kluwer: Dordrecht, the Netherlands, 1994; Chapter 1.
(4) Ratcliffe, C. I. Rotational and Translational Dynamics in Solids. In Encyclopedia of Magnetic Resonance; Harris, R. K., Wasylishen, R. E., Eds.; John Wiley & Sons, Ltd.: Chichester, U.K., 2009.
(5) Larsen, F. H. Annu. Rep. NMR Spectrosc. 2010, 71, 103. (6) Müller, K. Phys. Chem. Chem. Phys. 2002, 4, 5515.
(7) O’Dell, L. A.; Ratcliffe, C. I. Quadrupolar NMR to Investigate Dynamics in Solid Materials. In Encyclopedia of Magnetic Resonance; Harris, R. K., Wasylishen, R. E., Eds.; John Wiley & Sons, Ltd.: Chichester, U.K., 2011.
(8) Batchelder, L. S. Deuterium NMR in Solids. In Encyclopedia of
Magnetic Resonance; Harris, R. K., Wasylishen, R. E., Eds.; John Wiley
& Sons, Ltd.: Chichester, U.K., 2007.
(9) Meirovitch, E.; Freed, J. H. Chem. Phys. Lett. 1979, 64, 311. (10) Torchia, D. A. Annu. Rev. Biophys. Bioeng. 1984, 13, 125. (11) Beshah, K.; Olejniczak, E. T.; Griffin, R. G. J. Chem. Phys. 1987,
86, 4730.
(12) Kristensen, J. H.; Bildsøe, H.; Jakobsen, H. J.; Nielsen, N. C. J.
Magn. Reson. 1992, 100, 437.
(13) Larsen, F. H.; Jakobsen, H. J.; Ellis, P. D.; Nielsen., N. C. Chem.
Phys. Lett. 1998, 292, 467.
(14) Vugmeyster, L.; Ostrovsky, D.; Ford, J. J.; Litpon, A. S. J. Am.
Chem. Soc. 2010, 132, 4038.
(15) Vukotic, V. N.; Harris, K. J.; Zhu, K.; Schurko, R. W.; Loeb, S. J.
Nat. Chem. 2012, 4, 456.
(16) O’Dell, L. A.; Ratcliffe, C. I. Chem. Commun. 2010, 46, 6774. (17) Witschas, M.; Eckert, H.; Freiheit, H.; Putnis, A.; Korus, G.; Jansen, M. J. Phys. Chem. A 2001, 105, 6808.
(18) Kristensen, J. H.; Farnan, I. J. Chem. Phys. 2001, 114, 9608. (19) Schurko, R. W.; Wi, S.; Frydman, L. J. Phys. Chem. A 2002, 106, 51.
(20) Larsen, F. H. J. Magn. Reson. 2004, 171, 293.
(21) Vold, R. L.; Hoatson, G. L. J. Magn. Reson. 2009, 198, 57. (22) Ashbrook, S. E.; Smith, M. E. Chem. Soc. Rev. 2006, 35, 718. (23) Wu, G. Prog. Nucl. Magn. Reson. Spectrosc. 2008, 52, 118. (24) Llor, A.; Virlet, J. Chem. Phys. Lett. 1988, 152, 248.
(25) Mueller, K. T.; Sun, B. Q.; Chingas, G. C.; Zwanziger, J. W.; Terao, T.; Pines, A. J. Magn. Reson. 1990, 86, 470.
(26) Samoson, A.; Lippmaa, E.; Pines, A. Mol. Phys. 1988, 65, 1013. (27) Chmelka, B. F.; Mueller, K. T.; Pines, A.; Stebbins, J.; Wu, Y.; Zwanziger, J. W. Nature 1989, 339, 42.
Journal of the American Chemical Society Article
dx.doi.org/10.1021/ja306227p | J. Am. Chem. Soc. 2012, 134, 14609−14617
(28) Wu, Y.; Sun, B. Q.; Pines, A.; Samoson, A.; Lippmaa, E. J. Magn.
Reson. 1990, 89, 297.
(29) Frydman, L.; Harwood, J. S. J. Am. Chem. Soc. 1995, 117, 5367. (30) Medek, A.; Harwood, J. S.; Frydman, L. J. Am. Chem. Soc. 1995,
117, 12779.
(31) Gan, Z. J. Am. Chem. Soc. 2000, 122, 3242.
(32) Mueller, K. T.; Wu, Y.; Chmelka, B. F.; Stebbins, J.; Pines, A. J.
Am. Chem. Soc. 1991, 113, 32.
(33) Grandinetti, P. J.; Baltisberger, J. H.; Farnan, I.; Stebbins, J. F.; Werner, U.; Pines, A. J. Phys. Chem. 1995, 99, 12341.
(34) Gann, S. L.; Baltisberger, J. H.; Wooten, E. W.; Zimmermann, H.; Pines, A. Bull. Magn. Reson. 1994, 16, 68.
(35) Wu, G.; Rovnyak, D.; Huang, P. C.; Griffin, R. G. Chem. Phys.
Lett. 1997, 277, 79.
(36) Engelhardt, G.; Kentgens, A. P. M.; Koller, H.; Samoson, A.
Solid State Nucl. Magn. Reson. 1999, 15, 171.
(37) Dong, S.; Wu, G. J. Am. Chem. Soc. 2001, 123, 9119. (38) Ashbrook, S. E.; Antonijevic, S.; Berry, A. J.; Wimperis, S. Chem.
Phys. Lett. 2002, 364, 634.
(39) Ashbrook, S. E.; Berry, A. J.; Hibberson, W. O.; Steuernagel, S.; Wimperis, S. J. Am. Chem. Soc. 2003, 125, 11824.
(40) Ashbrook, S. E.; Wimperis, S. Prog. Nucl. Magn. Reson. Spectrosc. 2004, 45, 53.
(41) Lemaître, V.; Pike, K. J.; Watts, A.; Anupõld, T.; Samoson, A.; Smith, M. E.; Dupree, R. Chem. Phys. Lett. 2003, 371, 91.
(42) Pike, K. J.; Lemaître, V.; Kukol, A.; Anupõld, T.; Samoson, A.; Howes, A. P.; Watts, A.; Smith, M. E.; Dupree, R. J. Phys. Chem. B 2004, 108, 9256.
(43) Howes, A. P.; Anupõld, T.; Lemaître, V.; Kukol, A.; Watts, A.; Samoson, A.; Smith, M. E.; Dupree, R. Chem. Phys. Lett. 2006, 421, 42. (44) Wong, A.; Pike, K. J.; Jenkins, R.; Clarkson, G. J.; Anupõld, T.; Howes, A. P.; Crout, D. H. G.; Samoson, A.; Dupree, R.; Smith, M. E.
J. Phys. Chem. A 2006, 110, 1824.
(45) Wong, A.; Howes, A. P.; Pike, K. J.; Lemaître, V.; Watts, A.; Anupõld, T.; Past, J.; Samoson, A.; Dupree, R.; Smith, M. E. J. Am.
Chem. Soc. 2006, 128, 7744.
(46) Prasad, S.; Clark, T. M.; Sharma, R.; Kwak, H. T.; Grandinetti, P. J.; Zimmermann, H. Solid State Nucl. Magn. Reson. 2006, 29, 119.
(47) Hung, I.; Wong, A.; Howes, A. P.; Anupõld, T.; Past, J.; Samoson, A.; Mo, X.; Wu, G.; Smith, M. E.; Brown, S. P.; Dupree, R. J.
Magn. Reson. 2007, 188, 246.
(48) Wong, A.; Howes, A. P.; Yates, J. R.; Watts, A.; Anupõld, T.; Past, J.; Samoson, A.; Dupree, R.; Smith, M. E. Phys. Chem. Chem. Phys. 2011, 13, 12213.
(49) Wong, A.; Smith, M. E.; Terskikh, V.; Wu, G. Can. J. Chem. 2011, 89, 1087.
(50) Zhu, J.; Ye, E.; Terskikh, V.; Wu, G. Angew. Chem., Int. Ed. 2010,
49, 8399.
(51) Kim, N.; Grey, C. P. Science 2002, 297, 1317.
(52) Hampson, M. R.; Hodgkinson, P.; Evans, J. S. O.; Harris, R. K.; King, I. J.; Allen, S.; Fayon, F. Chem. Commun. 2004, 392.
(53) Kim, N.; Vannier, R.-N.; Grey, C. P. Chem. Mater. 2005, 17, 1952.
(54) Viefhaus, T.; Bolse, T.; Müller, K. Solid State Ionics 2006, 177, 3063.
(55) Soleilhavoup, A.; Hampson, M. R.; Clark, S. J.; Evans, J. S. O.; Hodgkinson, P. Magn. Reson. Chem. 2007, 45, 144.
(56) Holmes, L.; Peng, L.; Heinmaa, I.; O’Dell, L. A.; Smith, M. E.; Vannier, R.-N.; Grey, C. P. Chem. Mater. 2008, 20, 3638.
(57) Ba, Y.; Ripmeester, J. A.; Ratcliffe, C. I. Can. J. Chem. 2011, 89, 1055.
(58) O’Dell, L. A.; Ratcliffe, C. I.; Kong, X.; Wu, G. J. Phys. Chem. A 2012, 116, 1008.
(59) Le-Corronc, H.; Rigo, J.-M.; Branchereau, P.; Legendre, P. Mol.
Neurobiol. 2011, 44, 28.
(60) Oja, S. S.; Saransaari, P. Proc. Western Pharmacol. Soc. 2007, 50, 8.
(61) Albrecht, J.; Schousboe, A. Neurochem. Res. 2005, 30, 1615.
(62) Santa-Maria, I.; Hernandez, F.; Moreno, F. J.; Avila, J. Neurosci.
Lett. 2007, 429, 91.
(63) Martineau, E.; de Guzman, J. M.; Rodionova, L.; Kong, X.; Mayer, P. M.; Aman, A. M. J. Am. Soc. Mass Spectrom. 2010, 21, 1506. (64) Gervais, F.; Paquette, J.; Morissette, C.; Krzywkowski, P.; Yu, M.; Azzi, M.; Lacombe, D.; Kong, X.; Aman, A.; Laurin, J.; Szarek, W. A.; Tremblay, P. Neurobiol. Aging 2007, 28, 537.
(65) Aisen, P. S.; Gauthier, S.; Ferris, S. H.; Saumier, D.; Haine, D.; Garceau, D.; Duong, A.; Suhy, J.; Oh, J.; Lau, W. C.; Sampalis, J. Arch.
Med. Sci. 2011, 7, 102.
(66) Gauthier, S.; Aisen, P. S.; Ferris, S. H.; Saumier, D.; Duong, A.; Haine, D.; Garceau, D.; Suhy, J.; Oh, J.; Lau, W.; Sampalis, J. J. Nutr.
Health Aging 2009, 13, 550.
(67) Saumier, D.; Duong, Anh; Haine, D.; Garceau, D.; Sampalis, J. J.
Nutr. Health Aging 2009, 13, 808.
(68) Aisen, P. S.; Gauthier, S.; Vellas, B.; Briand, R.; Saumier, D.; Laurin, J.; Garceau, D. Curr. Alzheimer Res. 2007, 4, 473.
(69) Briant, C. E.; Jones, D. W. J. Chem. Crystallogr. 1997, 27, 481. (70) Ueoka, S.; Fujiwara, T.; Tomita, K. Bull. Chem. Soc. Jpn. 1972,
45, 3634.
(71) Cromer, D. T.; Waber, J. T. International Tables for X-ray
Crystallography; Kynoch Press: Birmingham, U.K., 1974; Vol. 4, Table
2.2 A.
(72) Bielecki, A.; Burum, D. P. J. Magn. Reson. A 1995, 116, 215. (73) Gor’kov, P. L.; Chekmenev, E. Y.; Li, C.; Cotten, M.; Buffy, J. J.; Traaseth, N. J.; Veglia, G.; Brey, W. W. J. Magn. Reson. 2007, 185, 77.
(74) Van Geet, A. L. Anal. Chem. 1970, 42, 679.
(75) Massiot, D.; Fayon, F.; Capron, M.; King, I.; Le Calvé, S.; Alonso, B.; Durand, J. O.; Bujoli, B.; Gan, Z.; Hoatson, G. Magn. Reson.
Chem. 2002, 40, 70.
(76) Mason, J. Solid State Nucl. Magn. Reson. 1993, 2, 285. (77) O’Dell, L. A.; Ratcliffe, C. I. J. Phys. Chem. A 2011, 115, 747. (78) Clark, S. J.; Segall, M. D.; Pickard, C. J.; Hasnip, P. J.; Probert, M. J.; Refson, K.; Payne, M. C. Z. Kristallogr. 2005, 220, 567.
(79) Adiga, S.; Aebi, D.; Bryce, D. L. Can. J. Chem. 2007, 85, 496. (80) Pickard, C. J.; Mauri, F. Phys. Rev. B 2001, 63, No. 245101. (81) Yates, J. R.; Pickard, C. J.; Mauri, F. Phys. Rev. B 2007, 76, No. 024401.
(82) Yates, J. R.; Pickard, C. J.; Payne, M. C.; Dupree, R.; Profeta, M.; Mauri, F. J. Phys. Chem. A 2004, 108, 6032.
(83) Griffin, J. M.; Wimperis, S.; Berry, A. J.; Pickard, C. J.; Ashbrook, S. E. J. Phys. Chem. C 2009, 113, 465.
(84) Zhu, J.; Geris, A. J.; Wu, G. Phys. Chem. Chem. Phys. 2009, 11, 6972.
(85) Rozas, I.; Weaver, D. F. J. Chem. Soc., Perkin Trans. 2 1996, 461. (86) Wendler, K.; Thar, J.; Zahn, S.; Kirchner, B. J. Phys. Chem. A 2010, 114, 9529.
(87) Wu, G.; Yamada, K.; Dong, S.; Grondey, H. J. Am. Chem. Soc. 2000, 122, 4215.
(88) Yamada, K.; Dong, S.; Wu, G. J. Am. Chem. Soc. 2000, 122, 11602.
(89) Dong, S.; Ida, R.; Wu, G. J. Phys. Chem. A 2000, 104, 11194. (90) Wu, G.; Dong, S.; Ida, R.; Reen, N. J. Am. Chem. Soc. 2002, 124, 1768.
(91) Kwan, I. C. M.; Mo, X.; Wu, G. J. Am. Chem. Soc. 2007, 129, 2398.
(92) Berglund, B.; Vaughan, R. W. J. Chem. Phys. 1980, 73, 2037. (93) Wu, G.; Freure, C. J.; Verdurand, E. J. Am. Chem. Soc. 1998, 120, 13187.
(94) Ratchliffe, C. I.; Dunell, B. A. J. Chem. Soc., Faraday Trans. 2 1981, 77, 2169.
(95) Dumez, J.-N.; Pickard, C. J. J. Chem. Phys. 2009, 130, 104701. (96) Charpentier, T. Solid State Nucl. Magn. Reson. 2011, 40, 1.