Yasushi Sakai
Submitted to the Program in Media Arts and Sciences in partial fulfillment of the requirements for the degree of Master of Science at the Massachusetts Institute of Technology
September 2017
@Massachusetts Institute of Technology 2017. All right reserved.
Signature redacted
A uthor... ...
Media Arts and Sciences August 11, 2017
Signature redacted
C ertified b y ... \-Kent Larson Principal Research Scientist Thesis Supervisor
Signature redacted
A ccepted by ...Pattie Maes Academic Head, Program in Media Arts and Sciences
MASSACHUSETTS INSTITUTE OF TECHNOLOGY
DEC 0 6
207
LIBRARIES
ARCHIVES
Yasushi Sakai
Submitted to the Program in Media Arts and Sciences
on August 11, 2017, in partial fulfillment of the requirements for the degree of Master of Science
Abstract
Present urban planning issues require to involve the public in the urban design process, and this slow and complicated process remains the primary domain of expert planners and consultants. Although there have been many attempts to leverage new mobile tools to engage the community. These tools support the three stages of planning 1. data collection 2. analysis and visualization
three solutions. Within these tools, some gather unstructured data that is hard to convert into physical interventions. Also, some applications are not designed to encourage debate and consensus building. This study will consider how a structured integrated tool will help the process of grassroots urban design. This thesis will focus on the development of a bottom-up, crowd-sourced, urban planning tool to improve the quality and safety of urban bike lanes. A mobile application will be developed to enable non-experts to actively participate in the process of real time data collection and feedback, mapping, selection of solutions, and the establishment of priorities. The system will be evaluated using both quantitative and qualitative methods, compared to present methods on bottom up interventions.
Thesis Supervisor: Kent Larson Title: Principal Research Scientist
Yasushi Sakai
The following people served as readers for this thesis:
Signature redacted
Thesis Reader...
Cesar A. Iidalgo Associate Professor of Media Arts and Sciences MIT Media Lab
Yasushi Sakai
The following person served as a reader for this thesis:
Signature redacted
Thesis Reader.. ...
Ethan Zuckerman Associate Professor of the Practice in Media Arts and Sciences
This thesis is all about designing collectively. Aligned to this, the achievement would never be possible without the collaborative support.
Kent always always had given so much freedom to pursue and encourage what I am passionate about. He is a mentor that always listens and provides the right guide not only for this thesis but to make my two-year academic residence a success in every angle. Thank you very much.
I started my relationship with my two readers by taking the classes they offered at Media Lab. Both classes "Technology and Social Change" and "Networks, Information, and the evolution of complex systems" were transformative. The amount of comments and advice Ethan gave me was enormous. The way you give warm and encouraging advice is something I want to inherit, and pay it forward to future researchers. Cesar's notion of cities as a network that holds computational resource is the kernel of this thesis.
Like said, the result comes from a collective effort, and the support from the Changing Places Group was invaluable. It was the work environment itself and no matter the topic inside or outside the lab, I've lean on you so much, and every time I needed help, it was supportive.
Dad and Mom, I feel great gratitude for how I was raised and being able to live such a happy life. I appreciate your support as I'm now a young parent my self.
Ray, at last! I can play!
Last and far most, I would like to thank my wife, Minori for the massive support and care, especially when I'm inconsiderate about myself. I admire your attitude of making sure the family is always in good health at the same time working hard to pursue your creative career. Thank you, and I love you.
I
Contents
i.
Introduction
17Overview 17 Contribution 21
2.
Background
23First traces of direct democracy and the scale of the city 23
Professionals and citizens 28
3. Extended Examples
35
Traditional methods for community engagement 35
4. Design and Implementation
43
Case Study: bikebump 43
Current method for changing bike-related infrastructure 45 Implementation Overview 48 Interface 51 Experiment Setting 57 Results 61 Evaluation 62
5. Discussion
65
A generalized tool for collective urban design 65 Incentives for bottom-Up design: Do We Care? 68
6. Conclusion
Future Work
73
73
Concluding Remarks
75
Appendix A. (Un)structured method of traditional community engagement
methods
77
Appendix B. Other Bad Areas
79
Appendix C. Questions asked after the fixed route trial and proposal section
After the bike ride
83
83
Before showing the synthetic side
After showing the synthetic side
83
83
Appendix E. Urban sound classification using Convolution Neural Networks
85
Appendix F. Bicycle ring detection and calibration
Sound Analyzer Application
G. Good Reports
87
87
91
Appendix H. Human Subject Consent Form & Questions
Appendix I. used framework and external APIs
Web API
95
101 101Map Frameworks
Others
102 102List of Figures
1 diagram: community hearings 18 2 externalized proposal 19
3 diagram: cityscope model 20
4 diagram: bikebump 21
5 how bike bump works 22 6 layers of environments 24 7 town meetings: moderator 25 8 town meetings: voting 25
9 representative democracy 26
1o number of bits per transaction 27
11 diagram: unstructured app 27
1 Urban planners started different methods of "hearings" to centralize input from the community. Appendix shows different traditional methods (repeated from page 18) 27
13 diagram: unstructured app 28
14 diagram: externalized plan 30 15 diagram: community engagement 31 16 diagram: integrated collective design 32
17 The RVSP cycle changes its position dynamically, relative to the previous state.[Halrprin, 19691 36
18 nigechizu 37
19 zoom in nigechizu interface 37 20 collective collaboration 37
21 LMN:web based distributed modelling 38 22 LMN:net work of models 38
23 LMN: modeling inside the browser 38 24 diagram: cityscope 40
25 TIP process 45 26 proposed process 46
28 interface: Record 51 29 interface: Map 53 30 interface: Popup 53 31 interface: Survey 54 32 interface: Survey 55 33 interface: Vote 56
34 interface: Improvement list 56
35 fixed route map 58 36 result map 6o
37 dangerous road 63
38 dangerous crossing at ames Street 63
39 Trend for North East Japan Tohoku Earthquake 70 40 method for continuous input 74
41 overlay of accidents and 'bad reports' 79
42 dangerous crossing in Massachusetts Avenue at Beacon
Street 80
43 'bad' reports close to the entrance of MIT 80
44 'bad' reports at the junction of BU bridge and memorial drive 81
45 sound analyzer application 88 46 reference bicycle ring bells 88
47 "good" reports on Massachusetts Avenue and Beacon Street 91
48 "good" reports in BU bridge 92
49 "good" reports in sidewalks of Memorial Drive 93 50 "good" reports in sidewalks of Vassar Street 93
List of Tables
I
Elements of the RSVP cycles. 352 structured method for community engagement 77 3 ding analyzer result 89
1.
Introduction
Overview
Technology and its products influence public norms, which then will affect tools; both have a mutual dependence. This thesis positions a novel tool for civic engagement within this loop of society and technology influencing each other. Mechanisms that work with the combination of technology and societies are sociotechnical systems.[Bruno, 1992] 1
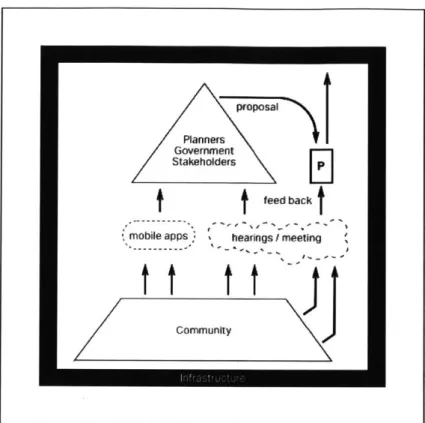
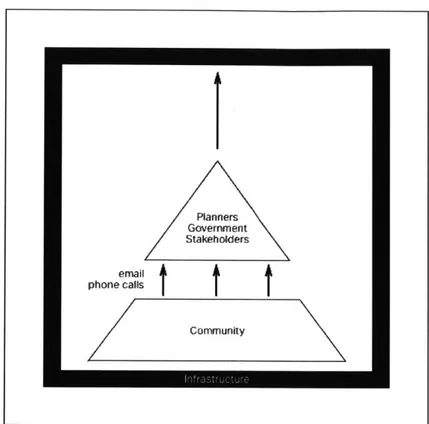
Traditionally the urban planning process accommodates public feedback through public meetings for voicing concerns from the community. Opening a public meeting is perhaps the most basic and dominant method of today's public engagement method used in urban planning. The planners, government, and stakeholders will interpret the input, and plan and execute interventions that consider citizens' feedback. We can think of this as a necessity to accommodate feedback once cities become too large for governance via a direct democratic approach. Urbanization occurs and as cities increase their density, public demand for transparent planning also rises, requiring the proposal to be externalized for scrutiny by the community. This high demand, especially for transportation planning, indicates the opportunity for new tools to better serve public needs.
In addition, new tools that leverage pervasive mobile communications have been developed to collect data in the form of reports and claims. These applications can be categorized as "structured"/"unstructured." The majority of these applications solicit unstructured feedback, making them useful for general comments, but limiting their utility for actionable information.
These tools are mainly used for analyzing the current situation, distinct
'Bruno puts the goal of socialtechnical study as:
"to follow the dynamic of reinscription
transforming a silent artifact into a polemical
portion includes the Planners,
t
Governors, and Stakeholders,and the rest. The diagram shows one typical procedure known as public meetings which is a
Planners communication tool to let the
Government top gain feedback from the
Stakeholders
bottom. The arrow pointing to the black border indicates
it changes the infrastructure,
meetings which is the border of the built
environment and the natural environment.
Community
from integrating (synthesis) it to one executable plan. Designers and architects who have been generating actionable interventions, have been continuously arguing that the process of analysis and synthesis should be as close as possible in order to be designed properly. The absence of the synthetic phase mainly comes from the difference in objective because the designers' and architects' main goal is the integration of a plan,which is beyond collecting data and interpreting it. The disjoint of analysis and synthesis is one reason for failing design, since both, as well as the bond between them, are essential to the feedback process. Yet the synthetic process in planning requires domain knowledge, remain difficult, notably slow, and the community has limited exposure to this step of the realization of the program. Thus, today's community engagement processes do not have a clear distinction between the two major phases of design.
The evolution of technological tools for urban planning and their relationship to public demands will be explored in Chapter 2.
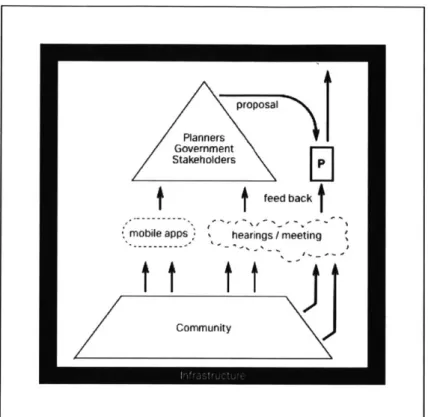
Figure 2: Demand from both the planners (wicked problem
[Churchman, 1967]) and the community (evidence of proposal urbanization leads to
democratization
Planners [Woolley et al., 2o1i])to
Government
Stakeholders
L
externalize the proposal(rectangle with P). Now citizens
feed back can provide feedback and -- , , .. , - co-design the interventions.
'mobie apps: hearings I meeting ' This is the typical diagram for
...-
-today's community
engagement. The planners are still proposing the plans which are the primary generator of
community solutions.
of the process. As these tools become more sophisticated, there is potential to have them as an integrated system that provides easy transition between the analytic and synthetic phases, thus creating a faster iteration of trial and error. A list of tools is provided in Chapter
3 to discuss different attempts of community engagement.
This thesis looks at a specific topic in urban planning: making cities more accessible to bicycles. The tool -bikebump -that allows users to passively report problems with urban infrastructure, then invites them to actively participate in planning processes to improve the urban environment. Having an integrated platform though the data collection and plan proposal is what makes this attempt novel.
Chapter 4 will look into implementation: not only the actual development of the tool, but a schematic of how this approach may be integrated into the real situation. This proposed method has two major differences compared to the method that is currently conducted through the United States. One, the box has inputs in two different directions from the community, indicating the data analysis and plan
synthesis. Two, the planners2 and the mayor3 will have a different type of role when it comes to approving and modifying the metrics to align with the long-running plans. The chapter will cover the comparison of the current standard process, with the tools and methods used for developing this web-based application, and the procedure of how it will work. It will also cover the experiment conducted to see the application's performance. Figure 5 shows the procedure of the user experience.
i. User rings the bell if there is something worth reporting (a DING).
Simple protocol of single DING indicating "unsafe/dangerous" and double DING indicating "safe/pleasant"
2. Smart phone detecting the bell sound from pre-calibrated frequency
4
3. Geolocation, "dangerous/pleasant" value, and sound clip sent to
database
4 The application has access to the
phone's microphone and can detect the ring, saving a short sound clip of the moment before the bell ring.
Planners approval Government - p
Stakeholders
data visualize plan prioritize collection
city. cope platrm
Community
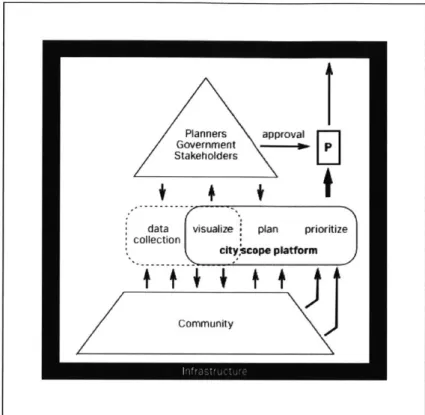
Figure 3: The cityscope model
covers the analysis through the
prioritization phase. Apart from the visualization and tangible interface, it is a tool for iterating the analytic phase and synthetic phase. Note the arrow from Planners to the Plan is approval, which the plan generation is a collective collaboration from the whole community. [Hadhrawi and Larson, 2016]
' Metropolitan Planning Organization
Figure 4: This thesis
proposes and implements an
integrated tool that prioritizes contextualized data collection used for urban planning interventions.
4. The data will be mapped to a web browser interface that others would be able to observe.
5. User provides complementary information about the DING. 6. User propose an improvement plans by selecting a solution and the
road.
7. User votes for improvement plans the agree to have.
Contribution
The main contributions of the thesis are to connect citizens into the urban planning process through a novel technological solution. By harnessing feedback from individual bicyclists, the tool opens the urban planning process beyond mayors and professional planners, and includes average citizens who can collectively architect the physical
Planners approval Government
-p-Stakeholders
Edatt
collec ton visualize pan p prioritiz)
analytic phase synthetic phase
( ring bell detection
T
O r in g
!
® collect
Sound Clip (4sec) (latitude, longitude }
-Good / Bad (# dings)
C follow-up 40 visualize
or solution selection
(after commute)
Figure 5: The flow of user interaction. 1.user rings bell 2.smart phone detects bell 3.data sent to server 4.visualized onto Map 5. followup questions, proposing improvement plans, and voting.
environment surrounding use. It may also help the planning side to understand the residents' demands. In addition, the schema for the new urban planning support tool will externalize the process plan analysis and synthesis, which is often tacit knowledge within the planners. The study proposes a bi-directional communication method to connect the top and bottom of the process.
2.
Background
This section considers the challenges of urban planning from a historical standpoint looking into the following four perspectives:
* Examining the physicality of democratic decision making, starting from ancient Athens to present United States town meetings. " Exploring the idea that urban planning connects social issues to
physical sites.
* Looking into the issues that planning experts encounter today, and examining which aspects are still critical when we have a collective tool.
" Considering technologies that modern society can leverage and explore to support the complicated task of decision making.
First traces of direct democracy and the scale of the city
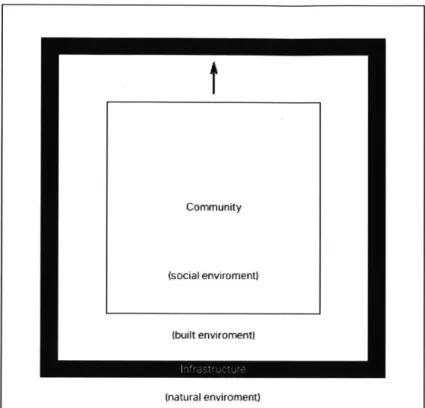
It is clear that modern smart phone technologies have the potential to support a direct democracy model in social planning. But before discussing these modern techniques, it is important to consider the underlying mechanism of how we have been planning as a crowd. Although the virtual tools have no constraints, scale is a key element in urban design. The diagram in Figure 6 is the most primitive form showing the relationship between a small community and planning, infrastructure, and buildings. A built environment is defined to be "the human-made space in which people live, work, and recreate on a day-to-day basis" [Roof, 2008], the physical layer of this human-made space is the infrastructure, which is the base of human activity. Inside the built environment, we have the social environment, which is the
24
community. The arrow from the community shows that it modifies the infrastructure.
I
(natural enviroment)
This simplest form does not have any distinction within the community; it is small enough that the entire process is led, examined, and executed as a whole. The Athenian direct democracy is the earliest form of democracy that has been documented [Ober, 2008] 5. While we may see this as a pure form of equal political participation, it was open only to men over 18 that had military practice having the right to speak and vote during each gathering. Moreover, critics pointed out that it was biased by individual member groups which dominated the proceedings, and knowledge levels were unbalanced, far from informed decision. Despite these impurities, it is considered the very first form of direct democracy and people gathered on the hill of Pnyx as frequently as once every ten days. The hill of Pnyx had the capacity to hold 5000 to 13,000 people 6, and the resolved issues took immediate effect.
As it was primitive in the context of democracy, it was primitive in the sense of urban planning as well. Before this era, cities spontaneously
t
Conwunity (social enviroment)
(bult enviroment)
Figure 6: The first form of a city and layers of environments.
We see the community or the
society in the middle, which is the social environment. The social environment is included in the "built environment," a physical and artificial region, that was first realized in Athens. The infrastructure functions as the border between this artificial region and the rest. The arrow indicates that the community modifies the infrastructure to meet their own needs. Athens is considered a communal city, for which the physical and artificial environment was planned first, before community was allocated.
5 It is recognized that Athens had
constantly imitated the social institutions of others, so it is not clear whether it is the first of its kind.
6 This number range is close to the
populations of the neighborhoods in Cambridge, MA http: //ww.
cambridgema.gov/-/media/Files/ CDD/FactsandMaps/profiles/demo profite-neighborhood-2016. pdf?1.a=en
emerged by villages and tribes merging and splitting organically. Athens was one of the first examples that was artificially planned using grids, coming from the fact that it was a colony and the planner Hippodamus 7 had a task to allocate residents. Aside from the gathering and voting at the hill, there were places that men would exchange opinions and have political discussions very close to their daily lives. One such place was a room called the oikos. This room was planned adjacent to the courtyard and was open to the public. Political theorist Hannah Arendt[Arendt, 2013] pointed out that this early stage
of the built environment and policy had an intimate relationship with each other. The wall separating the oikos and the other rooms was called the nemein, having a different meaning of distribution, or property, which in turn has origins to the word nomos, which means law. Arendt emphasized that physical structures, like a wall, are political artifacts.
Lessig points out in Code: And Other Laws of Cyberspace that there are four factors to constrain human behavior; "code (architecture)", "law," "market," and "norm." [Lessig, 2009] We see that in the age of Athens, "code (architecture)" and "law" were undifferentiated and shared their origin.
One form of direct democracy that we can observe today is the town meetings in the northeast region of the United States. In Massachusetts, cities with a population of fewer than 6,ooo are allowed to open town meetings and autonomously decide social issues. Although the types of issues are different compared to the times of ancient Greece, it is similar that the citizens pass knowledge and have interactions with one another, and collectively plan their city. It is said that the Roman Republic started this representative democracy, and the global majority have lived in this form of democracy since then. The world's total population has continued to rise, having both more population and density. The cost for deliberation 8 increases as the number of people involved rises as well as the administrative cost for voting.
Figure 9 shows this pyramid structure, a top-down method that is elected by the broad community. Media technology, such as telephones and email, allowed the crowd to have a communication path to the top. Yet the form of communication is very different from town meetings, since these media are usually isolated, one-to-one methods of communications.
7 often referred as the father of
European urban planning.
Figure 7: a town meeting at Warren MA, 2014.11
Figure 8: citizens show their opinion by standing up and down.
IFishkin lists the property of a deliberative discussion in five elements. [Fishkin and Luskin, 2005]
" Informed
- Balanced
" Conscientious Substantive
Figure 9: As cities grew in size and density, it was no longer feasible to operate in a direct democracy model. The social environment changed its size into a pyramid where planners, governors, stakeholders, land owners plan and execute to change the city's infrastructure. The top part
Piannes of the pyramid gathers data
/ Governrent
Stakeholders from the community. This is
accomplished in various ways
enail and media technologies have
phone calls
I
tbeen innovated to do this.
Now the community is able to
Comwnunity individually provide opinions
to the planners.
Methods to effectively collect opinions in a centralized way were invented by the planners. We can categorize these methods based on the amount of information that is exchanged (Figure :o). The smaller the information per transaction, the easier to process, which influences the design of the tool. For example, polls and surveys are limited in information but are easy to visualize or even directly interpret as the collective decision. The amount of data can be quantifiable by calculating the entropy[Shannon and Weaver, 1998:
n
H = P(xi 0log2 P(Xi) i=1
The other side of the spectrum has the richest information and can be seen in organized events to gather people in one place which includes workshops, focus groups, ... etc. Although these events are organized and centralized to make it effective for the head of the pyramid to listen, events are open ended, vocal, and unstructured, making it difficult to know the influence on the proposals the city made. We can seek a form of interaction that is more communicative than a vote, but more structured than open discussion. In any case, this information
IbI 9Ki
O 0
can be exchanged between participants, and it is influenced by what kind of media is used for this method.
Different types of media technology influence these methods of hearing. Talking to each other is the least constrained, which again is unstructured, but rich.
,W NO bft
t
Figure 1: Urban planners started different methods of "hearings" to centralize input from the community. Appendix shows different traditional methods (repeated from page
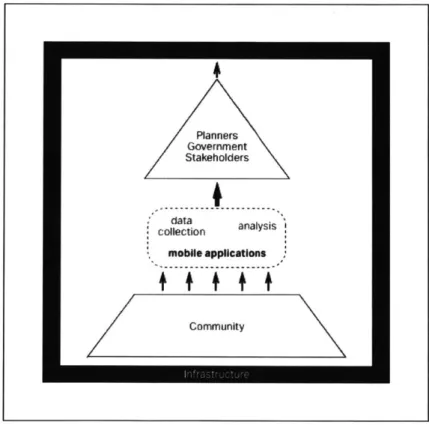
18) Planners Govemment Stakeholders * data aayi collection analysis mobile applications ConrnunIty I
Figure to: The smaller the amount (bits) of information processed within one transaction, the easier to process. As it gets larger, it becomes unstructured data, which is hard to directly convert to a decision or intervention. Numbers indicate the average amount of information for each method of interaction. Note that that there are "unconstrained" methods, in which the information is unlimited.
Figure ii: Modern technology enables the community to provide data in a centralized way through collaborative data collection and analysis. Compared to the methods that do not leverage the media technology, these are better at collecting more data at once, since there are no physical constraints for gathering.
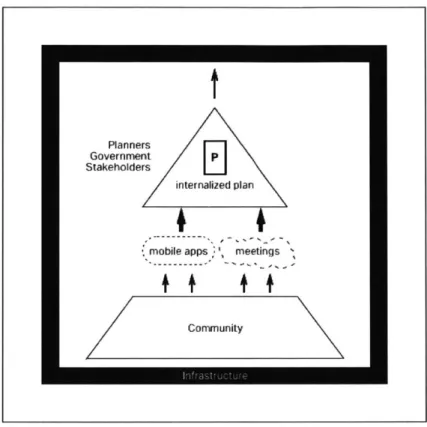
Figure 13: Despite the
innovation in "hearing" methods, this state still has the plan internalized in the top section of the pyramid.
Until this point, the "plan" or the process of planning is still internalized inside the top sector. (Figure 13) Both the planner side and the community demanded to externalize this element and make it visible to everyone.
the planning side and the "wicked problem"
The difficulty and complexity of social planning was addressed by Churchman who coined the term "wicked problems" [Churchman, 1967]. Churchman first points there are "tame problems", which the issues are well defined and it is clear whether the problem was solved. "Wicked problems" are the opposite, which cannot be framed in a template and are difficult to validate whether the problem was solved. We can see the frustration that planners experience in Churchman's description:
Professionals and citizens
Planners Government Stakeholders
internahzed plan
-mobile apps meetings
The lay customers are complaining because planners and other professionals have not succeeded in solving the problems they claimed they could solve.
According to Churchman, there are ten characteristics of a "wicked problem", and one of them 'The social planner has no right to be wrong' challenges the position of the planner.
Similar to the contrast of 'tame' and 'wicked' problems, other fields of science also questioned the performance difference of professionals solving problems compared to nonprofessionals. Johnson states that cognitive science and artificial intelligence show that experts perform better compared to novices while the empirical research in behavioral decision-making claims that this is not always true. [Chi, 20141
He continues that artificial intelligence focuses on structured 'tame' problems like chess, whereas behavioral science looks into 'wicked' issues, in which it is hard to define the aspects and detangle the influences of each of them, such as predicting the market. Hence, this has created a discrepancy of the evaluation of the performance of experts. Johnson cites Armstrong, who suggests hiring the cheapest expert, pointing to their poor performance in forecasting.[Armstrong, 1978b] Urban planning is one aspect of social planning, which by nature is a "wicked problem," which means the urban planning experts could not be guaranteed to always perform better than novices.
When planners are not able to meet public demands and are unable to predict what comes next, the gap of mistrust between the public and experts increases. Especially when the value judgment is based on Churchman's point in 1957 "solutions to wicked problems are not true or false, but good or bad."
One possible method to overcome "wicked problems" is to take a collaborative approach. [Roberts, 20001 Yet skills of collaboration are limited, especially among people who work in a traditional bureaucracy with a strong hierarchy limiting participation and team-based approaches to problem solving and decision making. 9
9 The study examines three approaches, and concludes that the collaborative To overcome this, new tools and methods are needed to support strategy is most effective.
collaboration, inform people with different perspectives, lower the
administrative transaction cost, and provide a learning experience on * Authoritative Strategies
each topic, which is exactly an effective democratic process. (Figure14) e Competitive Strategies
Democratization
There is evidence that urbanization triggers democratic change [Woolley et al., 2010] and as urbanization is seen globally, we can assume that demands for democratization will generally increase. Dewey advocated giving the community the power and right to collectively govern themselves, inferred that information and education are the key factors to have the community undergo decision making, and added that the 'new journalist' was the one to coordinate.
[Dewey and Rogers, 2012]
He emphasizes that the 'new journalist' has two central roles: verifying which information is reliable and ordering it so the people can grasp it efficiently.' Shirky has pointed out that, historically, the balance between media consumption and creation from the community was dominated towards consumption, but the advent of modern communication tools and the amount of output processed from them show that people also have the desire to create and share [Shirky, 2008].
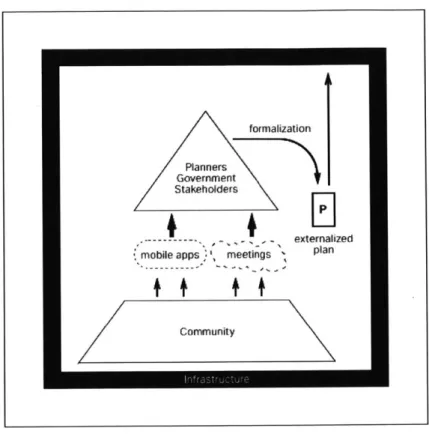
Figure 14: The plan has been externalized to the public. We see this by the current planning schema required to have a public meeting. (Although the strength of influence varies place to place.)
10 In the modern world, a system may be able to do both using collective input. formalization Planners Government Stakeholders --- -- externalized
mobile apps meetings plan
We might see "new journalism" as a device that moderates between creation and consumption, forming a new type of system. The challenge is to transform individual experiences, frameworks, and perspectives into a shared, understandable, and, most importantly, transmittable area of knowledge
Figure 15: Community
engagement that will directly influence the plan.
Figure 15 shows that people are now not only exposed to the plan, but are able to provide feedback. As of 2017, it is required by Cambridge law to open a public meeting in order to obtain a permit. Again, the level of participation has been increasing and present planning procedures name this activity the community engagement process.
Analysis and Synthesis
Yet the community has one more step to become politically autonomous: the synthesis phase.In Athenian direct democracy, people not only voted, but proposed the topics to vote on. In Notes on the Synthesis of Form, Christopher Alexander clearly
proposal Planners
Government
Stakeholders \
feed backjt mobile apps hearings meeting
mmy--
-
distinguishes that in a design procedure, there is always the analysis phase before the synthesis phase, and the two are different.
Finding the right design program for a given problem is the first phase of the design process. It is, if we like, the analytic phase of the process. The first phase of the process must of course be followed by the synthetic phase, in which a form is derived from the program. We shall call this synthetic phase the realization of the program. [Alexander, 1964]
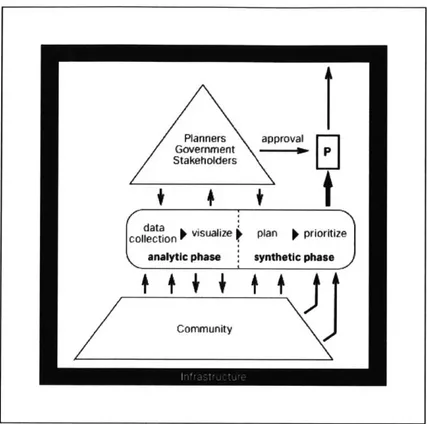
There are few attempts that distinguish these two processes. Having the premise that these two are different, there are fewer attempts to integrate them into the same platform. Figure16 shows one example of such a platform. The synthetic phase referred by architects was often a process done by an individual, which is a process of deciding trade-offs and finding the right configurations that most fits the context of a given problem. By inventing the Pattern Language, Alexander created a method to synthesize an architecture plan through a deliberation process.[Schuler,
I
Figure 16: Integrated design method that combines analytic
and synthetic phases.
Planners approval Government
-Stakeholders
t
dat
econ yvisualize
planning5
prioritize analytic phase synthetic phaseExtending Collective Intelligence
Artificial intelligence has been gaining attention because these technologies have advanced through the increase of available data as training sets. A substantial amount of data for training machines originates from human input, which is at the same time used for training (learning and teaching) humans. Today we know this is a form of collective intelligence, and the inputs from the citizens are included in this category. Extended intelligence is a concept to acknowledge that intelligence was always a network and should incorporate both artificial intelligence and collective intelligence to utilize them mutually.[Joichi, 2016 Hidalgo points out that network intelligence existed from the beginning and cities are "pockets where our species accumulates the capacity to produce information."[Hidalgo, 2015] He mentions that the novelty is today's technological context where computational resources have been distributed more than ever before.[Hidalgo, 2016] Research says that the combination of these
two types of intelligence has potential to overcome the performance [Baharad et al., 2011] in fields that were thought to have little or no difference comparing professionals and nonprofessionals. (p28) With the collective and the artificial intelligence combined, the tool will now learn and augment the community.
3. Extended Examples
Traditional methods for community engagement
Attempts by Architects and Planners
The objective of an Architect or a Planner is to explore until there is conversion to a single well-structured knowledge gives hints about how we can integrate method of urban design.
many variables solution. This a participatory
Lawrence Halprin & Charles Moore
Lawrence Halprin and Charles Moore have concentrated on trying different methodologies of collaborative creative processes. For designing large scale projects, they used a large canvas to draw the plan or perspective within the community meeting, iterating through the different design possibilities. This method illustrates the designer's role of rapid prototyping.
Landscape Architect Lawrence Halprin also proposed the RVSP Cycle, a method of a collaborative creative process, which he practiced throughout his career. It is a circular diagram inspired by the compass of the psyche from Jung. Table1 shows the elements that this diagram contains.
R resource data collection phase to know what is available
S score the instruction set for the intervention
V value-action a collective process of debating and discussion P performance the execution of the plan
The creator argues that this cycle is agnostic to where it starts or the order of execution of each element. Halprin also emphasizes that this is an endless process which changes its coordinate relative to the
Table 1: Elements of the RSVP
steps taken chronologically. (Figure 17) This relativity comes from the influence of his wife, Anna Halprin, who was a choreographer. This behavior resembles and can be considered as a strategy similar to a search algorithm trying to look for a (sub) optimum while the fitness landscape changes at the same time.
Arata Isozaki
Architect Arata Isozaki held an exhibition in 1997 using the Internet and email for planning, which is one of the earliest examples of collectively designing an urban-scale project by both citizens and professionals collaborating with each other. A fictitious island was the site for this design iteration with three methods for this participatory approach, each art piece named "the internet," "visitors" and "signatures."
'The Internet' was the open platform that would let opinions from the public modify the virtual plan. The total number of people connected to the web in Japan was only around io% of the whole country's population. The exhibition was open for gathering opinions via email and provided 3D models to modify or overwrite the existing design. "
'Signatures' had 50 architects assigned to a site and separately planned one of their previous architectural pieces without the considerations that are usually sorted out, such as orientation and size. The initial layout plan triggered problems that would need negotiation between adjacent architects to "fit" their design properly. 'Visitors' focused on the chronological aspect of collaborative design. It had a chief architect that supervised one district for a total of two weeks, passing it to the next architect after their turn. This workflow has similarities to that of today's software development, where people collaboratively develop software by forking code made by peers. The architects were encouraged to collect data from the Internet. This exhibition was not only novel because of using the Internet and email, but was an experiment on how we collaborate and interact using these new techniques.
With each piece dealing with mass communication("the Internet"), negotiation with peer neighbors('signatures'), and chronological collaboration('visitors'), we see that this exhibition takes collaboration as the central factor, experimenting on what will happen when modern technology has been introduced to it.
IR
Figure 17: The RVSP cycle changes its position dynamically, relative to the previous state.[Halrprin, 1969]
1 Information Technology White
Paper http://www.soumu.go. jp/
johotsusintokei/whitepaper/ja/h27/
Browser based applications
Browsers are a type of software that arguably have had the most money and effort involved in their development. Yet browsers are particular in ways that are cross platform, including different devices from smart phones to desktop workstations. The following are the web applications I have developed for participatory design.
Nigechizu -Shortcut Evacuation Planning for
Tsunamis-Figure :8: Web-based shortcut planning tool: Created for workshops to learn the risks of tsunamis and how to evacuate.
As a reaction to the tsunami damage from the 2011 Tohoku earthquake and tsunami, I have created this tool to engage citizens affected by this disaster.
This web browser-based tool starts by visualizing the risk of a tsunami coloring the paths depending on the duration for evacuation. " After the first strike of the tsunami, people constantly wanted to know which direction to escape because it was sometimes not obvious given the complex terrain of the Tohoku region. The second feature was to let the community choose how to create shortcuts. Since shortcut paths reduce the time for evacuation, selecting two points and connecting them increases the area's safety level as a whole. The significance of this app is enabling people to choose two points to connect, unlike voting for a particular configuration. The trials were recorded in the server to be superimposed to get the most popular positions that needed to be connected.
" This was calculated by a normal
walking speed of an elderly citizen, taking the shortest path to the closest
high enough altitude.
Figure 19: Users will connect two points to create a shortcut to decrease the overall
LMN Architects -distributed version controlling in 3d
models-This example is also a 3d modeling application in a web browser, and every model is connected forming a network. The connection of two models is the inheritance, where the participants choose a preexisting model as a reference and start modeling on top. The user submits a 3d model, which is a large amount of data compared to voting or connecting dots, and often thought of as unstructured data. The application saves the 3d model into a data structure that could apply a diff algorithm to make the 3d model comparable and calculate the similarities between two models visualizing the strength of the connection.
4- C ~
rrM Wn Vra 325.1s
PlacePulse
Place Pulse13[Salesses et al., 20131 developed by the Collective Learning Group in MIT Media Lab, is a collective effort to map our perception about the city by selecting one image out of two. 10
The amount of information sent per interaction is the smallest in this section, yet has collected more than 1.4 million clicks14.
Mobile Applications
SeeClickFix'5
SeeClickFix is a mobile application that is similar to calling the number
'311' when citizens demands to report non-emergency maintenance issues. Originally developed for the city of New Haven and has now expanded for more than 300 cities Reporters can submit text and
Figure 21: Web based distributed modeling.
Figure 22: Each model starts with a preexisting model and revises it. Thus, every model is connected, having the similarities calculated by the diff algorithm.
Figure 23: Every model is created using the web browser.
13 http://pulse.media.mit.edu/
4 as of August 2017
pictures, which is unconstrained. Although not clearly specified, the reports focus on maintenance issues, and less about the planning and changing the city.
Waze
Waze is a driving navigation application, which uses the status of other drivers using the same application. Each driver can passively send the location and speed of the car, or actively contribute to marking the road if there is something worth noting to other drives. Each data is structured. This distributed traffic monitoring is an example of collective analysis, creating mutual benefit and a sense of inclusion between complete strangers who do not share any identity except being drivers. The objective of this application is to form this collective
intelligence; there is no connection to any planning procedure.
Street Bump
Street Bump developed by the new urban mechanics, is a mobile application that gathers accelerometer data while driving. It is a passive data collection method'6 which is similar to waze, but focused on detecting potholes. The application introduces one question of whether or not we should have the human's fuzziness in the data. In one way, the accuracy of detecting a pothole is a matter of engineering, thus a 'tame' problem. Yet we do not know if the human subjects actually cares or feels the pothole is important. In severe cases, people may avoid to step on a pothole, which observation of human behavior is crucial for sensor oriented projects. [O'Leary, 20131
Action Path
Action Path,17 [Graeff, 20141 developed at MIT Center for Civic Media, is a mobile application that shows notifications when a user enters a predefined geolocation and asks questions on urban issues tied to that geolocation. The application provides agency to the citizens and creates data to represent the collective opinion. The interaction with
the user produces one of the smallest amounts within this section.
i6 w people do not proactively interact with the data
Augmentation of Offline community engagement by online tools
Tangible Interfaces: CityScope, Finding Places
City Scope is a platform for people to gather and build consensus using a device that incorporates data projections, a tangible interface, and real-time simulation. Multiple projects have advanced using this platform collaboration with different cities and universities.
Each project has a different focus, hence the content, what to visualize/project, type of simulation, who to engage, objective has varied.
Finding Places uses City Scope to prove a space for discussing the issue of placing immigrants who have come to Hamburg, Germany which received more than 1.2 million refugees in 2015. Using a City Scope table, a total of 34 workshops were conducted to discuss the best place to open room for those seeking asylum. Each session took 2
hours with on average ii people participating.
This tool covers the analytic phase and synthetic phase and enables people to have real-time feedback running simulations showing potential implications of the population increase. It is a structured tool since users manipulate color-coded Lego bricks to run each simulation. On the other hand, the discussion held over the table is rich and vocal.
Figure 24: Changing Places City Scope Platform.
Community PlanIt
Community PlanIt'8 developed by the Engagement Lab is a gaming
platform to support civic participation in planning projects. The '8 https://elab.emerson. edu/proj ects/civic- media/
community-planit Planners approval
Government - p.
Stakeholders
data Lanalysis planning prioritize collection
cltyscope platform
platform asks questions or small tasks'9 to the participants, inducing conversation with each other or manifesting each others' vision for the city. The platform can be used parallel with public meetings that will foster the deliberation process of the event.
Cambridge participatory budgeting
Participatory budgeting originated in 1989 in Brazil. It is a bottom-up method with which people propose and decide how to spend a portion of public tax revenue. Cambridge has been conducting this project with browser apps augmenting the process. The application has two views: the map and the list. The map is a plot of different proposals that were submitted by other citizens. Users can explore different proposals within their neighborhood. The list has the same information but is sorted by the attention the project has collected.
coUrbanize20
/hlcyanThis is an online platform for urban planners and real estate developers to post their projects and host discussions to gain feedback. The tool is more a platform to list different development projects.
tools from delib
Delib " developed a series of online platforms for different occasions necessary for planning and community engagement: 'Dialogue' is for project manifestation for gaining feed back of plan proposals, 'Citizens Place' is for consolidating questionnaires and online consultations, and 'Budget Simulator' is for engaging citizens to gain insights on projects with budgets taken into consideration.
19 to make it more gamified, missions
20 https://courbanize.com/
4. Design and Implementation
Case Study: bikebump
To test a system that handles data collection, visualization, plan proposal and prioritization, an application for improving bike lanes was selected for a case study. Using bikes to commute has been a trend through recent years though the US; one consensus shows that there was a 3% increase in people choosing bikes for everyday transportation from 2010 to 2013 and is close to double
compared to the year 2000.[Borchardt, 20171 City investment in bicycling infrastructure is in sync with this increase in bicycling as a method for commuting, especially in dense urban areas. New York has had 400 miles of cycle path renewals starting from the 2000s.[Sadik-Khan, 2017] The field of public health supports this by research showing investment in bike lanes is efficient compared to
other public health interventions[Gu et al., 2016. 22
bike lanes in urban planning
Urban planning interventions tend to be exceptionally expensive23 , yet the process for deciding which to execute is also long and tedious. Because of this slow process and cost impact, it is difficult to make the proposal creation into a learning process. In the United States, the construction cost for a highway is $8 to lo million per mile, where one of the most expensive bike lanes will cost $445,000 per mile.Bike lanes are relatively inexpensive; the simplest ones require only paint on the road surface. Moreover, these interventions are reversible, which enables iteration through trial and error. While some interventions, like painting bike lanes, are cheap and reversible, and thus possible to implement quickly, other interventions are more expensive and require
" The study compares different health investment by the QALY value(how much money is needed to gain one person one year of public health.) The results show that vaccines are exceptionally cheap ($1oo), bike lane investment ($1300) is also on
the cheaper side, whereas $6,7oo is spent for Medicaid.
23
the United States invested $350 billion
in the year 2010 [Musick, 2010], and
$416 billion in 2016
https://www. cbo.gov/sites/default/ files/114th-congress-2015-2016/ reports/49910-Infrastructure.pdf
a great deal of domain knowledge and engineering. Implementing these solutions will be inevitably a slow process. It is difficult to design or even reach a consensus within the community. Because of the duration, "straw polls" may not directly reflect the demand of citizens when the construction is actually completed, especially where people tend to move frequently. Yet there are examples that the demand of such long and costly infrastructure is decreasing, since this relates to different types of transportation people use. If the trend of the number of cars decreasing continues and multi-modal transportation is accepted, light interventions such as bike lane improvements will raise the share, supported by the trend of the increase of population density, the cost impact per population will decrease.
bike way infrastructure
The 2012 national survey on Bicyclist and Pedestrian Attitudes and
Behaviors shows that collision with cars is the top factor of bicyclist injury [Schroeder and Wilbur, 20131, so it is crucial to clearly separate cars and bicycles. The second ('falling') and third('road not in good condition') cause could also be reduced by having separate bike lanes. Research shows that protected bike lanes reduce the possibility for injury to half.[Teschke et al., 2012]
Over 36% of the population of Netherlands choose bicycles as their main mode of transportation. Relative to other countries, the Netherlands had always been keen investing bike infrastructure, even when urban planning was aiming for a car-centric society. Investment for bikeway improvements started to rise again around 1970 coupled with a protest movement to prevent children being killed by car accidents. Today Amsterdam is known to be the most bike-friendly city, yet there is no single solution that makes bikes this popular. This is an example of Lessig's two within the four elements of constraints in human behavior. For "code", it is easy to think it has a rich bike lane infrastructure which is well connected. Moreover, the Netherlands has flat and high density geographic characteristics that well suit bicycle commuting. "Law" constrains all urban planning to be fully accountable for bike lanes. Also the legislation is unfavorable for cars which need to compensate most of the damage if there is an accident.
Current method for changing bike-related infrastructure
The Transportation Improvement Program is a federal requirement for each state listing improvements for all transportation needs. This is the standard throughout the US and bike lane improvements are included.
required for every state formulates every 4 years
Metropolitan Planning Organization
-prioritization / draft
Transportation Advisory Council approval & public hearing 2
P (once per year)
application
]
- any organization -1 -2 year cycle public hearing 1 (held 4times/year) -blackbox budget allocation approval ofcity's chief elected officer
align to other state plans
Area of Interest
1. The process starts with the city level being required to have least one public hearing, and the approval of the city's mayor. This needs
to be aligned with the state-level manifesto.
2. After meeting the city-level criteria, it is scrutinized by the local office of the Metropolitan Planning Organization (MPO). The MPO evaluates and engineers the proposal into an executable plan. The
Figure 25: TIP(Transportation Improvement Program) required by each state. https:
//www. gpo. gov/fdsys/pkg/ USCODE-2011-title23/html/ USCODE-2011-title23-chapl-secl35. htm Statewide Transporation Improvment Program P P . a P
collection of plans / annual update
MPO also prioritizes the plans.
3. The list of plans undergoes a second public hearing and is discussed
with the Transportation Advisory Council.
4. Once approved, the proposal will be listed into one plan inside the Statewide Transportation Improvement Plan.
required for every state
formulates every 4 years
Metropolitan Planning Organization
Mayor metric modification approval of method Statewide Transporation Improvment Program
E
P ...
E
P
collection of plans / annual update
Transportation Advisory Council approval ' & public hearing 2
prioritization / drafting
public data
collection structured proposal submission -short term campaign
-transparent budget allocation
-compareable data
Proposed Bike bump system
Other processes, such as the Cambridge Participatory Budgeting project, are capable of assigning budget to road infrastructure improvements. The current method provides a way to submit an idea to any given point of the city. The ideas are based on subjective comments and no cost estimation is there, with no data to support the proposal. Figure 26 shows the alternative method using Bikebump.
Compared to present systems, the main differences are:
1.
Bikebump presents a method for collecting behavioral data in the urban environment.Figure 26: Proposed Method
Bikebump adjusted to fit the current system. TIP is a federal requirement for each state
to compile a list of executable improvements regarding transportation issues. The top of the pyramid from the previous includes the MPO and the Mayor, given a role of approval (which is no different from another single vote) and metric modification and engineering of plans. The improvement plan that was generated and prioritized by Bikebump will undergo one last process of being approved by the Transportation Advisory Council, which is also tied to a public hearing.
2. Bikebump offers a method for collecting planning ideas from individuals.
3. Bikebump provides a method for approval for mayors.
4. Bikebump gives planning organizations ways to modify metrics and meet with longer-term goals that should be consistent with previous settlements and plans.
Implementation Overview
This section explains the implementation and techniques used for developing the application. The application is based on modern browsers, which recently extend the capabilities that were limited to mainly text and images. The WebRTC (Real Time Communication) is a series of protocols and APIs specifically for capturing audio and images and uses them as inputs without plugins. The Bikebump application leverages this technology to capture sound data. FFT will be applied to get the frequency distribution of the called Web Audio API, Appendix I. used framework and external APIs provides the extensive list of used APIs for developing the application. The application is structured in the form of a web application, of which the components are: the database, back end server, and front end client. The database is a NoSQL, which stores data as giant JSON data. To reduce the number of requests and increase efficient data transfer, the database contains some redundancy in memory.
Definition
The following are definitions for elements that make up the application.
DING
A DING is a spatial representation of a ring bell report. It defines the geofence of the DING with a center geolocation and radius. It also holds information for each report, which is the timestamp, user's ID, and the "good"/"bad" value based on the study protocol. If there is a road near the center location, it will also contain the road's identifier and distance from the closest point of that road.
ROAD
A ROAD is a geometrical feature that is returned by the Vector map API call. A newly created ding will find the closest road registered in the OpenStreetMap database and geometrical features will be copied to the Bikebump database. When creating an IMPROVEMENT PLAN, users will first need to know which ROAD they are willing to submit a proposal.
COMMUTE
A COMMUTE is series of GPS location data, to know the whole path
of each ride session. Raw GPS data has a tendency to bounce and contain noise, so it will be processed to match the road network in OpenStreetMaps.
BIKE COINS
BIKE COINS are the tokens for deciding which intervention to prioritize. Each user will initially receive 1oo BIKE COINS, which can be distributed by the user.
IMPROVEMENT PLAN
An IMPROVEMENT PLAN is a combination and a SOLUTION. This method of having of where (CONTEXT) and what (SOLUTION) them is taken from Christopher Alexander&Ats The Pattern Language. [Alexander et al., 1977]
of a CONTEXT a separate list and combining methodology of
The method of defining patterns (a recipe of what to do in order to come up with an outcome) and applying them to common cases is widely used in the realm of software engineering as design patterns.
24
Each IMPROVEMENT PLAN holds information of how many BIKE COINS it requires to be counted as a community-approved plan. This number can be calculated using the SOLUTIONaAs type and unit cost, multiplied by the length of the road.
SOLUTION
This is the execution instruction for a possible plan; examples are creating Bike Boxes and painting the lane with green paint. This is separate from the CONTEXT focusing on only what to do for a road, equivalent to the patterns in the Pattern Language. Information included in one solution are name, description, type and unit cost. The type is used to differentiate whether the solution needs to account the length of the improvement or not. For example, a Bike Box will only be needed for one intersection, where painting a lane in green will differ with the total length. The unit cost is how many BIKE COINS would be necessary per unit, which is defined by the type. The unit cost will be connected to the cost of the intervention. The cost will
4 Although Alexander himself claims that "design patterns" in software is different to what he had created, since the patterns are distinctive, having no interrelation between them. https // www. youtube. com/watch'v=98LdFA--_zfA
include but not be limited to monetary cost, since some solutions will be politically difficult even in relatively cheap interventions.
For the experiment, three solutions were provided (Table 27). Each intervention has a unit cost, calculated using the raw material cost. According to the Urban Bikeway Design Guide[NACTO, 2014] the dimensions for a Bike Box are:
12f t(W) x 16ft(h)
and for Green Paint it are:
12ft(W) x 2(bothsides)
Given the area, the raw material cost was calculated by a paint cost simulator. /footnotehttp://www.asphaltkingdom. com/
parking-lot-paint-calculator
Plastic Polles are estimated to be installed costing $150.[Marshall, 2016]
in 2m pitch with each
Green Paint
$25 / mPlastic Polls
$75/rmBike Box
$320/ roadFigure 27: The three solutions provided for the experiment. The unit budget was calculated based on the raw material fee. Note that Green Paint and Plastic Polls are length-dependent where Bike Box is just one for each ROAD segment.
Green Paint is painting the bike lane green. The material has varieties such as ordinary paint, Durable Liquid Pavement Markings (DLPM)2
5, and thermoplastic. Changing the pavement to a different colored material has the same effect. The budget calculation is done using the least expensive, ordinary paint. This tends to wear out fast, and is also easy to erase. [NACTO, 2014] A Bike Box is a marking for an intersection to have a place for bikes to stop before the cars. This makes it easier for bikes to turn especially to the left (in the United States, which is right side traffic.) The material is identical to the Green Paint intervention. Plastic Polls are tubular markers that separate the car lane and the bike lane. It is one of the cheapest interventions to create a protected bike way.