Analysis of Metazoan DNA Replication Initiation using Drosophila Gene Amplification as a Model System
by
Jane Christina Kim
B.S. Molecular, Cellular, and Developmental Biology, 2004 Yale University
New Haven, CT
Submitted to the Department of Biology
in Partial Fulfillment of the Requirements for the Degree of Doctor of Philosophy in Biology
at the
Massachusetts Institute of Technology Cambridge, MA February 2011
ARCHVEs
MASSACHUSETS INSTITUE OF TECHNOLOGYNOV 16 2010
LIBRARIES
@ 2010 Jane Christina Kim. All rights reserved.
The author hereby grants to MIT permission to reproduce or distribute publicly paper and electronic copies of this thesis document in whole or in part.
Signature of Author ... Certified by ... Accepted by ... C Department of Biology November 8, 2010 Terry L. Orr-Weaver Professor of Biology Thesis Supervisor Stephen P. Bell hair, Committee on Graduate Students Department of Biology
Analysis of Metazoan DNA Replication Initiation using Drosophila Gene Amplification as a Model System
by
Jane Christina Kim
Submitted to the Department of Biology on November 8, 2010 in Partial Fulfillment of the Requirements for the Degree of
Doctor of Philosophy in Biology
ABSTRACT
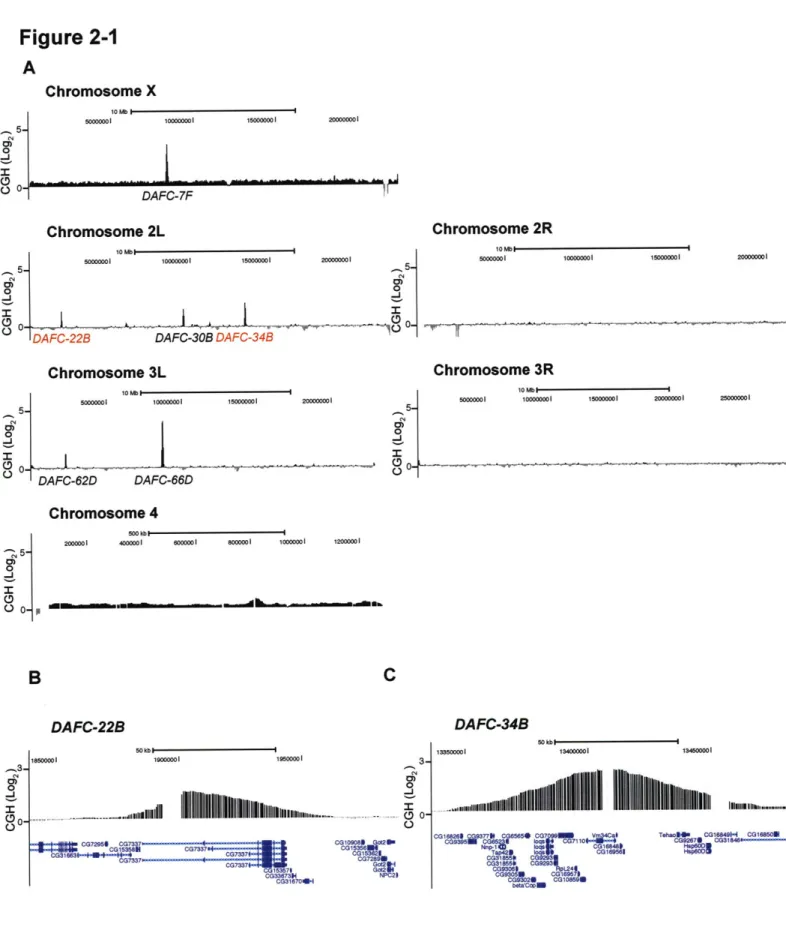
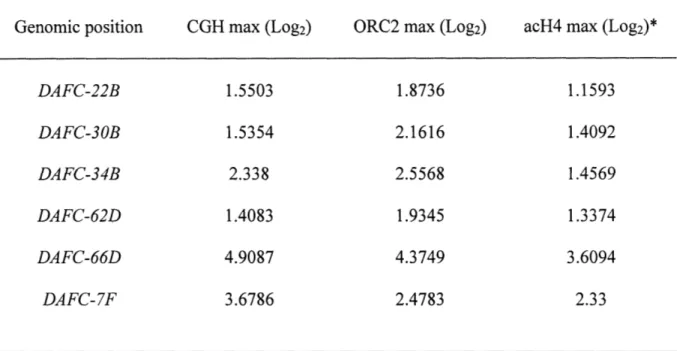
Gene amplification in Drosophila follicle cells is an excellent model to study origin specification and developmental regulation of DNA replication in vivo. We mapped all follicle cell amplicons using a comparative genomic hybridization strategy and identified two new amplicons. We determined the precise localization of the origin recognition complex (ORC) on a genome-wide level and observed that, at the start of synchronous amplification, ORC localizes to the six amplicons with levels corresponding to the magnitude of amplification. Additionally, we investigated amplification with respect to transcription and chromatin state. The levels and timing of gene expression in some amplicons suggest that gene amplification is not exclusively a developmental strategy to promote high expression levels. Follicle cell amplicons are enriched for acetylated H4, but this mark is not sufficient for ORC localization or amplification. In addition to genome-wide analyses, we characterized the two new amplicons and discovered unique properties that make both distinctive replication models. Strikingly, DAFC-22B shows strain-specificity in amplification, a property that is correlated with the ability to localize ORC. We identified sequence differences between closely related amplifying and non-amplifying strains and used P element mediated transformation to test sufficiency for ORC binding and amplification at this region. DAFC-34B contains two genes that are expressed in follicle cells.
Vm34Ca is a structural component of the vitelline membrane but is expressed prior to the onset
of gene amplification. CG16956 is expressed in amplification stages but only in a small subset of follicle cells. Like the previously characterized DAFC-62D, DAFC-34B displays origin firing at two separate stages of development. However, unlike DAFC-62D, amplification at the later stage is not transcription dependent. We mapped the DAFC-34B amplification origin to 1kb by nascent strand analysis and delineated the cis requirements for origin activity, finding that a 6 kb region, but not the 1 kb origin alone, is sufficient for amplification. We analyzed the developmental localization of ORC and the MCM complex, the replicative helicase. Intriguingly, the final round of origin activation at DAFC-34B occurs in the absence of detectable ORC, though MCMs are present, suggesting a novel initiation mechanism. Our analysis of follicle cell amplicons highlights the diversity of amplification origin control mechanisms within the same cell type, which may be representative of similar regulatory diversity during S phase DNA replication. Thesis Supervisor: Terry L. Orr-Weaver
Dedicated, with love and thankfulness, to my parents
Acknowledgements
I rotated in and joined Terry's lab in the spring of 2005 when she was away on sabbatical. It was a bold decision but one that I would make again in a heartbeat because of the kind of advisor Terry is. Terry is a brilliant scientist who has made many seminal contributions to biology. Additonally, she has poured so much of herself into the mentorship of her trainees that, even in her absence my first year (though with frequent phone meetings and regular visits), I experienced top-notch scientific guidance and overwhelmingly supportive collegiality through being a
member of the Orr-Weaver lab. Since then, I have only had more reasons to appreciate Terry: her genuine passion for science and the fairness and thoughtfulness with which she manages her lab. I know I have grown in tremendous ways scientifically, professionally, and personally because of Terry's mentorship, and for this I am deeply thankful.
I want to thank all of the members of the Orr-Weaver lab who I had the privilege of working with. They have been and continue to be wonderfully supportive and fun colleagues. Their names are too numerous to list here, but each has made lasting contributions on my scientific and personal wellbeing. I will miss being in the TOW-ZONE very much.
Steve Bell and Peter Reddien have been on my thesis committee for the past five years. They have provided valuable scientific input and practical guidance that has helped move my project forward every year. Since the beginning, I have felt that they were rooting for me to do well, and this implicit encouragement has been immensely motivating. Graham Walker is newly on my thesis committee this year, but I have admired the work of his education group since the beginning of grad school. His commitment to training scientist-educators and developing effective biology curriculum has inspired me to believe that this endeavor is a worthy one. Jeff Kapler was on sabbatical in Terry's lab during the 2008-2009 academic year from Texas A&M. He provided a lot of good advice about molecular biology experiments and how to be a well-rounded scientist. He also gave me the single best piece of advice I have ever received and reflect on it often.
Despite having a wonderful advisor and supportive lab mates, grad school has been challenging, though in the words of Randy Pausch, "Brick walls are there to show how badly we want something." My cherished friends and family have continuously kept my perspective in check and my mood cheerful. I want to thank Wendy Lam, Michelle Sander, Sudeep Agarwala, and Renuka Pandya for their friendship, which I treasure greatly. The friends I have made through MIT and MIT Biograds, Sidney Pacific, and Highrock are, blessedly, too numerous to list here, but I am grateful for them. My high school A4L, Yale girlfriends, and extended relatives have treated me like a (scientific) rock star, and their love and enthusiastic support has stood the test of time (and my scientific hermit phases). This most definitely includes thanks to my brother John for being everything a girl could ask for in an older brother.
Finally, I would like to thank my parents. They gave life to me, but through their unwavering support and love they gave me my life. I know the immigrant story of leaving everything familiar behind to pursue opportunity for one's children is not uniquely my family's, but I am profoundly thankful to be the outcome of this one story. This thesis is a testament to my parents' sacrifice,
TABLE OF CONTENTS Chapter One:
Introduction 7
Eukaryotic replication initiation proteins and cell cycle regulation 8
Replication origin discovery I1
Models from budding yeast and fission yeast 11
Identification of individual metazoan replication origins 14 Methods of replication origin discovery on a genome-wide scale 22 Developmental gene amplification as an origin discovery tool 25
Properties of metazoan replication origins 29
Sequence properties and genome distribution of replication origins 29
Replication and transcription 30
Replication and chromatin context 35
Replication timing and cell type specific replication programs 37
The importance of cataloging replication origins 39
Summary of thesis 41
References 42
Chapter Two:
Genome-wide identification of Drosophila follicle cell amplicons as
in vivo model replicons 47
Abstract 48
Introduction 49
Results 51
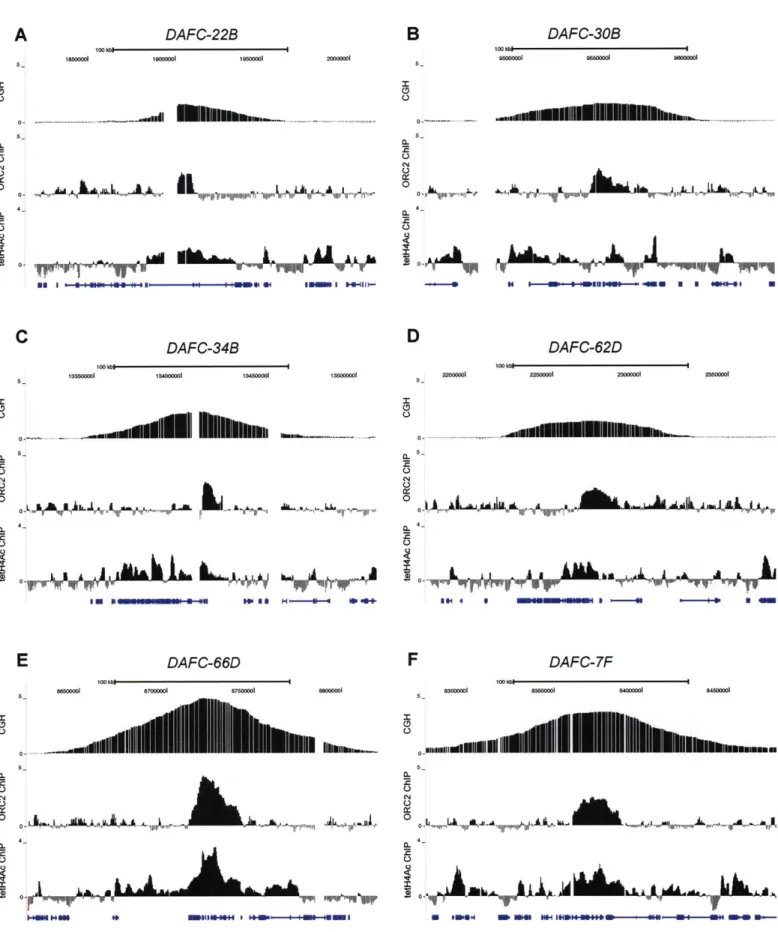
Identification of two new follicle cell amplicons by aCGH 51 Genome-wide expression analysis of follicle cells 52 ORC binding in amplicons localizes to the most amplified region 62 H4 acetylation corresponds to the magnitude of amplification 70
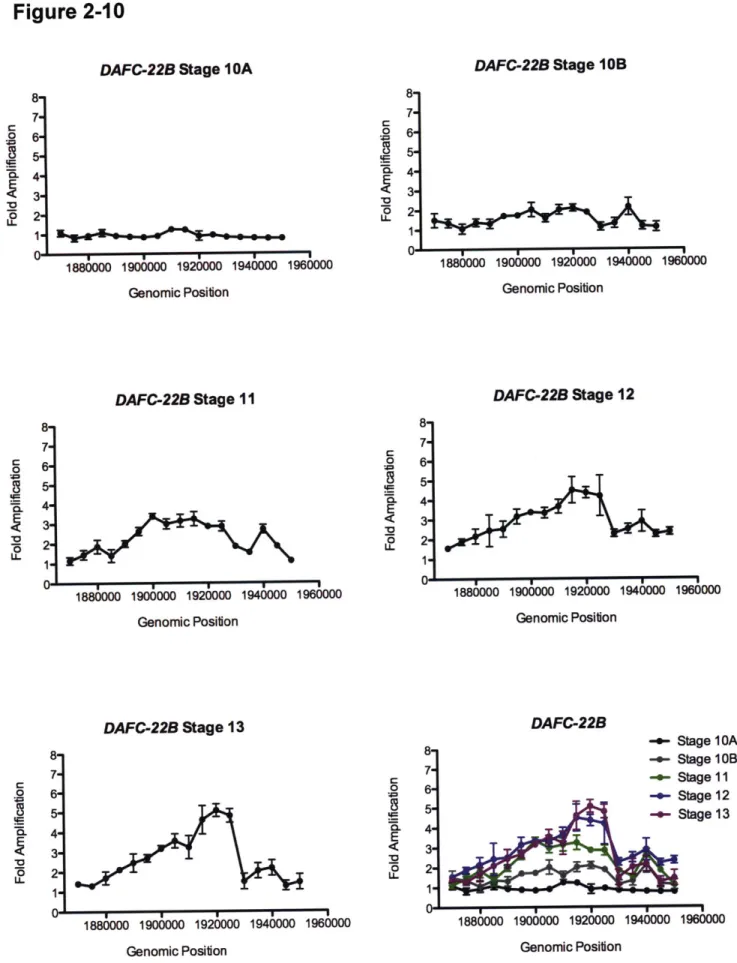
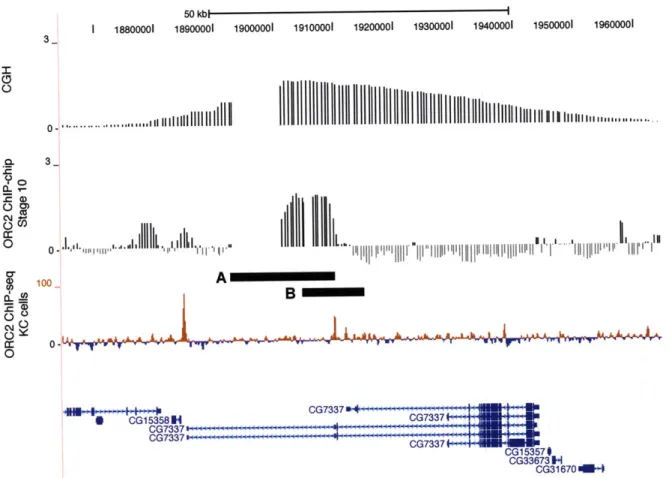
DAFC-22B exhibits strain-specific amplification 76
Mapping cis elements responsible for DAFC-22B amplification 86
Discussion 86
Materials and Methods 93
Acknowledgements 96
References 96
Chapter Three:
Differential ORC localization during two rounds of replication initiation
at a Drosophila follicle cell amplicon 99
Abstract 100
Introduction 101
Results 104
Two genes in DAFC-34B are expressed in follicle cells 104
DAFC-34B shows two distinct stages of replication initiation 107
DAFC-34B amplification origin corresponds to the Vm34Ca
Developmental control of ORC and MCM localization at DAFC-34B 116
orc mutant blocks both rounds of replication initiation at DAFC-34B 122
Delineation of cis control elements for replication at DAFC-34B 125
Discussion 128
Materials and Methods 132
Acknowledgements 135
References 135
Chapter Four:
Conclusions and Perspectives 138
Active transcription as a causal determinant of gene amplification 139
CG7337 expression and strain-specific amplification at DAFC-22B 142
Specific histone acetylation and gene amplification 143 Investigating ORC independent initiation at DAFC-34B 144 Application of Drosophila genomic resources to the study
of follicle cell gene amplification 144
References 146
Appendix One:
Strategy and preliminary results toward generation of conditional replication
factor mutants in Drosophila 147
Introduction 148
Results 148
Discussion 150
References 152
Appendix Two:
Synteny analysis of the DAFC-30B amplified region 157
Results 158
Acknowledgements 159
References 159
Appendix Three:
Chapter One:
Introduction
Complete duplication of the genome during S phase is critical for the accurate transmission of genetic material to daughter cells during the cell cycle. Two fundamental
questions related to the regulation of this genome duplication process are: (1) how are individual DNA regions selected to function as replication origins, or sites from which replication initiation occurs; and (2) how is the activation of replication origins coordinated genome-wide such that every sequence is replicated once, and only once, per cell cycle? The identification of replication origins to uncover functional properties of these genomic regions and analyze their regulatory mechanisms is key to understanding these questions. However, this task has been challenging in metazoan systems because until recently, a small number of replication origins had been
identified for molecular characterization.
This chapter focuses on the identification of metazoan replication origins and the insights into origin function that their analyses have provided: both insights from studies of individual replication origins as well as recent genome-wide studies to map replication origins using microarray and next-generation sequencing methods. The emerging picture of metazoan replication origins is one where, despite the absence of a sequence-specific motif for origin specification, cis-acting information does influence the binding of replication proteins as well as origin function. Furthermore, whether or not DNA replication initiates from a given genomic locus is a highly dynamic process subject to influence from transcriptional activity and chromatin state.
Eukaryotic replication initiation proteins and cell cycle regulation
In 1963, Jacob et al proposed the "replicon model" to explain the regulation of DNA synthesis in bacteria (JACOB and BRENNER 1963). According to this model, an initiator protein that was encoded by a structural gene would interact with a sequence-encoded genetic element
called the replicator to initiate DNA replication. Identification of the origin recognition complex, or ORC, nearly 30 years later demonstrated that a eukaryotic initiator existed (BELL and
STILLMAN 1992). However, the identification of origins in eukaryotes reveals that there is a greater diversity of origin structure than the protein complexes that promote origin activation.
ORC marks all potential sites of origin activation in eukaryotes (BELL and DUTTA 2002).
This hexameric complex binds DNA and recruits Cdc6 and Cdtl. The subsequent ATP hydrolysis activities of ORC and Cdc6 result in the stable loading of the MCM2-7 replicative helicase to DNA and poise the site for unwinding of the double-stranded helix. Together, these proteins comprise the pre-replicative complex (pre-RC), and formation of these complexes establishes origin licensing, or competence for DNA synthesis. Though identified primarily in yeast, the components of the RC have been identified in all eukaryotes examined. The pre-RC is activated to form the pre-initiation complex (pre-IC), whose components in yeast include Cdc45, GINS, Sld2, Sld3, Dpbl 1, and Mcm10. The mechanism of this activation process is an area of active investigation, but a key event is the Dbf4-dependent kinase, or DDK, dependent
phosphorylation of MCM subunits (WALTER and ARAKI 2006). Additionally, CDK-dependent
phosphorylation of Sld2 and Sld3 leads to activation of the pre-IC and recruitment of DNA
polymerases to initiate DNA synthesis (TANAKA et al. 2007; ZEGERMAN and DIFFLEY 2007).
Activation of the pre-RC (and the initiation of DNA synthesis) is often referred to as origin firing and will be used interchangeably with origin activation in this text (see Table 1-1 for replication terminology).
To ensure that origin activation occurs once and only once per cell cycle, the process of pre-RC formation is tightly regulated. Across diverse eukaryotic organisms, a general strategy is to separate the origin licensing and origin activation stages in the cell cycle. Origin licensing
Table 1-1. Replication terminology.
Term Definition Reference
Initiator Initiation site (replication origin) Origin activation (origin firing) Origin efficiency Replicator Replicon Spatial replication program Temporal replication program
Protein or protein complex that binds replicators and are required for replication initiation (term first proposed in replicon model)
Location on DNA from which replication forks emanate
Activation of the pre-RC and the initiation of DNA synthesis
Percentage of cells that activate a particular replication origin every cell cycle
Genetic element that is required for replication initiation from a particular chromosomal location (term first proposed in replicon model)
Region of DNA that is duplicated by a replication origin
The physical distribution of all replication origins used to replicate the genome
The timing with which all replication origins are activated to replicate the genome
(JACOB and
BRENNER 1963)
(JACOB and
occurs during GI phase when CDK activity is low, whereas origin activation occurs when CDK activity is high. Additionally, cells use redundant mechanisms to prevent pre-RC assembly outside of G1 including targeted protein synthesis of pre-RC components during G1 and
inactivation of these proteins following replication initiation via protein degradation and nuclear export (ARIAs and WALTER 2007). Although the specific combination of strategies differs depending on the organism, one mechanism common to metazoans is the activity of the protein
Geminin (BELL and DUTTA 2002; MELIXETIAN and HELIN 2004). Geminin binds to Cdtl and
inhibits its function, thus adding another layer of regulation to prevent origin licensing outside of G1 phase. Overexpression of Cdtl has been shown to cause re-replication in multiple cell
systems (THOMER et al. 2004; YANOW et al. 2001; ZHONG et al. 2003), thus highlighting the
importance of limiting Cdtl activity to prevent re-replication and maintain genomic stability.
Replication origin discovery
Models from budding yeast and fission yeast
To identify cis-acting origins of replication in yeast, a strategy from bacteria was adapted to isolate sequences that would support autonomous replication in a host cell. The autonomously replicating sequence (ARS) assay was successfully implemented in budding yeast and fission yeast to identify sequences that conferred origin function both in the context of a plasmid as well
as the native chromosomal locus (ALADJEM et al. 2006; STINCHCOMB et al. 1980). In budding
yeast, these sequences are approximately 125 base pairs in length. Compilation of these
sequences led to the identification of an 1 lbp ARS consensus sequence (ACS) that is required, though not sufficient, for ORC binding. Molecular dissection of a number of budding yeast origins reveals a modular structure, with different conserved elements that stabilize ORC binding
Figure 1-1. Examples of replication origins from diverse eukaryotes.
(A) Budding yeast ARS] is a well-defined replication origin. ORC binds to the 11 bp ACS (and the B 1 element). The origin of bidirectional replication has been precisely identified by replication initiation point (RIP) mapping immediately downstream of the ORC binding site. Collectively, the B elements are essential for origin activity, but their number, type, and position are variable among budding yeast origins.
(B) Fission yeast ars2004 is approximately 1 kb in length and contains three asymmetric AT-rich sequences (blue boxes) that are required for origin activity.
(C) The DHFR locus in Chinese hamster ovary cells is an example of a broad initiation zone. Replication initiates in the 55 kb intergenic regions between the DHFR and 2BE212 genes. Replication initiation occurs most frequently from the three sites designated with triangles.
(D) The human
p-globin
locus is an example of a confined replication site. Replication initiates efficiently from a region <10 kb spanning thep-globin
gene.(E) The chorion amplicon DAFC-66D is an example of a confined replication site. The amplification enhancer A CE3 and primary origin Orip3 are both necessary and sufficient for amplification.
Figure 1-1
A. Budding yeast
ARS1
ORC 1 ObpB
InitiationB. Fission yeast
ars2004
100bp
ORC Initiation ORC
C. Chinese hamster
DHFR locus
10kb DHFR A&2BE2121 0' Y - w w w MW" w 4w 4w Mw InitiationD. Human
-globin locus
10kbE. Fruitfly
Initiation
Chorion amplicon DAFC-66D
1 kb
1ACE3cp 18 PRM pc19pI Snw
Orio Initiation (80%)
In fission yeast, the ARS assay identified origin sequences approximately 1 kb in length. Although a consensus sequence could not be computationally extracted, fission yeast origins were found to display an extended asymmetric AT-rich sequence, and several discrete regions within individual origins have been shown to influence ORC binding and origin activation. For example, ars2004 contains three different required regions, but they can also be replaced with 40 base pair poly(dA/dT) fragments to restore origin activity (OKUNo et al. 1997) (Figure 1-1B).
Identification of individual metazoan replication origins
When applied to metazoans systems, the ARS assay was unsuccessful in systematically identifying specific replication origins (GILBERT and COHEN 1989; MASUKATA et al. 1993). It appeared that many sequences could support autonomous replication in this assay (KRYSAN and CALOS 1991). Additional experiments determined that circular DNA could bind ORC and replicate in mammalian cell culture without any sequence specificity (KRYSAN et al. 1993;
SCHAARSCHMIDT et al. 2004). These results were consistent with experiments using Xenopus eggs, where any injected sequence could be fully replicated (HARLAND and LASKEY 1980). Although these results discredited the existence of a universal sequence-specific replicator in metazoans, investigators acknowledged that because the early embryo displayed a very high
density of origin firing to accommodate the rapid cell division cycles, this could be a specialized case where specific origins are not used.
The discovery of site-specific replication initiation in mammalian cells (described below) demonstrated that non-random origin selection could be utilized during DNA replication. The
identification of additional metazoan origins to survey the extent of site-specific initiation would rely on developing experimental methods to look for replication origins in well-delineated genomic regions. Approximately 20 metazoan replication origins have been identified and
studied using multiple methods (ALADJEM et al. 2006). In the next section, two select examples are described to illustrate the principles of origin discovery and analysis. In addition, they represent two classes of replication origins: broad replication zones that contain multiple infrequent initiation sites and confined replication sites from which initiation events occur at a high frequency.
The first mammalian origin identified was the dihydrofolate reductase (DHFR) locus in
Chinese hamster ovary (CHO) cells (HEINTZ and HAMLIN 1982) (Figure 1-IC). Its discovery and
subsequent analysis was facilitated by several experimentally advantageous characteristics of the cell line. This genomic region becomes amplified in the presence of increasing concentrations of the competitive inhibitor methotrexate, allowing cell lines containing an approximate 800-fold amplification of the 240 kb region encompassing the DHFR gene to be isolated (MILBRANDT et
al. 1981). The high copy number of the amplified sequence could be visualized as distinct
restriction fragments against the background of single copy genomic DNA on an agarose gel. This property, combined with the ability to arrest these cells in a GO state and track resumption of the cell cycle through the Gl/S boundary in the presence of radiolabeled nucleotide, meant that the earliest-replicating restriction fragments could be visualized and positionally mapped
(HEINTZ and HAMLIN 1982).
The discovery of the DHFR locus replication origin is representative of a general strategy to identify newly replicated DNA molecules by their increased abundance compared to non-replicated DNA. Because many researchers used this locus to study gene regulation, gene and restriction maps of the region were available. Since its discovery the DHFR locus has been the subject of many studies aimed at finely mapping the position of the multiple origins in this region. The storied history and often-conflicting results related to this locus are described in a
recent review (HAMLIN et al. 2010). The current understanding is that the DHFR locus is a broad replication initiation zone where replication initiates infrequently from one of several origins.
The identification of the human
p-globin
locus origin also was facilitated by being a well-studied gene region (Figure 1-ID). Newly synthesized leading strand DNA was isolated by pulse-labeling cells with the nucleotide analog bromodeoxyuridine (BrdU) in the presence of emetine, which inhibits lagging strand synthesis, and then recovering single-stranded DNA fractions that were enriched for BrdU incorporation (KITSBERG et al. 1993). These samples were slotted onto filters and hybridized with strand specific probes across a 200 kb region. Replication direction could be inferred by determining whether hybridization was more abundant using the plus or minus template probe. Likewise, the replication origin could be identified as the site of tail-to-tail DNA synthesis or the junction at which leading strand DNA was on oppositetemplates. This example is representative of a general strategy to identify origins by determining the transition point at which leading and lagging strands switch templates (HAMLIN et al. 2010)
(Figure 1-2C). The spacing of the probes allowed the human P-globin origin to be positioned to within a 10 kb, well-defined fragment. Thus, the human
p-globin
locus is an example of a confined replication site from which replication initiation occurs from a predominant site.The origin sequence from the human
p-globin
locus could be moved to an ectopic site and still confer origin activity, the first such demonstration in a mammalian system (ALADJEM etal. 1998). The initiation activity at the human
p-globin
locus requires a region 40 kb upstreamcalled the locus control region (LCR). Although origin function requires the LCR at the native locus, initiation could be observed at ectopic sites without the LCR. This result suggests that distal cis regulatory sequences can influence replication initiation, but their functions can be
Figure 1-2. DNA structures at a replication origin.
(A) ORC marks all potential sites of origin activation in eukaryotes. ORC-bound sites can be identified by chromatin immunoprecipitation followed by competitive or quantitative PCR (ChIP-qPCR), hybridization to a microarray (ChIP-chip), or high-throughput sequencing (ChIP-seq).
(B) Replication bubbles are found at origins due to the melting of double stranded DNA and initiation of DNA synthesis. Replication bubbles can be identified by 2-D gel mapping techniques or the "bubble-trap method" (see text for details).
(C) Replication origins correspond to the junction where leading and lagging strands switch templates. Initial identification of the replication origin at the human
p-globin
locus relied on this property.(D) Newly replicated DNA can be isolated by pulse labeling cells with the nucleotide analog BrdU, followed by anti-BrdU immunoprecipitation. BrdU-IP DNA can be identified by competitive or quantitative PCR, hybridization to a microarray, or high-throughput sequencing (e.g. Repli-seq).
(E) Short nascent strands can be isolated by size fractionation on a sucrose gradient or low melting agarose gel. An additional -exonuclease treatment step removes nicked DNA that lacks a 5' RNA primer and is unprotected from digestion. Short nascent strands can be identified by competitive or quantitative PCR, hybridization to a microarray, or high-throughput sequencing (the last method has not been reported but is technically feasible.
Figure 1-2
A.
ORCbound DNA
B.
Replication bubbles
C. Junction where leading
and lagging strands
switch templates
ORC
anti-BrdU
immunoprecipitated DNA
E. Short nascent strands
(resistant to X-exonuclease
digestion)
Leading strand
...
-... ... ... ... . ... ... ... ... I ... ... .
substituted, presumably with sequences that display similar properties, the nature of which are not well-understood.
A powerful approach developed to analyze replication origins on an individual level was two-dimensional (2-D) mapping (FANGMAN and BREWER 1991). Though developed to study ARS function in budding yeast, these methods were adapted to study replication origins in metazoans. Neutral-alkaline 2-D gels are used to map origins based on nascent strand sizes
(HUBERMAN et al. 1987) (Figure 1-3A) whereas neutral-neutral 2-D gels map origins by branch topology (BREWER and FANGMAN 1987) (Figure 1-3B). An additional advantage of these methods is that origin efficiency, the percentage of cells within a population that activates initiation from a particular site, can be roughly determined. For example, depending on the intensity of the bubble arc compared to the Y arc in a neutral-neutral 2-D gel, one can infer the proportion of cells in which a particular origin is active (Figure 1-3B). Using 2-D analysis, the discrete origins in the DHFR locus were found to fire with low efficiency (MESNER et al. 2003).
2-D gel mapping techniques have been considered the gold standard in precisely mapping replication origins, but their use has technical limitations. Replication bubble structures are
scarce in a population of asynchronous cells, making their detection difficult unless the origin is very efficient or the cell population is synchronized, not a trivial task in metazoan cell culture. Furthermore, they require the investigator to know what genomic region to assess. Prior to the availability of complete genome sequences, origin identification relied on the existence of well-delineated gene regions to assess, for example, where nascent DNA molecules or replication bubbles were positioned. Thus, most of the identified origins were in regions that were well
Figure 1-3. Experimental methods to identify replication origins.
(A) Neutral-alkaline 2-D gels are used to map origins based on nascent strand sizes. The axes indicate the order of electrophoresis. The 2X position marks the spot of nearly
completely replicated DNA. The high molecular weight of this structure makes it the slowest migrating (farthest to the left). When the second dimension is run using an alkaline gel, the nascent strands separate but have a large molecular weight, nearly identical to the parental strand.
(B) Neutral-neutral 2-D gels map origins by branch topology. The axes indicate the order of electrophoresis. DNA containing a replication origin exhibits the pattern of the bubble arc. When the second dimension is run using a neutral gel, origin centered DNA that has replicated the most is also impeded the most in the gel, due to its large bubble topology. DNA that is passively replicated by an adjacent origin exhibits the pattern of a Y arc. (C) Repli-Seq is a variation of BrdU immunoprecipitation coupled to the precise partitioning
of cells into sample groups based on flow cytometry-measured cell cycle stage. Each of these BrdU-IP samples is then subject to high-throughput sequencing, and the data is assembled into mapped sequence reads throughout S phase for any genomic region. The position of an early firing origin can be inferred through the inverted V shape of the mapped sequence tags. Adapted from (HANSEN et al. 2010)
Figure 1-3
A. Neutral-alkaline 2-D gel analysis
Restriction site - Probe Restriction site
Replication bubbles
First
2X 1x
B. Neutral-neutral 2-D gel analysis
... First Bubble
2X
8 1 x
C. Repli-Seq
BrdU pulse in vivo
Sort cells into S phase
samples by FACS
IP BrdU-DNA
Gem r2, N4..oun I I U -... I I OX5++444 C12s084 4NMLTh OCATI4 4LVWM LRg OUKRAS GIearly
TwgSequence
late 82 S4 G2 -aII ... . ... ... NOW Trmetazoan origins located in so-called gene deserts, extended regions of DNA without any known genes.
Methods of replication origin discovery on a genome-wide scale
Though the DHFR and human
p-globin
locus replication origin regions were first identified using the methods described above, these origins have been subject to many experimental analyses to further characterize their replication properties as well as refine the strategy of identifying new origins. One general approach is to isolate newly replicated DNA strands and then determine to what genomic regions they map. The DNA isolation isaccomplished through primarily one of two methods. The first is to isolate nascent DNA of a particular size, typically in the range of 0.5-2 kb, through a sucrose gradient or on an agarose gel. An additional -exonuclease treatment removes background generated from broken DNA
fragments, as this enzyme will degrade DNA fragments not protected by a 5' RNA primer (designated short nascent strands) (Figure 1-2E). The second method to isolate is to pulse label cells with the nucleotide analog bromodeoxyuridine (BrdU) and immunoprecipitate newly synthesized DNA with an anti-BrdU antibody (designated BrdU-IP DNA) (Figure 1-2D). To determine the identity or enrichment of these molecules in the era before complete genome sequences required the investigator to probe a specific genomic region either by hybridization to positionally mapped DNA clones or quantitative PCR. However, the availability of complete genome sequences allows these short nascent strands and BrdU-IP DNA to be identified using microarrays or high-throughput sequencing.
Repli-Seq is a variation of BrdU immunoprecipitation coupled to the precise partitioning of cells into sample groups based on flow cytometry-measured cell cycle stage (HANSEN et al.
2010). Each of these BrdU-IP samples is then subject to high-throughput sequencing, and the data is assembled into mapped sequence reads throughout S phase for any genomic region. Data generated from this method is shown in Figure 1-3C. Early initiating origins can be inferred through the inverted V shape of newly synthesized DNA.
The Hamlin lab developed a method to identify origins that also uses the general
principle of isolating newly replicating DNA and then identifying these molecules on a genome-wide scale. The first step exploits the property of circular DNA molecules, including replication bubbles, to be trapped in the agarose-plugged well following electrophoresis (MESNER et al. 2006) (Figure 1-2B). This DNA can be cloned into a genomic library and identified using microarrays or sequencing. Although the methodology is published, the microarray results to identify these replication origins is only referenced as submitted material in a published review article and thus will not be discussed (HAMLIN et al. 2010).
The final method to map replication origins is the genome-wide localization of ORC by chromatin immunoprecipitation followed by hybridization to a microarray (ChIP-chip) (WYRICK
et al. 2001) or high throughput sequencing (ChIP-seq). Because ORC marks all potential sites of
replication initiation, identifying genome-wide ORC localization serves as a proxy for uncovering all potential replication origins (Figure 1-2A).
The analyses of short nascent strands, BrdU-immunoprecipitated nascent DNA, Repli-Seq, and ORC ChIP to identify replication origins has resulted in a dramatic increase in the number of origins experimentally identified (summarized in Table 1-2). In some cases, such as the identification of replication origins in human cells (HeLa), there was not significant overlap among the origin datasets, suggesting that the different methods selectively identify a subset of all origins. Nevertheless, these studies represent one to two orders of magnitude increase in the
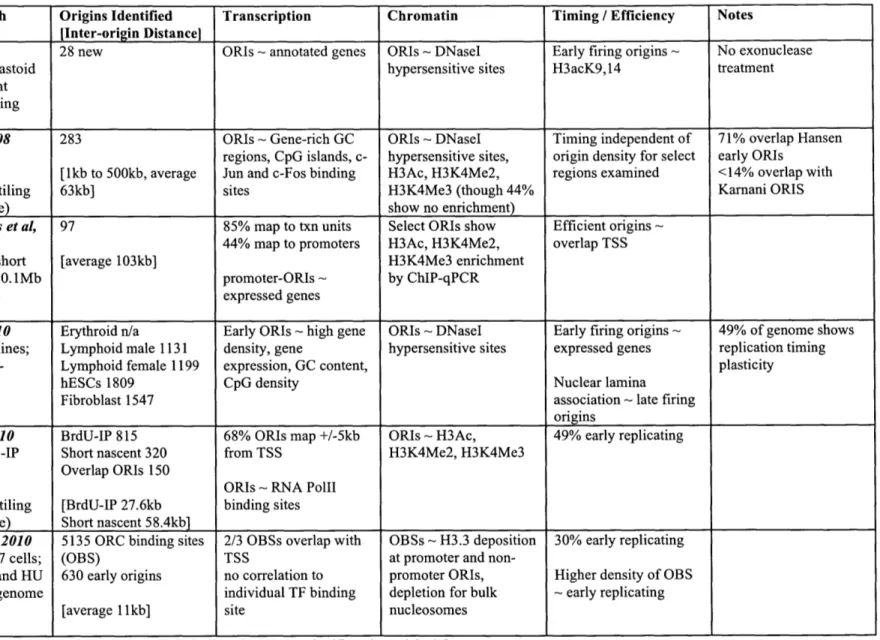
Table 1-2. Genome-wide approaches to metazoan origin identification.
Study / Approach Origins Identified Transcription Chromatin Timing / Efficiency Notes
[Inter-origin Distance]
Lucas et al, 2007 28 new ORIs ~ annotated genes ORIs ~ DNaseI Early firing origins ~ No exonuclease
Human lymphoblastoid hypersensitive sites H3acK9,14 treatment
cells; short nascent strands; 1.4Mb tiling
array
Cadoret et al, 2008 283 ORIs ~ Gene-rich GC ORIs - DNaseI Timing independent of 71% overlap Hansen
HeLa cells; short regions, CpG islands, c- hypersensitive sites, origin density for select early ORIs
nascent strands; [1kb to 500kb, average Jun and c-Fos binding H3Ac, H3K4Me2, regions examined <14% overlap with
ENCODE 30Mb tiling 63kb] sites H3K4Me3 (though 44% Karnani ORIS
array (1% genome) show no enrichment)
Sequeira-Mendes et al, 97 85% map to txn units Select ORIs show Efficient origins ~
2009 44% map to promoters H3Ac, H3K4Me2, overlap TSS
Mouse ES cells; short [average 103kb] H3K4Me3 enrichment
nascent strands; 10.1Mb promoter-ORIs ~ by ChIP-qPCR
tiling array (0.4% expressed genes
genome)
Hansen et al, 2010 Erythroid n/a Early ORIs ~ high gene ORIs - DNaseI Early firing origins ~ 49% of genome shows Four human cell lines; Lymphoid male 1131 density, gene hypersensitive sites expressed genes replication timing
Repli-Seq; whole- Lymphoid female 1199 expression, GC content, plasticity
genome coverage hESCs 1809 CpG density Nuclear lamina
Fibroblast 1547 association - late firing
origins
Karnani et al, 2010 BrdU-IP 815 68% ORIs map +/-5kb ORIs ~ H3Ac, 49% early replicating
HeLa cells; BrdU-IP Short nascent 320 from TSS H3K4Me2, H3K4Me3
and short nascent Overlap ORIs 150
strands; ORIs ~ RNA PolIl
ENCODE 30Mb tiling [BrdU-IP 27.6kb binding sites array (1% genome) Short nascent 58.4kb]
MacAlpine et al, 2010 5135 ORC binding sites 2/3 OBSs overlap with OBSs - H3.3 deposition 30% early replicating
Drosophila Kc167 cells; (OBS) TSS at promoter and
non-ORC ChIP-chip and HU 630 early origins no correlation to promoter ORIs, Higher density of OBS
BrdU-IP; whole genome individual TF binding depletion for bulk ~ early replicating
tiling arrays [average 11kb] site nucleosomes
number of previously known metazoan replication origins and provide valuable datasets with which to compare replication origins to genomic features such as transcription and chromatin modifications (discussed below).
Developmental gene amplification as an origin discovery tool
Developmental gene amplification has served as an important origin discovery tool and model for investigating the regulation of metazoan replication origins. Specific genomic regions are amplified through replication-based mechanisms, either chromosomal excision followed by extra-chromosomal amplification or repeated bidirectional replication from an endogenous chromosomal locus, to increase gene copy number. Mapping of these amplification origins has
added to the catalog of known metazoan replication origins (CLAYCOMB and ORR-WEAVER
2005). Developmental gene amplification increases the DNA template to allow for sufficient levels of gene products required at high levels in a short developmental period, such as rRNA in frog ooctyes and cocoon proteins in Sciarid fly salivary glands.
In Drosophila, two chorion gene clusters are amplified in ovarian follicle cells, somatic epithelial cells that surround the ooctye and secrete the components of the eggshell, by repeated origin activation at the endogenous locus (see Figure 1-4A and 1-4B for developmental context). This process enables the eggshell proteins to be produced and the eggshell structure to be
constructed in less than five hours. Importantly for its use as a replication model, gene
amplification uses the same replication machinery and cell cycle kinase regulation that is used in the canonical S phase. Several female-sterile mutants have been isolated that produce a thin eggshell phenotype due to the inadequate transcription of eggshell genes, and these mutants have been found to contain mutations in replication factors such as Orc2, Mcm6, and Dbf4/chiffon
Figure 1-4. Gene amplification in Drosophila follicle cells as a model to study metazoan DNA replication.
(A) Gene amplification occurs in the context of egg chamber development and maturation. Drosophila ovaries are made of multiple ovarioles, or strings of developing egg
chambers.
(B) Adapted from (SPRADLING 1993). DAPI staining of egg chambers. Distinct egg chamber stages can be visually distinguished by the egg chamber size, proportion of nurse cell volume compared to the oocyte volume, and size and shape of the anterior dorsal filaments.
(C) Schematic of gene amplification. Initiation is the repeated rounds of origin firing,
resulting in an amplified region. Elongation is the replication of existing replication forks such that there is no increase in DNA copy number at the origin but an increase in the flanking regions.
(D) The process of gene amplification can be visualized using immunofluorescence
experiments, monitoring the incorporation of a nucleotide analog. Fluorescence in situ hybridization (FISH) using a genomic probe marks a specific site of amplification.
Figure 1-4
A. Drosophila ovaries
ovariole
C. Schematic of gene amplification
Initiation
Elongation
B. Egg chamber stages
stlOA-B stl1 stl2 stl3
D. Visualizing gene amplification
DAPI
EdU
Genomic FISH probe
At the major chorion amplicon, Drosophila Amplicon in Follicle Cells (DAFC)-66D, the cis requirements for amplification have been finely mapped (Figure 1-1E). DAFC-66D is an
example of a confined replication site. The majority of initiation events as determined by 2-D gel mapping has been narrowed down to the 884 base pair element Orip located in the intergenic region between two chorion genes. Additionally a 320 base pair enhancer element, Amplification
Control Element on the Third (A CE3), is required for amplification and has been shown to bind
ORC in vivo, though it itself does not serve as a replication origin in the endogenous locus
(CLAYCOMB and ORR-WEAVER 2005). ACE3 is proposed to serve as a nucleation point for ORC
binding, possibly by permitting a chromatin environment where pre-RCs can assemble. In
support of this model, multimers of ACE3 are capable of autonomously inducing amplification at ectopic sites in the genome, although at lower levels than the endogenous locus (CARMINATI et
al. 1992).
Another advantage of studying replication using follicle cell amplicons is that they permit
in vivo study of replication timing. Replication events during gene amplification can be precisely
examined because the process occurs after genomic replication is shut off in development. Developing egg chamber stages are morphologically distinct and can be isolated and analyzed using methods such as Southern blotting, quantitative PCR, and protein localization by
immunofluorescence and chromatin immunoprecipitation. For DAFC-66D, replication initiation events occur exclusively in stages 10 B and 11, which is followed by a period when only
replication elongation occurs in stages 12 and 13 (CLAYCOMB et al. 2002) (See Figure 1-4C for schematic representations of initiation and elongation). The absence of initiation events in these later stages allows the elongating replication forks to be visualized as double bar structures in immunofluorescence experiments, monitoring the incorporation of BrdU. In contrast, at another
amplicon DAFC-62D, there are two stages of replication initiation: one in stage 10B, followed by a second round of replication initiation in stage 13 (XIE and ORR-WEAVER 2008). Thus, follicle cell gene amplification provides a unique opportunity to study replication events during development.
Properties of metazoan replication origins
Sequence properties and genome distribution of replication origins
Early radiography studies revealed that DNA replication initiates from hundreds to
thousands of sites in the genome (HUBERMAN and RIGGS 1968; TAYLOR 1968), and more
recently, genome-wide studies have shown that cells utilize distinct spatial replication programs. Origin distribution is quite variable, though the average is similar to previously determined estimates of replicon size (approximately 50 kb). Inter-origin distance can range from 1 to 500 kb, with sparse origin distribution in gene poor regions. Origin density is strongly correlated with gene density and the related measure of high GC content (CADORET et al. 2008). This correlation of origin density to high GC content appears to result from replication origins frequently
overlapping with transcription units (discussed below). At the level of individual origins, Karnani et al found that in human cells there was an enrichment of AT sequences in the region
100 base pairs to each side of the replication peak, consistent with previous analyses of individual metazoan origins (KARNANI et al. 2010).
A study in Drosophila cells found that, although there was no simple consensus motif for ORC binding, machine learning approaches could be applied to discriminate between ORC-bound and non ORC-ORC-bound sequences (MACALPINE et al. 2010), suggesting that sequence likely plays some indirect role in promoting or permitting ORC binding. For example, it appears that DNA topology is an important determinant of ORC binding in vitro, as ORC binds preferentially
to superhelical DNA without sequence specificity (REMUS et al. 2004), and the short sequences found to be enriched in the MacAlpine study may promote this DNA structure.
Two studies examined whether replication origins mapped to evolutionary conserved regions (CR), and both observed significant enrichment (CADORET et al. 2008; KARNANI et al.
2010). Karnani et al observed that 50% of their identified origins overlapped with conserved elements defined by the Encyclopedia of DNA Elements (ENCODE) consortium of
investigators. Cadoret et al found that 70% of their identified origins overlapped with CR's, lower than the overlap of protein coding exons with CR's (86%) but comparable to promoter regions (72%). It is unclear how much of this evolutionary constraint is due primarily to the replication, transcription, and/or epigenetic functions of these conserved sequences, though each is likely to contribute to the observed conservation.
Replication and transcription
The relationship between replication initiation and transcription is an area of active investigation, and examples from many systems show both negative and positive effects of transcription on replication. Because DNA replication and RNA transcription share the same template, one possibility is that transcriptional elongation poses a steric inhibition on possible
origin licensing or activation. In the DHFR locus, replication initiation normally occurs from one of several potential sites in the 50 kb intergenic spacer between the DHFR gene and the
downstream 2BE2121 gene. When transcription is extended into the non-transcribed spacer via deletion of 3' processing signals, replication initiation is suppressed in the intergenic region and confined to the region immediately adjacent to 2BE2121 (MESNER and HAMLIN 2005). In
contrast, when the DHFR promoter is deleted, initiation events can be detected within the DHFR gene, though with lower overall efficiency throughout the region (KALEJTA et al. 1998).
There are also several specific examples of a positive relationship of transcription of replication initiation. In some cases, transcriptional regulatory elements are necessary for
replication initiation. The LCR in the human
P-globin
locus and transcription factor binding sites in the c-myc locus play important roles in promoting replication initiation (ALADJEM et al. 1995; Liu et al. 2003). In a more direct example, pre-loading transcription factors onto DNA resulted in site-specific replication in Xenopus eggs (DANIS et al. 2004). Histone modificationsassociated with open and active chromatin, specifically acetylated H3, were localized to this region and are likely to contribute more directly to origin firing than transcription factor binding itself (replication and histone modifications discussed below).
Despite the diverse methods, one of the most striking findings of recent genome-wide mapping studies was the significant number of origins that corresponded to gene regions and in particular, the transcription start sites (TSS) of active genes. Although examples of replication origins coinciding with transcription units or promoters such as the human myc locus and human lamin B2 locus were previously known, it was unclear how representative these individual examples were of all replication origins. In mouse ES cells, 85% of origins map to transcription units and 44% specifically to promoter regions (SEQUEIRA-MENDES et al. 2009). In comparison to all promoters, these promoter origins were significantly enriched in cap analysis gene
expression (CAGE) tags, which mark the 5' end of mRNAs, derived from early embryos. This result suggests that origins correspond to actively transcribed promoters. Furthermore, the promoter-associated origins were found to be the most efficient as assessed by abundance of nascent strands quantified using qPCR (SEQUEIRA-MENDES et al. 2009). The mouse ES cell results are very consistent with work from human cells, where 68% of origins were located 5 kb up or downstream of a TSS. In addition, origins were significantly enriched near sites of RNAPII
binding (KARNANI et al. 2010). Furthermore, in Drosophila cell culture, two-thirds of ORC binding sites were found to overlap with TSS's, primarily at actively transcribed genes
(MAcALPINE et al. 2010).
The co-localization of replication origins with actively transcribed promoters raises the possibility that specific transcription factors contribute to origin function at many initiation sites.
Cadoret et al found that replication origins in human cells were significantly enriched in binding sites for c-JUN and c-FOS (CADORET et al. 2008), which together form the AP-I complex and regulate a variety of cellular processes such as proliferation, differentiation, and apoptosis. The c-Myc protein has been shown to bind to its own promoter, and mutations in this sequence
abolish replication in a plasmid replication assay (ARIGA and IGUCHI-ARIGA 1989). However,
Cadoret et al found no significant enrichment of c-Myc binding sites in origins identified in their study (CADORET and PRIOLEAU 2010), and it is possible that a direct role of this protein in replication initiation is limited to the c-Myc locus or a small subset of replication origins. With over 5000 ORC binding sites to query, MacAlpine et al reasoned they would observe conserved transcription factor binding motifs, or enrichment of specific functional gene categories, if a select group of transcription factors were responsible for ORC localization (MAcALPINE et al. 2010). However, they did not observe either of these possibilities, suggesting that specific transcription factors are not generally responsible for origin specification. Instead, specific transcription factors may regulate replication at a small subset of origins.
Studies using Drosophila follicle cell gene amplification as a model system have revealed a direct role of transcription factors on DNA replication initiation. The chorion amplicon
DAFC-66D is regulated by the E2F, Myb, and Rb complexes (BEALL et al. 2004; Bosco et al. 2001).
inappropriate genomic replication during amplification stages (Bosco et al. 2001). This result supports a model where E2F1/Rb directly represses replication at DAFC-66D, which is
independent of transcriptional regulation, until the appropriate developmental time when Rb is phosphorylated and E2F 1 can positively influence amplification. These complexes have been localized to the amplicon by chromatin immunoprecipitation and shown to physically interact with ORC. An interaction between Rb and replication initation sites has been reported in mammalians cells with Rb localizing to initiation sites after DNA damage to repress replication (AvNI et al. 2003). There is also evidence that the insect molting hormone ecdsyone regulates amplification as dominant negative mutants of the ecdysone receptor (EcR) display reduced amplification (HACKNEY et al. 2007). These results are consistent with gene amplification in the salivary gland of Sciara coprophila, where ecdysone treatment can induce premature
amplification (FOULK et al. 2006). This study also demonstrated that ScEcR binds this amplification origin in vitro at a putative ecdysone response element.
Analysis of the follicle cell amplicon DAFC-62D has revealed a relationship between transcription and MCM loading. DAFC-62D exhibits two separate stages of replication initiation, with a period of elongation in between. By culturing egg chambers in the presence of the drug c-amanitin, which inhibits RNA polymerase II dependent transcription, the second round of
replication initiation was specifically inhibited (XIE and ORR-WEAVER 2008). Transcription inhibition had no effect on ORC localization but specifically inhibited MCM loading at this second stage of initiation. A direct physical interaction between RNAPII and the MCM complex has been reported in yeast raising the possibility that the transcriptional machinery may also function to promote MCM loading at some replication origins (GAUTHIER et al. 2002; HOLLAND
Up to one-third of origins are not associated with known promoters (KARNANI et al. 2010; MAcALPINE et al. 2010), indicating that there are other mechanisms of origin specification that do not involve transcription. Indeed, if replication could only initiate from the site of active transcription, gene-desert regions would be in serious risk of not being fully replicated every cell cycle. Conversely, not all active promoters correspond to replication initiation sites. It remains to be seen what properties permit ORC to bind to active promoter sequences and function as
replication origins, though open and active chromatin is one good candidate (discussed below). Furthermore, one advantage of having DNA replication and transcription initiation occur from the same location is that this configuration minimizes the likelihood of head-to-head collisions of the replication and transcription machineries and disruption of both processes. Gene distribution studies in bacteria have revealed that 90% of essential genes in B. subtilis and 70% of essential genes in E. coli are oriented so that DNA replication and transcription are co-directional (MIRKIN and MIRKIN 2005). It is possible that potentially deleterious consequences of head-on polymerase collisions are reduced by gene orientation in bacteria, where there is just one replication origin. In the larger genomes of higher eukaryotes, the coincidence of replication and transcription start sites may prevent polymerase collision immediately at the initiation site and enable flexibility of spatial replication programs depending on the developmental stage and cell type.
In contrast to metazoans, DNA replication initiation sites are located primarily in
intergenic regions in budding and fission yeast (RAGHURAMAN et al. 2001; SEGURADO et al.
2003). Additionally, a comparative study of replication origins in Saccharomyces yeast species revealed a significant enrichment of replication origins between convergent transcription units, and when located between tandem transcription units, the replication origin was observed closer to the transcriptional terminator than the promoter (NIEDUSZYNSKI et al. 2006). One possible
explanation for this difference from metazoan replication origins is that the well-defined nature of ORC binding in yeast may constrain origin positioning, whereas multicellular organisms require greater flexibility in origin usage and thus have replication origins and active promoters overlap to coordinate replication and transcription.
Replication and chromatin context
DNA replication occurs in the context of chromatin, the combination of DNA and
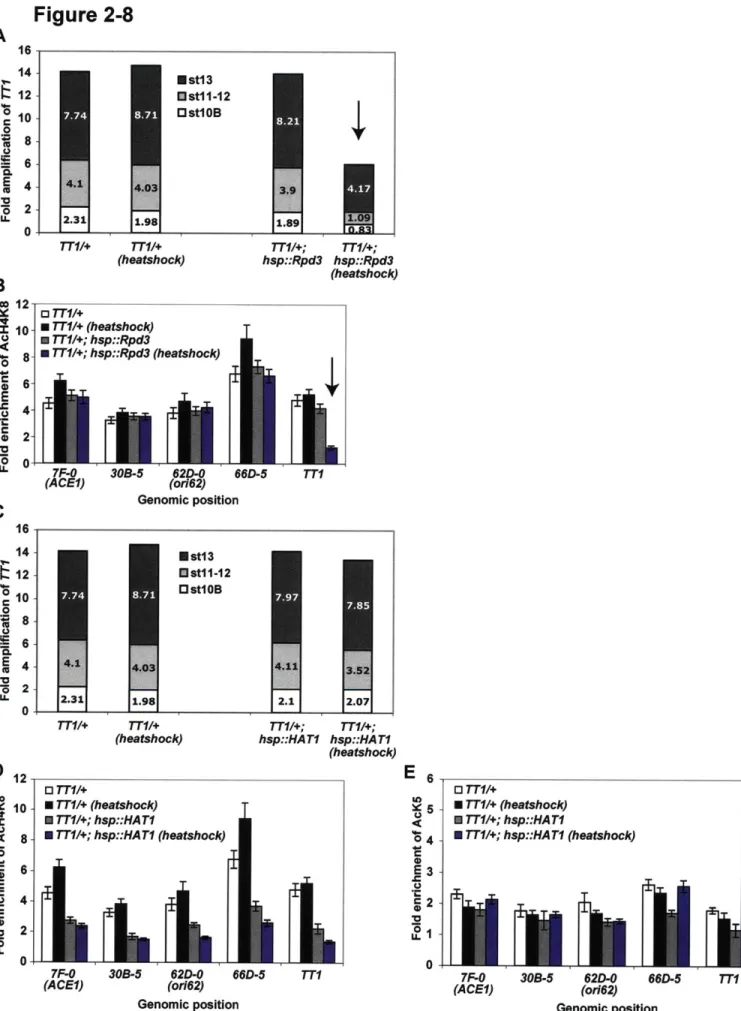
associated histone proteins around which DNA wraps to form nucleosomes. The N-terminal tails of histones are subject to a number of covalent modifications such as acetylation, methylation, and phosphorylation, which induce chromosomal changes that either promote or inhibit various genomic processes such as transcription, replication, and recombination (KOUZARIDES 2007). These histone modifications have been best characterized with regard to transcription, and there are several well-defined marks characteristic of actively transcribed or repressed chromatin. However, there is also an interest in the relationship between replication and chromatin state. Recent work in budding yeast purifying histone proteins around a single origin and performing high-resolution mass spectrometry to identify all histone modifications throughout the cell cycle has revealed dynamic acetylation patterns of histone H3 and H4 (UNNIKRISHNAN et al. 2010). Multiply acetylated H3 and H4 are required for efficient origin activation during S phase.
Additionally, deletion of the histone deacetylase Rpd3 in budding yeast has been shown to result in early activation of late origins at non-telomere positions (KNOTT et al. 2009).
Two independent studies have found enrichment of hyperacetylated H3 and H4 at
Drosophila follicle cell amplicons (AGGARWAL and CALVI 2004; HARTL et al. 2007). H4
acetylation did not co-localize with elongating replicating forks, indicating that this modification is associated with replication initiation and not histone deposition at newly replicated DNA
(HARTL et al. 2007). Loss-of-function mutant clones of the histone deacetylase Rpd3 resulted in increased acetylation levels and showed increased genomic replication in amplification stage egg chambers. Furthermore, using a reporter construct, follicle cell amplification could be inhibited
by tethering Rpd3 to the region (AGGARWAL and CALVI 2004).
Genome-wide mapping studies found origins to be enriched for specific active histone marks such as H3K4 dimethylation, H3K4 trimethylation, and H3 acetylation (CADORET et al. 2008; KARNANI et al. 2010). In addition, ORC binding sites in Drosophila cell culture are significantly enriched for the histone variant H3.3, which marks active promoters and regulatory sequences (MAcALPINE et al. 2010). Notably, the enrichment of H3.3 is also found at ORC binding sites not associated with active transcription, indicating that this mark may be more general to replication origins in Drosophila and not just the promoter associated ones. Currently, it remains unclear whether ORC binding is an indirect consequence of local chromatin structure or whether ORC localization is somehow actively regulated. The observation that many regions of active, open chromatin do not contain replication origins or bind ORC implies that there are likely to be additional mechanisms to regulate ORC binding to specific sites. As more functional elements of the genome are mapped, there will be greater understanding of which of these features are linked to DNA replication initiation.
An attractive hypothesis for why replication origins are significantly enriched for TSS's is that active transcription necessitates or creates an open chromatin state that is also required for ORC binding or origin activation. Multiple genome-wide studies have found that the origin datasets identified are significantly enriched for DNaseI hypersensitive sites (CADORET et al. 2008; HANSEN et al. 2010; LUCAS et al. 2007). DNA regions are hypersensitive to cleavage by DNaseI when not wrapped in the nucleosome, as when transcription factors displace histone
octamers. In Drosophila cell culture, ORC binding sites are significantly depleted for bulk nucleosomes (MACALPINE et al. 2010). These results suggest that accessible DNA may be important for ORC binding or some other step of replication initiation. In budding yeast, nucleosomes are excluded from the ACS and B elements of ARSI (LIPFORD and BELL 2001). Recent studies have demonstrated that origin sequence is sufficient to maintain nucleosome free
origins on a genome-wide scale, although ORC binding is required for the precise nucleosomal positioning surrounding the origin (EATON et al. 2010). One possibility is that, in budding yeast, the nucleosome free region established by origin sequence, in concert with additional
mechanisms, is necessary for ORC binding. In metazoans, where there is no consensus origin motif, ORC binding may rely on nucleosome-free DNA established by other means, such as at promoters during transcription.
Replication timing and cell type specific replication programs
Cells have a distinct temporal replication program. That is, there are regions that are consistently replicated early in S phase and others that are replicated late in S phase, which can be assessed across the genome. Work in Drosophila and mammalian cell culture, though not in yeast, shows a correlation between early origin firing and active transcription (MAcALPINE et al. 2004; WHITE et al. 2004). This relationship appears to hold for large zones and not necessarily the level of individual genes. Furthermore, the two alleles of the same gene can display asynchronous replication timing in the case of imprinted genes where the expressed allele replicates earlier than the silent allele (SINGH et al. 2003). Several reviews discuss the
relationship of replication timing and transcription based on analyses of model replication origins (ALADJEM 2007; HIRATANI et al. 2009). This section will focus on relevant findings regarding replication and transcription from the genome-wide mapping experiments.
The study in Drosophila cell culture identified 630 hydroxyurea-resistant early origins by BrdU immunoprecipitation, and higher density of ORC binding corresponded to earlier
replication time (MACALPINE et al. 2010), but Cadoret et al found that replication timing was independent of origin density (CADORET et al. 2008), which may be due to the limited number of genomic regions they assessed. Alternatively, the distinction of ORC binding density versus
origin density may be significant. High density of ORC binding may increase the likelihood that replication will initiate early at this region because there are more potential origins that can be
activated. In contrast, the clustering of origins is not necessarily indicative of replication timing. A comprehensive study of replication timing comes from the Repli-Seq method, where there is whole-genome data of newly replicated DNA at six time points spanning the G
1/S
transition to the end of S phase (HANSEN et al. 2010). Furthermore, because multiple cell types were used, the relationship of cell type specific transcription and DNA replication could beinvestigated. Similar to previous studies, regions were identified where a gene that is exclusively expressed in one cell type is early replicating, but it is late replicating in the cell types where it is not expressed (HATTON et al. 1988). Additional examples of asynchronous replication based on
allelic expression were also identified. In terms of replication features, constant early replication regions are associated with high gene density, gene expression, Alu density, GC content, and
CpG density, all of which are consistent with the previously reported findings of transcription and early replication. In addition, genomic regions associated with the nuclear lamina, which are physically segregated from the internal nuclear compartment, are late replicating.
By looking at pair-wise combinations of cell types for differences in replication timing, Hansen et al observed that 50% of the human genome displayed plasticity, or variability in replication timing (HANSEN et al. 2010). One intriguing hypothesis is that this plasticity is due to