arXiv:1405.3628v1 [nucl-ex] 14 May 2014
A. Adare,13S. Afanasiev,32C. Aidala,14, 45, 46 N.N. Ajitanand,64 Y. Akiba,58, 59 R. Akimoto,12H. Al-Bataineh,52
J. Alexander,64 M. Alfred,25 A. Angerami,14 K. Aoki,37, 58 N. Apadula,65 L. Aphecetche,66 Y. Aramaki,12, 58
R. Armendariz,52S.H. Aronson,7 J. Asai,59 H. Asano,37, 58 E.T. Atomssa,38, 65 R. Averbeck,65 T.C. Awes,54
B. Azmoun,7 V. Babintsev,26 M. Bai,6 G. Baksay,20 L. Baksay,20 A. Baldisseri,16 N.S. Bandara,45
B. Bannier,65 K.N. Barish,8 P.D. Barnes,41, ∗ B. Bassalleck,51 A.T. Basye,1 S. Bathe,5, 8, 59 S. Batsouli,54
V. Baublis,57 C. Baumann,47 A. Bazilevsky,7 M. Beaumier,8 S. Beckman,13 S. Belikov,7, ∗ R. Belmont,46, 70
R. Bennett,65 A. Berdnikov,61Y. Berdnikov,61 J.H. Bhom,74 A.A. Bickley,13 D. Black,8 D.S. Blau,36
J.G. Boissevain,41 J. Bok,52 J.S. Bok,74 H. Borel,16 K. Boyle,59, 65 M.L. Brooks,41J. Bryslawskyj,5
H. Buesching,7V. Bumazhnov,26 G. Bunce,7, 59 S. Butsyk,41, 65 S. Campbell,30, 65 A. Caringi,48 B.S. Chang,74
J.-L. Charvet,16 C.-H. Chen,59, 65 S. Chernichenko,26 C.Y. Chi,14 J. Chiba,34 M. Chiu,7, 27 I.J. Choi,27, 74
J.B. Choi,10 R.K. Choudhury,4 P. Christiansen,43 T. Chujo,69, 70 P. Chung,64 A. Churyn,26 O. Chvala,8
V. Cianciolo,54Z. Citron,65, 72 C.R. Cleven,22B.A. Cole,14M.P. Comets,55 Z. Conesa del Valle,38 M. Connors,65
P. Constantin,41M. Csan´ad,18T. Cs¨org˝o,73T. Dahms,65 S. Dairaku,37, 58 I. Danchev,70 K. Das,21A. Datta,45, 51
M.S. Daugherity,1G. David,7 M.K. Dayananda,22 M.B. Deaton,1K. DeBlasio,51 K. Dehmelt,20, 65 H. Delagrange,66
A. Denisov,26 D. d’Enterria,14 A. Deshpande,59, 65 E.J. Desmond,7 K.V. Dharmawardane,52 O. Dietzsch,62
L. Ding,30 A. Dion,30, 65 J.H. Do,74 M. Donadelli,62 O. Drapier,38A. Drees,65 K.A. Drees,6 A.K. Dubey,72
J.M. Durham,41, 65 A. Durum,26 D. Dutta,4 V. Dzhordzhadze,8 L. D’Orazio,44 S. Edwards,21 Y.V. Efremenko,54
J. Egdemir,65 F. Ellinghaus,13W.S. Emam,8 T. Engelmore,14 A. Enokizono,40, 54, 58, 60 H. En’yo,58, 59 S. Esumi,69
K.O. Eyser,8B. Fadem,48 N. Feege,65D.E. Fields,51, 59 M. Finger,9, 32M. Finger, Jr.,9, 32 F. Fleuret,38 S.L. Fokin,36
Z. Fraenkel,72, ∗ J.E. Frantz,53, 65 A. Franz,7 A.D. Frawley,21 K. Fujiwara,58 Y. Fukao,37, 58 T. Fusayasu,50
S. Gadrat,42C. Gal,65 P. Gallus,15 P. Garg,3I. Garishvili,67H. Ge,65 F. Giordano,27 A. Glenn,13, 40 H. Gong,65
M. Gonin,38 J. Gosset,16Y. Goto,58, 59 R. Granier de Cassagnac,38 N. Grau,2, 14, 30 S.V. Greene,70 G. Grim,41
M. Grosse Perdekamp,27, 59 Y. Gu,64 T. Gunji,12 H. Guragain,22 H.-˚A. Gustafsson,43, ∗ T. Hachiya,24, 58
A. Hadj Henni,66 C. Haegemann,51 J.S. Haggerty,7 K.I. Hahn,19 H. Hamagaki,12J. Hamblen,67 R. Han,56
S.Y. Han,19 J. Hanks,14, 65H. Harada,24E.P. Hartouni,40K. Haruna,24 S. Hasegawa,31 E. Haslum,43 R. Hayano,12
X. He,22 M. Heffner,40 T.K. Hemmick,65 T. Hester,8 H. Hiejima,27 J.C. Hill,30 R. Hobbs,51 M. Hohlmann,20
R.S. Hollis,8 W. Holzmann,14, 64 K. Homma,24 B. Hong,35T. Horaguchi,24, 58, 68 D. Hornback,67T. Hoshino,24
S. Huang,70T. Ichihara,58, 59 R. Ichimiya,58H. Iinuma,37, 58Y. Ikeda,58, 69 K. Imai,31, 37, 58 Y. Imazu,58M. Inaba,69
Y. Inoue,58, 60 A. Iordanova,8D. Isenhower,1 L. Isenhower,1 M. Ishihara,58 T. Isobe,12 M. Issah,64, 70
A. Isupov,32 D. Ivanischev,57 D. Ivanishchev,57 Y. Iwanaga,24 B.V. Jacak,65S.J. Jeon,49 M. Jezghani,22
J. Jia,7, 14, 64 X. Jiang,41J. Jin,14O. Jinnouchi,59B.M. Johnson,7T. Jones,1 E. Joo,35 K.S. Joo,49 D. Jouan,55
D.S. Jumper,1, 27 F. Kajihara,12S. Kametani,12, 71 N. Kamihara,58J. Kamin,65M. Kaneta,59 J.H. Kang,74
J.S. Kang,23H. Kanou,58, 68 J. Kapustinsky,41 K. Karatsu,37, 58M. Kasai,58, 60 D. Kawall,45, 59M. Kawashima,58, 60
A.V. Kazantsev,36T. Kempel,30J.A. Key,51 V. Khachatryan,65 A. Khanzadeev,57K. Kihara,69K.M. Kijima,24
J. Kikuchi,71A. Kim,19 B.I. Kim,35C. Kim,35D.H. Kim,19, 49 D.J. Kim,33, 74 E. Kim,63 E.-J. Kim,10 H.-J. Kim,74
M. Kim,63 Y.-J. Kim,27 Y.K. Kim,23 E. Kinney,13 A. Kiss,´ 18 E. Kistenev,7A. Kiyomichi,58J. Klatsky,21
J. Klay,40 C. Klein-Boesing,47D. Kleinjan,8 P. Kline,65 T. Koblesky,13 L. Kochenda,57 V. Kochetkov,26
M. Kofarago,18B. Komkov,57M. Konno,69J. Koster,27, 59 D. Kotchetkov,8D. Kotov,57, 61 A. Kozlov,72A. Kr´al,15
A. Kravitz,14 J. Kubart,9, 29 G.J. Kunde,41 N. Kurihara,12 K. Kurita,58, 60 M. Kurosawa,58, 59 M.J. Kweon,35
Y. Kwon,67, 74 G.S. Kyle,52R. Lacey,64Y.S. Lai,14J.G. Lajoie,30A. Lebedev,30 D.M. Lee,41J. Lee,19K.B. Lee,35, 41
K.S. Lee,35 M.K. Lee,74 S.H. Lee,65T. Lee,63 M.J. Leitch,41M.A.L. Leite,62 M. Leitgab,27 B. Lenzi,62 X. Li,11
P. Lichtenwalner,48P. Liebing,59S.H. Lim,74L.A. Linden Levy,13T. Liˇska,15 A. Litvinenko,32H. Liu,41M.X. Liu,41
B. Love,70 D. Lynch,7C.F. Maguire,70 Y.I. Makdisi,6 M. Makek,72, 75 A. Malakhov,32M.D. Malik,51 A. Manion,65
V.I. Manko,36E. Mannel,7, 14 Y. Mao,56, 58 L. Maˇsek,9, 29 H. Masui,69 F. Matathias,14 M. McCumber,41, 65
P.L. McGaughey,41 D. McGlinchey,13, 21 C. McKinney,27 N. Means,65A. Meles,52 M. Mendoza,8 B. Meredith,14, 27
Y. Miake,69T. Mibe,34 A.C. Mignerey,44 P. Mikeˇs,9, 29 K. Miki,58, 69 A.J. Miller,1 T.E. Miller,70 A. Milov,7, 65, 72
S. Mioduszewski,7 D.K. Mishra,4 M. Mishra,3 J.T. Mitchell,7 M. Mitrovski,64S. Miyasaka,58, 68 S. Mizuno,58, 69
A.K. Mohanty,4 P. Montuenga,27 H.J. Moon,49 T. Moon,74 Y. Morino,12 A. Morreale,8D.P. Morrison,7, †
T.V. Moukhanova,36 D. Mukhopadhyay,70 T. Murakami,37, 58 J. Murata,58, 60 A. Mwai,64 S. Nagamiya,34, 58
Y. Nagata,69J.L. Nagle,13, ‡ M. Naglis,72M.I. Nagy,18, 73 I. Nakagawa,58, 59 H. Nakagomi,58, 69 Y. Nakamiya,24
M. Nguyen,65 M. Nihashi,24, 58 T. Niida,69 B.E. Norman,41 R. Nouicer,7, 59 N. Novitzky,33A.S. Nyanin,36
C. Oakley,22E. O’Brien,7 S.X. Oda,12 C.A. Ogilvie,30H. Ohnishi,58 M. Oka,69 K. Okada,59 O.O. Omiwade,1
Y. Onuki,58 J.D. Orjuela Koop,13A. Oskarsson,43M. Ouchida,24, 58 H. Ozaki,69K. Ozawa,12, 34R. Pak,7 D. Pal,70
A.P.T. Palounek,41V. Pantuev,28, 65V. Papavassiliou,52I.H. Park,19J. Park,63S. Park,63 S.K. Park,35W.J. Park,35
S.F. Pate,52 L. Patel,22 M. Patel,30 H. Pei,30 J.-C. Peng,27 H. Pereira,16 D.V. Perepelitsa,7, 14 G.D.N. Perera,52
V. Peresedov,32D.Yu. Peressounko,36J. Perry,30 R. Petti,65 C. Pinkenburg,7 R. Pinson,1 R.P. Pisani,7 M. Proissl,65
M.L. Purschke,7A.K. Purwar,41H. Qu,22 J. Rak,33, 51 A. Rakotozafindrabe,38I. Ravinovich,72K.F. Read,54, 67
S. Rembeczki,20 M. Reuter,65 K. Reygers,47 D. Reynolds,64 V. Riabov,57 Y. Riabov,57, 61 E. Richardson,44
N. Riveli,53D. Roach,70G. Roche,42S.D. Rolnick,8A. Romana,38, ∗M. Rosati,30C.A. Rosen,13 S.S.E. Rosendahl,43
P. Rosnet,42 Z. Rowan,5 J.G. Rubin,46 P. Rukoyatkin,32 P. Ruˇziˇcka,29 V.L. Rykov,58 B. Sahlmueller,47, 65
N. Saito,34, 37, 58, 59 T. Sakaguchi,7 S. Sakai,69 K. Sakashita,58, 68 H. Sakata,24 H. Sako,31 V. Samsonov,57
S. Sano,12, 71 M. Sarsour,22S. Sato,31, 34 T. Sato,69 S. Sawada,34B. Schaefer,70 B.K. Schmoll,67 K. Sedgwick,8
J. Seele,13, 59 R. Seidl,27, 58, 59 V. Semenov,26A. Sen,67 R. Seto,8 P. Sett,4 A. Sexton,44D. Sharma,65, 72 I. Shein,26
A. Shevel,57, 64 T.-A. Shibata,58, 68 K. Shigaki,24M. Shimomura,30, 69 K. Shoji,37, 58 P. Shukla,4A. Sickles,7, 65
C.L. Silva,30, 41, 62 D. Silvermyr,54 C. Silvestre,16 K.S. Sim,35 B.K. Singh,3 C.P. Singh,3 V. Singh,3 S. Skutnik,30
M. Sluneˇcka,9, 32 A. Soldatov,26 R.A. Soltz,40 W.E. Sondheim,41 S.P. Sorensen,67 I.V. Sourikova,7F. Staley,16
P.W. Stankus,54 E. Stenlund,43 M. Stepanov,45, 52 A. Ster,73 S.P. Stoll,7 T. Sugitate,24 C. Suire,55A. Sukhanov,7
T. Sumita,58 J. Sun,65 J. Sziklai,73 T. Tabaru,59 S. Takagi,69E.M. Takagui,62 A. Takahara,12A. Taketani,58, 59
R. Tanabe,69 Y. Tanaka,50S. Taneja,65 K. Tanida,37, 58, 59, 63M.J. Tannenbaum,7 S. Tarafdar,3, 72 A. Taranenko,64
P. Tarj´an,17 H. Themann,65 D. Thomas,1 T.L. Thomas,51 A. Timilsina,30 T. Todoroki,58, 69 M. Togawa,37, 58, 59
A. Toia,65J. Tojo,58L. Tom´aˇsek,29M. Tom´aˇsek,15H. Torii,24, 58 M. Towell,1 R. Towell,1R.S. Towell,1V-N. Tram,38
I. Tserruya,72Y. Tsuchimoto,24 C. Vale,7, 30 H. Valle,70 H.W. van Hecke,41M. Vargyas,73 E. Vazquez-Zambrano,14
A. Veicht,27 J. Velkovska,70 R. V´ertesi,17, 73 A.A. Vinogradov,36 M. Virius,15 V. Vrba,15, 29 E. Vznuzdaev,57
M. Wagner,37, 58D. Walker,65X.R. Wang,52D. Watanabe,24 K. Watanabe,69Y. Watanabe,58, 59 Y.S. Watanabe,34
F. Wei,30, 52 R. Wei,64 J. Wessels,47 S. Whitaker,30 S.N. White,7 D. Winter,14 S. Wolin,27 C.L. Woody,7
R.M. Wright,1 M. Wysocki,13, 54B. Xia,53 W. Xie,59 L. Xue,22 S. Yalcin,65 Y.L. Yamaguchi,12, 58, 71 K. Yamaura,24
R. Yang,27 A. Yanovich,26 Z. Yasin,8 J. Ying,22S. Yokkaichi,58, 59 I. Yoon,63Z. You,56G.R. Young,54I. Younus,39, 51
I.E. Yushmanov,36W.A. Zajc,14O. Zaudtke,47A. Zelenski,6C. Zhang,54 S. Zhou,11J. Zim´anyi,73, ∗and L. Zolin32
(PHENIX Collaboration)
1Abilene Christian University, Abilene, Texas 79699, USA
2Department of Physics, Augustana College, Sioux Falls, South Dakota 57197, USA 3Department of Physics, Banaras Hindu University, Varanasi 221005, India
4Bhabha Atomic Research Centre, Bombay 400 085, India
5Baruch College, City University of New York, New York, New York, 10010 USA
6Collider-Accelerator Department, Brookhaven National Laboratory, Upton, New York 11973-5000, USA 7Physics Department, Brookhaven National Laboratory, Upton, New York 11973-5000, USA
8University of California - Riverside, Riverside, California 92521, USA 9Charles University, Ovocn´y trh 5, Praha 1, 116 36, Prague, Czech Republic
10Chonbuk National University, Jeonju, 561-756, Korea
11Science and Technology on Nuclear Data Laboratory, China Institute of Atomic Energy, Beijing 102413, P. R. China 12Center for Nuclear Study, Graduate School of Science, University of Tokyo, 7-3-1 Hongo, Bunkyo, Tokyo 113-0033, Japan
13University of Colorado, Boulder, Colorado 80309, USA
14Columbia University, New York, New York 10027 and Nevis Laboratories, Irvington, New York 10533, USA 15Czech Technical University, Zikova 4, 166 36 Prague 6, Czech Republic
16Dapnia, CEA Saclay, F-91191, Gif-sur-Yvette, France 17Debrecen University, H-4010 Debrecen, Egyetem t´er 1, Hungary
18ELTE, E¨otv¨os Lor´and University, H - 1117 Budapest, P´azm´any P. s. 1/A, Hungary 19Ewha Womans University, Seoul 120-750, Korea
20Florida Institute of Technology, Melbourne, Florida 32901, USA 21Florida State University, Tallahassee, Florida 32306, USA
22Georgia State University, Atlanta, Georgia 30303, USA 23Hanyang University, Seoul 133-792, Korea
24Hiroshima University, Kagamiyama, Higashi-Hiroshima 739-8526, Japan
25Department of Physics and Astronomy, Howard University, Washington, DC 20059, USA
26IHEP Protvino, State Research Center of Russian Federation, Institute for High Energy Physics, Protvino, 142281, Russia 27University of Illinois at Urbana-Champaign, Urbana, Illinois 61801, USA
28Institute for Nuclear Research of the Russian Academy of Sciences, prospekt 60-letiya Oktyabrya 7a, Moscow 117312, Russia 29Institute of Physics, Academy of Sciences of the Czech Republic, Na Slovance 2, 182 21 Prague 8, Czech Republic
30Iowa State University, Ames, Iowa 50011, USA
31Advanced Science Research Center, Japan Atomic Energy Agency, 2-4
Shirakata Shirane, Tokai-mura, Naka-gun, Ibaraki-ken 319-1195, Japan
32Joint Institute for Nuclear Research, 141980 Dubna, Moscow Region, Russia
33Helsinki Institute of Physics and University of Jyv¨askyl¨a, P.O.Box 35, FI-40014 Jyv¨askyl¨a, Finland 34KEK, High Energy Accelerator Research Organization, Tsukuba, Ibaraki 305-0801, Japan
35Korea University, Seoul, 136-701, Korea
36Russian Research Center “Kurchatov Institute”, Moscow, 123098 Russia 37Kyoto University, Kyoto 606-8502, Japan
38Laboratoire Leprince-Ringuet, Ecole Polytechnique, CNRS-IN2P3, Route de Saclay, F-91128, Palaiseau, France 39Physics Department, Lahore University of Management Sciences, Lahore, Pakistan
40Lawrence Livermore National Laboratory, Livermore, California 94550, USA 41Los Alamos National Laboratory, Los Alamos, New Mexico 87545, USA
42LPC, Universit´e Blaise Pascal, CNRS-IN2P3, Clermont-Fd, 63177 Aubiere Cedex, France 43Department of Physics, Lund University, Box 118, SE-221 00 Lund, Sweden
44University of Maryland, College Park, Maryland 20742, USA
45Department of Physics, University of Massachusetts, Amherst, Massachusetts 01003-9337, USA 46Department of Physics, University of Michigan, Ann Arbor, Michigan 48109-1040, USA
47Institut fur Kernphysik, University of Muenster, D-48149 Muenster, Germany 48Muhlenberg College, Allentown, Pennsylvania 18104-5586, USA
49Myongji University, Yongin, Kyonggido 449-728, Korea
50Nagasaki Institute of Applied Science, Nagasaki-shi, Nagasaki 851-0193, Japan 51University of New Mexico, Albuquerque, New Mexico 87131, USA 52New Mexico State University, Las Cruces, New Mexico 88003, USA 53Department of Physics and Astronomy, Ohio University, Athens, Ohio 45701, USA
54Oak Ridge National Laboratory, Oak Ridge, Tennessee 37831, USA 55IPN-Orsay, Universite Paris Sud, CNRS-IN2P3, BP1, F-91406, Orsay, France
56Peking University, Beijing 100871, P. R. China
57PNPI, Petersburg Nuclear Physics Institute, Gatchina, Leningrad region, 188300, Russia 58RIKEN Nishina Center for Accelerator-Based Science, Wako, Saitama 351-0198, Japan 59RIKEN BNL Research Center, Brookhaven National Laboratory, Upton, New York 11973-5000, USA
60Physics Department, Rikkyo University, 3-34-1 Nishi-Ikebukuro, Toshima, Tokyo 171-8501, Japan 61Saint Petersburg State Polytechnic University, St. Petersburg, 195251 Russia
62Universidade de S˜ao Paulo, Instituto de F´ısica, Caixa Postal 66318, S˜ao Paulo CEP05315-970, Brazil 63Department of Physics and Astronomy, Seoul National University, Seoul, Korea
64Chemistry Department, Stony Brook University, SUNY, Stony Brook, New York 11794-3400, USA 65Department of Physics and Astronomy, Stony Brook University, SUNY, Stony Brook, New York 11794-3800, USA 66SUBATECH (Ecole des Mines de Nantes, CNRS-IN2P3, Universit´e de Nantes) BP 20722 - 44307, Nantes, France
67University of Tennessee, Knoxville, Tennessee 37996, USA
68Department of Physics, Tokyo Institute of Technology, Oh-okayama, Meguro, Tokyo 152-8551, Japan 69Institute of Physics, University of Tsukuba, Tsukuba, Ibaraki 305, Japan
70Vanderbilt University, Nashville, Tennessee 37235, USA 71Waseda University, Advanced Research Institute for Science and
Engineering, 17 Kikui-cho, Shinjuku-ku, Tokyo 162-0044, Japan
72Weizmann Institute, Rehovot 76100, Israel
73Institute for Particle and Nuclear Physics, Wigner Research Centre for Physics, Hungarian
Academy of Sciences (Wigner RCP, RMKI) H-1525 Budapest 114, POBox 49, Budapest, Hungary
74Yonsei University, IPAP, Seoul 120-749, Korea
75University of Zagreb, Faculty of Science, Department of Physics, Bijeniˇcka 32, HR-10002 Zagreb, Croatia
(Dated: August 13, 2019)
The PHENIX experiment at the Relativistic Heavy Ion Collider has performed a systematic study of K0
S and K∗0 meson production at midrapidity in p+p, d+Au, and Cu+Cu collisions at
√s
N N = 200 GeV. The K
0
S and K∗0 mesons are reconstructed via their K 0 S→ π
0
(→ γγ)π0
(→ γγ) and K∗0→ K±π∓decay modes, respectively. The measured transverse-momentum spectra are used
to determine the nuclear modification factor of K0
Sand K∗0mesons in d+Au and Cu+Cu collisions at
different centralities. In the d+Au collisions, the nuclear modification factor of K0
Sand K∗0mesons
is almost constant as a function of transverse momentum and is consistent with unity showing that cold-nuclear-matter effects do not play a significant role in the measured kinematic range. In Cu+Cu collisions, within the uncertainties no nuclear modification is registered in peripheral collisions. In central collisions, both mesons show suppression relative to the expectations from the p+p yield scaled by the number of binary nucleon-nucleon collisions in the Cu+Cu system. In the pT
range 2–5 GeV/c, the strange mesons (K0
S, K∗0) similarly to the φ meson with hidden strangeness,
nonsuppressed baryons (p, ¯p). At higher transverse momentum, pT >5 GeV/c, production of all
particles is similarly suppressed by a factor of ≈ 2.
PACS numbers: 25.75.Dw
I. INTRODUCTION
At very high energy densities, exceeding approximately 1 GeV/fm3, quantum chromodynamics predicts a phase
transition from ordinary hadronic nuclear matter to a new state of matter where the degrees of freedom are quarks and gluons [1]. This state of matter exhibits very strong coupling between its constituents and is thus called the strongly coupled Quark-Gluon Plasma (sQGP) [2]. Matter at such high energy density can be produced in laboratory conditions by colliding heavy nu-clei at relativistic energies. A wealth of measurements is available from the experiments at the Relativistic Heavy Ion Collider (RHIC) and recently from the experiments at the Large Hadron Collider (LHC) [3].
High-momentum penetrating probes are among the ob-servables attracting primary attention. Highly energetic partons traversing the sQGP medium suffer significant energy loss [4, 5], leading to modification of the frag-mentation functions [6] and softening of the measured transverse momentum (pT) distribution. The softening
of the spectrum is quantified by the “nuclear modification factor” (RAB) defined as:
RAB=
d2N
AB/dydpT
Ncoll× d2Npp/dydpT
, (1)
where the numerator is the per-event yield of particle production in A+B (heavy ion) collisions, measured as a function of pT, d2Npp/dydpT is the per-event yield of the
same process in p+p collisions and Ncoll is the number
of nucleon-nucleon collisions in the A+B system [7, 8]. RAB different from unity is a manifestation of medium
effects. However, to untangle final state effects, such as energy loss, from possible contributions of cold nuclear matter and initial state effects (e.g. shadowing [9] and the Cronin effect [10]), the nuclear modification factor must also be measured in systems like p+A or d+A.
A significant suppression of hadrons produced in heavy ion collisions was first measured at RHIC [11–20] and re-cently at the LHC [21, 22] also with fully reconstructed jets [23–25]. In central Au+Au collisions at RHIC, RAB
of hadrons reaches a maximum suppression of a factor of ∼ 5 at pT ∼ 5 GeV/c [13, 15, 16, 26]. At higher
pT, the suppression is found to be independent of the
particle type, mesons or baryons, and their quark fla-vor content [27–29]. In central Pb+Pb collisions at the
∗Deceased
†PHENIX Co-Spokesperson: morrison@bnl.gov ‡PHENIX Co-Spokesperson: jamie.nagle@colorado.edu
LHC, the suppression reaches a factor of ∼ 7 at pT ∼ 6–
7 GeV/c [21, 22]. At higher pT, the RAB starts to
in-crease reaching a value of 0.5 at pT > 40 GeV/c.
In the intermediate pT range (2 < pT < 5 GeV/c),
mesons containing light quarks (π, η) exhibit suppres-sion [15, 30], whereas protons show very little or no sup-pression [30–32]. Other processes, such as the Cronin ef-fect [10], strong radial flow [33], recombination efef-fects [34] have been invoked to explain the differences between mesons and baryons in this momentum range. Recent results obtained at the LHC in p+Pb collisions [35–37] and at RHIC in d+Au collisions [30, 38] suggest that collective effects might be present even in small systems and can significantly modify the particle properties in the intermediate transverse momentum range.
Measurements of particles with different quark content provide additional constraints on the models of collec-tive behavior, parton energy loss and parton recombina-tion. Experimental measurements of particles containing strange quarks are important to find out whether flow or recombination mechanisms boost strange hadron produc-tion at intermediate pT and to understand their
suppres-sion at high pT. In heavy ion collisions, the φ meson [16]
shows at high pT the same suppression as particles
con-taining only u and d quarks, however at intermediate pT
it is less suppressed than the π meson. On the other hand, the η meson, which has a significant strange quark content, is suppressed at the same level as π meson in the pT range from 2–10 GeV/c [15]. Open questions are:
Which physics mechanism prevails in the intermediate pT region and which process is responsible for the
sup-pression of particles with strange quark content. This article presents results of the K0
S and K∗0
me-son production as a function of pT at midrapidity in
p+p, d+Au and Cu+Cu collisions at √sN N = 200 GeV.
The present measurements significantly extend the pT
reach of the previous PHENIX results on the measure-ment of K0
S meson in p+p collisions [39]. The K 0 S meson
is reconstructed via the K0
S→ π0(→ γγ)π0(→ γγ) decay
mode. The K∗0 and K∗0 mesons are reconstructed via
the K∗0 → K+π− and K∗0 → K−π+ decay modes,
re-spectively. The yields measured for the K∗0 and K∗0
mesons are averaged together and denoted as K∗0. The
invariant transverse momentum spectra for K0
S mesons
are measured over the pT range of 2–13 (3–12) GeV/c in
the d+Au (Cu+Cu) collision systems. The K∗0 meson
spectra are measured in the pT range from 1.1 GeV/c
up to 8–8.5 GeV/c depending on the collision system. The measurements extend the momentum coverage of the previously published results by the STAR collabo-ration [40–42]. The nuclear modification factors are ob-tained for both particles in d+Au and Cu+Cu collisions at different centralities and are compared with those of
the φ and π0 mesons. The measured p
T ranges and the
centrality bins used in the different systems are listed in Table I.
TABLE I. Summary of centrality bins and measured pT
ranges for the K0
Sand K∗0studies.
Centrality Measured pT
Collision bins range System (%) (GeV/c) KS0 d+Au 0–20, 20–40, 40–60, 60–88 2.0–13.0 Cu+Cu 0–20, 20–60, 60–94 3.0–12.0 K∗0 p+p ————– 1.1–8.0 d+Au 0–20, 20–40, 40–60, 60–88 1.1–8.5 Cu+Cu 0–20, 20–40, 40–60, 60–94 1.4–8.0
The paper is organized as follows. The next section gives a brief description of the PHENIX detector. The analysis procedures used to measure K0
Sand K∗0mesons
are described in Section III. The results, including the invariant pT distributions and RAB, are given in
Sec-tion IV. A summary is given in SecSec-tion V.
II. PHENIX DETECTOR
A detailed description of the PHENIX detector can be found in Ref. [43]. The analysis here is performed using the two central-arm spectrometers, each covering an az-imuthal angle φ = π/2 and pseudorapidity |η| < 0.35 [44] at midrapidity. Each arm comprises a Drift Chamber (DC), two or three layers of pad chambers (PC), a ring-imaging ˇCerenkov detector (RICH) and an Electromag-netic Calorimeter (EMCal) and a time-of-flight detector (TOF). This analysis uses the east arm of the TOF de-tector that covers π/4 in φ.
The global event information is provided by the beam-beam counters (BBC) [45], which are used for event trig-gering, collision time determination, measurement of the vertex position along the beam axis and for the central-ity determination [8, 46]. The typical vertex position resolution by the BBC depends on the track multiplicity and varies from ∼ 1.1 cm in p+p collisions to ∼ 3 mm in central Au+Au collisions.
Track reconstruction in PHENIX is provided by two detectors: DC and PC [44]. The DC and the first layer of PC (PC1) form the inner tracking system, whereas PC2 and PC3 form the outer tracker. The DC is a mul-tiwire gaseous detector located outside the magnetic field between the radii of 2.02 m and 2.48 m in each PHENIX arm. The DC measures the track position with an an-gular resolution of ∼ 0.8 mrad in the bending plane per-pendicular to the beam axis. A combinatorial Hough Transform technique [47] is used to determine the track direction in azimuth and its bending angle in the axial magnetic field of the central magnet [48]. The track-reconstruction algorithm approximates all tracks in the volume of the DC with straight lines and assumes their
origin at the collision vertex. This information is then combined with the hit information in PC1 which imme-diately follows the DC along the particle tracks. PC1 provides the z-coordinate information with a spatial res-olution of σz∼ 1.7 mm. The resulting momentum
reso-lution for charged particles with pT > 0.2 GeV/c is δp/p
= 0.7 ⊕ 1.1 % p (GeV/c), where the first term repre-sents multiple scattering and the second term is due to the intrinsic angular resolution of the DC. Matching the tracks to hits in PC2 and PC3 located at radii of 4.2 m and 5.0 m respectively helps to reject secondary tracks that originate either from decays of long-lived hadrons or from interactions with the detector material. Detailed information on the PHENIX tracking can be found in Ref. [44, 49].
The TOF detector [50] identifies charged hadrons; pi-ons, kaons and protons. It is located at a radial dis-tance of 5.06 m from the interaction point in the east central arm. The total timing resolution of TOF east is 130 ps, which includes the start time determination from the BBC. This allows for a 2.6σ π/K separation up to pT ≃ 2.5 GeV/c and K/p separation up to pT
= 4.5 GeV/c using an asymmetric particle-identification (PID) cut, as described in Ref. [51].
The EMCal [52] uses scintillator (PbSc) and lead-glass (PbGl) technologies and measures the position and energy of electrons and photons. It also provides a trig-ger on rare events with high momentum photons. The EMCal covers the full acceptance of the central spec-trometers and is divided into eight sectors in azimuth. Six PbSc sectors are located at a radial distance of 5.1 m from the beam line and comprise 15,552 lead-scintillator sandwich towers with cross section of 5.5 × 5.5 cm2 and
depth of 18 radiation lengths (X0). Two PbGl sectors are
located at a distance of 5 m and comprise 9,216 towers of 4 × 4 cm2 and a depth of 14.3 X
0. Most electromagnetic
showers extend over several towers. Groups of adjacent towers with signals above a threshold that are associated with the same shower form an EMCal cluster. The en-ergy resolution of the PbSc (PbGl) calorimeter is δE/E = 2.1 (0.8)% ⊕ 8.1 (5.9)/pE[GeV]%. The spatial resolu-tion of the PbSc (PbGl) calorimeter reaches σ(E) = 1.55 (0.2) ⊕ 5.74 (8.4)/pE[GeV] mm for particles at normal incidence.
Analyses presented in this paper use both the mini-mum bias (MB) and the rare event, EMCal-RICH trig-ger (ERT). For p+p, d+Au, and Cu+Cu collisions, the MB trigger requires a coincidence of at least one chan-nel firing on each side of the BBC. It further requires the vertex position along the beam axis z, as determined from the BBC timing information, to be within 38 cm of the nominal center of the interaction region. Photon ERT utilizes the EMCal to select events with at least one registered high pT photon or electron. For every EMCal
super module [52], the ERT sums the registered energy in adjacent 4 × 4 EMCal towers. This trigger is used to col-lect samples for the K0
S meson analysis. The trigger fires
in d+Au and Cu+Cu collisions, respectively. The calcu-lation of the ERT efficiency for photons and K0
S mesons
is described in Section III C.
III. ANALYSIS PROCEDURE
This section describes the analysis procedure for the measurement of K0
S meson and K∗0 meson transverse
momentum spectra. The measurements are done using the data sets collected by the PHENIX experiment in the 2005 (p+p and Cu+Cu) and in the 2008 (d+Au) physics runs. The data samples used in the analysis cor-respond to integrated luminosities of 3.78 pb−1 in p+p,
81 nb−1 in d+Au and 3.06 nb−1in Cu+Cu collision
sys-tems. The mesons are reconstructed via the decay modes K0
S → π0(→ γγ)π0(→ γγ) and K∗0→ K±π∓. The MB
triggered data samples are used for the K∗0meson study
in p+p, d+Au and Cu+Cu systems. The K0 S meson
measurements are done using both the MB and ERT-triggered data samples in d+Au and Cu+Cu collisions. The MB samples provide the measurements at low and intermediate pT. The low pT reach of these
measure-ments is limited by the rapidly decreasing signal to back-ground ratio and subsequent difficulties in the extraction of the K0
S meson raw yield. The ERT-triggered data
give access to intermediate and high pT production of KS0
mesons due to larger sampled luminosity. In the overlap region, results obtained with the MB and ERT data sam-ples are found to be in very good agreement. For the final K0
S meson production spectrum in d+Au (Cu+Cu)
colli-sions, the MB results are used up to 4 (5) GeV/c and the ERT results are used at higher transverse momenta. De-tails about the K0
S meson measurement in p+p collisions
can be found in Ref. [39].
A. Reconstruction of KS0 meson invariant mass
The K0
S meson with a lifetime of cτ ∼ 2.7 cm
de-cays to two π0 mesons with a branching ratio BR =
30.69 ± 0.05% [53]. The neutral pions further decay into two photons with BR = 98.823 ± 0.034% [53]. The π0 mesons are measured by combining the pair of
pho-ton clusters reconstructed in the EMCal. The energy of the clusters is measured in the EMCal and momen-tum components are calculated assuming that the par-ticle originates at the event vertex. Besides electromag-netic showers created by photons and electrons, the EM-Cal also registers showers associated with hadrons. Be-cause hadron showers are typically wider than the elec-tromagnetic ones, a shower profile cut [54] is used to re-ject hadron-like clusters. The shower profile cut is based on a comparison of the registered cluster energy distri-bution in the EMCal towers to a reference shower shape expected for electromagnetic showers. Most hadrons are not absorbed in the EMCal and traverse it as minimum ionizing particles. The typical hadron energy loss in the
EMCal is ∼ 0.3 GeV [54]. To reduce hadron contamina-tion and to account for the poorer EMCal resolucontamina-tion at lower energies, a minimum energy Eγ > 0.2 GeV is re-quired for clusters reconstructed in all d+Au events and in peripheral Cu+Cu events. In more central Cu+Cu collisions it is increased to Eγ > 0.4 GeV. The two clus-ters from the same π0 meson are also required to fall
within the acceptance of the same EMCal sector to sup-press boundary effects. The energy balance between the two clusters forming a π0 candidate is characterized by
α = |E1−E2|/|E1+ E2|, where E1and E2are the cluster
energies. For π0 → γγ decays the parameter α has an
almost flat distribution between 0 and 1 [54] . Due to the steeply falling pT spectrum of all particles produced
in the event, most of the EMCal clusters have a low en-ergy partner, therefore the distribution of the parameter α calculated for combinatorial pairs has a distinct peak close to 1 for high pT pairs. To exclude those pairs,
pa-rameter α is required to be less than 0.8.
A pair of γ-clusters is selected as a π0 candidate if
its reconstructed invariant mass is within ±2 standard deviations from a parameterized π0mass:
|Mγγ(pT) − Mπ0(pT) × RM(pT)| < 2σπ0(pT)
× Rσ(pT), (2)
where Mγγ is the reconstructed invariant mass of a pair of the γ-clusters, pT is the transverse momentum of the
pair, Mπ0(pT) and σπ0(pT) are the parameterizations
of the mass and 1-σ width of the π0 peak as a function
of transverse momentum. The parameterization is per-formed using an inclusive sample of π0 mesons. R
M(pT)
and Rσ(pT) are correction factors accounting for the
dif-ference between inclusive π0 mesons and neutral pions
produced in K0
S meson decays.
To determine Mπ0(pT) and σπ0(pT), the peak position
and width of the π0 peak in the invariant mass
distribu-tion of the cluster pairs are measured for different pT bins
and are parameterized as a function of pT. The mass and
width of π0are determined by fitting the invariant mass
distribution with a sum of a Gaussian function describ-ing the signal and a second order polynomial describdescrib-ing the background. Figure 1 shows reconstructed mass and width of π0 as a function of p
T in Cu+Cu collisions for
one of the EMCal sectors.
Because of the long lifetime of the K0
Smeson, the
neu-tral pions from its decay are produced at a displaced vertex and thus the momentum components of the clus-ters are mis-reconstructed. This results in a different reconstructed mass and width of π0 mesons from K0
S
de-cays compared to those reconstructed for inclusive π0
mesons that mostly originate from the event vertex. In the data we have no means to isolate a sample of neutral pions from K0
S meson decays. Therefore a quantitative
study of this effect is possible only in Monte Carlo sim-ulation. Samples of π0mesons produced from the decay
of K0
S mesons with a realistic pT distribution and
[GeV/c]
γ γ Tp
0
1
2
3
4
5
6
7
8
]
2[MeV/c
0π
Reconstructed mass of
130
140
150
(a)
, simulation
0π
inclusive
, simulation
S 0from K
0π
, data
0π
inclusive
[GeV/c]
γ γ Tp
0
1
2
3
4
5
6
7
8
]
2[MeV/c
0π
Reconstructed width of
10
15
20
(b)
, simulation
0π
inclusive
, simulation
S 0from K
0π
, data
0π
inclusive
FIG. 1. (color online) (a) Reconstructed mass and (b) 1-σ width of π0 as a function of the reconstructed p
T for inclusive π0
mesons from data (open crosses), simulations (circles) and for π0 coming from K0
Sdecays (squares).
]
2
Invariant Mass [GeV/c
0.4
0.45
0.5
0.55
0.6
)
2/(5 MeV/c
210
×
Counts 3
4
5
6
7
π
0π
0 0 SK
+Au
d
without any correction with mass
correction to PDG with mass and width
0 π selections for decays S 0 from K (GeV/c) < 9 T p 8 <
FIG. 2. (color online) Invariant mass distribution for π0π0 pairs measured
in the MB d+Au collisions at 8 < pT < 9 GeV/c. Invariant mass
re-constructed without any corrections is shown with red squares. Invariant mass reconstructed after corrections for the mass of reconstructed π0to the
PDG value is shown with blue open crosses. Same with additional correc-tion accounting for the difference be-tween inclusive π0mesons and neutral
pions produced in K0
Smeson decay as
described in the text is shown with black circles.
the inclusive pT distribution were generated. Neutral
pi-ons were recpi-onstructed using the same analysis chain as in real data. From Fig. 1 (a) and (b), one can see the reconstructed masses and widths of simulated inclusive π0mesons (circles) originating from the event vertex are
consistent with the values measured in real data (open crosses). Neutral pions from K0
Sdecays are reconstructed
with smaller mass and larger width. The correction fac-tors RM(pT) and Rσ(pT) are calculated as the ratio of the
parameterizations of Mπ0(pT) and σπ0(pT) for neutral
pions from K0
S mesons and inclusive π
0 mesons. These
correction factors improve the signal-to-background ratio by 30%–50%.
The K0
S mesons are reconstructed by combining the
π0 candidates in pairs within the same event. Pairs of
π0 candidates that share the same cluster are rejected.
To improve the signal-to-background ratio π0candidates
and pT > 1.5 GeV/c for Cu+Cu events with centrality >
20% and pT > 2 GeV/c for Cu+Cu events with centrality
< 20%.
The red squares in Fig. 2 give an example of the in-variant mass distribution for π0π0 pairs measured in the
minimum bias d+Au collisions at 8 < pT < 9 GeV/c.
Due to the steeply falling pT spectrum of produced
par-ticles, the finite energy/position resolution and nonlin-ear response of the EMCal, the reconstructed mass of π0
mesons differs from the nominal PDG value MP DG =
134.98 MeV [53]. To match the reconstructed mass of π0
candidates to the PDG value, the energy and momentum of clusters building a pair are multiplied by the ratio of measured and nominal π0 mass: M
P DG/Mγγ. This
cor-rection decreases the width of reconstructed K0 S meson
peak by ≈ 50%. An example of the invariant mass dis-tribution after energy correction is shown with blue open crosses in Fig. 2. The black circles correspond to the case when π0candidate selection is changed according to
Eq. 2 to account for the difference between inclusive π0
mesons and neutral pions produced in K0
S meson decays.
The K0
S meson raw yield in each pT bin is extracted by
fitting the π0π0 invariant mass distribution to a
combi-nation of a Gaussian function for the signal and a poly-nomial for the background. A second order polypoly-nomial provided adequate description of the background shape outside of the K0
S peak and varied smoothly under the
peak. The fitting range was set to about ±8 standard deviations from the peak center and was enough to con-strain the fit. A wider fitting range would require a higher order polynomial to describe the background. All fits re-sulted in χ2/NDF values close to one. The K0
S meson
yield in each pT bin is calculated as the integral of the
Gaussian function. Examples of π0π0invariant mass
dis-tributions are shown in Fig. 3 (a) and (b) for d+Au and Cu+Cu, respectively.
The typical signal/background ratio, integrated within ±2σ around particle mass, for different centrality classes grows from 0.5 to 0.86 (0.04–0.85) in d+Au (Cu+Cu) col-lisions with increasing transverse momentum. The width and the mass of the reconstructed K0
S mesons were found
to be in good agreement with the values expected from simulation.
B. Reconstruction of K∗0 meson invariant mass
The K∗0 and K∗0 mesons are reconstructed from
their hadronic decay channels K+π− and K−π+,
re-spectively. We denote the average of K∗0 and K∗0 as
K∗0. Tracks selected for this analysis are required to
have pT > 0.3 GeV/c. The TOF system covers
approx-imately one half of the east central arm spectrometer acceptance and can identify charged kaons up to approx-imately 2.5 GeV/c [51]. To extend the high pT reach
of the K∗0meson measurement, unidentified, oppositely
charged tracks are also included in the analysis. These tracks are required to have associated hits in PC3 or
EM-TABLE II. Different techniques used in K∗0 measurement
and their pT coverage in p+p, d+Au and Cu+Cu collisions at
√s
N N = 200 GeV. The table also shows the range of
signal-to-background, integrated within ±3σ around particle mass (S/B), values for each sample.
Collision Technique pT range S/B
System used (GeV/c)
p+p fully identified 1.1–4.0 0.011–0.023 kaon identified 1.1–4.0 0.005–0.0147
unidentified 2.3–8.0 0.006–0.021 d+Au fully identified 1.1–4.0 0.009–0.015 kaon identified 1.4–4.5 0.003–0.0118
unidentified 2.3–8.5 0.009–0.012 Cu+Cu fully identified 1.4–4.0 0.0048–0.0076
kaon identified 1.7–4.5 0.0006–0.0039 unidentified 2.9–8.0 0.0011–0.0036
Cal and are referred to as the PC3-matched tracks. De-pending on the track selection criteria, three different techniques are considered in this analysis.
1. fully identified where tracks are identified as kaon and pion in TOF.
2. kaon identified where one of the tracks is identified as kaon in TOF and the other is a PC3-matched track to which the pion mass is assigned.
3. unidentified where both tracks are the PC3-matched tracks.
The three techniques are exclusive to each other and statistically independent. The PC3-matched tracks are assigned the nominal mass of the π or K mesons depend-ing on which technique is used. The pT ranges accessible
in the different techniques in p+p, d+Au and Cu+Cu collisions are given in Table II.
The “fully-identified” sample with both charged par-ticles identified in the TOF has the highest signal-to-background ratio and provides access to K∗0meson
pro-duction at low and intermediate pT. However, due to
the limited PID capabilities of the TOF technique and the small acceptance of the TOF detector, this data set does not provide sufficient statistical precession for pT > 4 GeV/c. The “kaon identified” sample allows
for the best signal extraction at intermediate pT. The
“unidentified” sample has a poor signal-to-background ratio that prevents signal extraction at low pT. Signal
extraction is possible at higher pT > 2.3 GeV/c in p+p
or d+Au collisions and pT > 2.9 GeV/c in Cu+Cu
colli-sions), because of the smaller combinatorial background. The highest pT reach of K∗0 measurements with the
“unidentified” sample is limited only by the sampled lu-minosity. Measurements performed with the three tech-niques have a wide overlap region that is used for evalu-ation of the systematic uncertainties.
The invariant mass distribution for Kπ pairs comprises both signal and background. The uncorrelated part of
]
2
Invariant Mass [GeV/c
0.4
0.45
0.5
0.55
0.6
)
2/(5 MeV/c
310
×
Counts
4
5
6
7
8
0π
0π
(a)
0 SK
(GeV/c) < 6
Tp
5 <
+Au
d
]
2Invariant Mass [GeV/c
0.4
0.45
0.5
0.55
0.6
)
2/(5 MeV/c
210
×
Counts
3.5
4
4.5
5
5.5
6
6.5
0π
0π
(b)
0 SK
Cu+Cu
(GeV/c) < 6
Tp
5 <
FIG. 3. (color online) The invariant mass reconstructed from two π0 mesons in the range 5 < p
T <6 GeV/c in (a) d+Au and
(b) Cu+Cu collisions at √sN N = 200 GeV for the MB data. The distributions are approximated by a Gaussian plus a second order polynomial shown by solid red and blue dashed lines respectively.
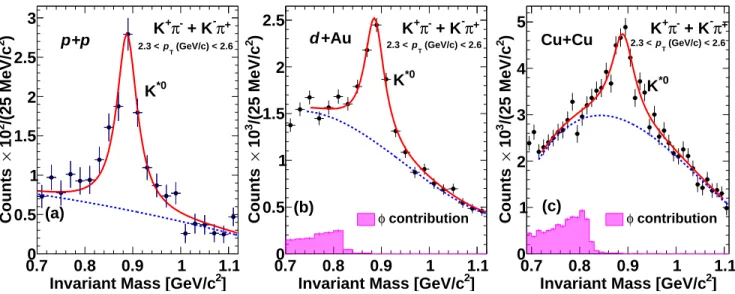
the background that arises from the random combination of tracks in the same event is estimated using the mixed event technique [55]. The event mixing combines pos-itively (negatively) charged tracks from one event with the charged tracks of opposite sign from another event within the same centrality class. The number of mixed events for each event in the data is set to 20 for p+p and d+Au and to 10 for Cu+Cu collisions, to have sufficient statistics. The mixed event invariant mass distribution is normalized by the number of events mixed and then it is subtracted from the unlike sign distributions. The corre-lated part of the background is dominated by track pairs from mis-reconstructed or not fully reconstructed decays of light hadrons. Two such processes, φ → K+K− and
K0 S → π
+π−, produce smeared peak structures in the
in-variant mass distribution in the close vicinity of the K∗0
mass peak. Contributions of these two sources are esti-mated using measured yields of the φ meson [16] and K0 S
meson [39]. The location and shape of these peaks are modeled by the PHENIX based simulations. The esti-mated contributions are then normalized by the number of events analyzed for K∗0 meson and subtracted from
the measured K∗0 invariant mass distributions. Apart
from these contributions, a residual background due to other correlated sources [40] remains in the subtracted spectra. The residual background is different depending on the collision systems, analysis techniques and also on the pair pT. Examples of invariant mass distributions
after subtraction of the mixed event background and the
correlated background from K0
S and φ mesons are shown
in Fig. 4 (a), (b) and (c) for p+p, d+Au and Cu+Cu col-lisions, respectively. The φ contribution is shown by the magenta colored histogram. It is seen that this contribu-tion is very small in Cu+Cu case, even smaller in d+Au case and negligible in p+p case. The residual background is clearly seen in the subtracted mass spectra. In the “fully-identified technique”, this residual background is relatively small. It is larger in the “kaon-identified tech-nique” and even larger in the analysis based on uniden-tified tracks.
The invariant mass distribution in each pT bin is fit to
the sum of a relativistic Breit-Wigner (RBW) function for the signal and a 2nd or 3rd order polynomial for the
residual background. RBW = 1 2π MKπMK∗0Γ (M2 Kπ− M 2 K∗0) 2+ M2 K∗0Γ 2, (3)
where MKπ is the reconstructed invariant mass, MK∗0
is the fitted mass of K∗0 meson and Γ is the width of
K∗0 meson fixed to the value obtained from simulation.
Because the experimental mass resolution (∼ 5 MeV/c2)
is much smaller than the natural width of the K∗0meson
the simulated Γ is very close to the nominal width of 48.7 MeV/c2 [53].
The raw yield of the K∗0 meson in each p
T bin is
ob-tained as follows. The yield in each pT bin is summed
up in the invariant mass window of ± 75 MeV/c2around
sig-]
2
Invariant Mass [GeV/c
0.7
0.8
0.9
1
1.1
)
2/(25 MeV/c
210
×
Counts
0
0.5
1
1.5
2
2.5
3
-π
++ K
-π
+K
(a)
*0K
p
+
p
(GeV/c) < 2.6 T p 2.3 <]
2Invariant Mass [GeV/c
0.7
0.8
0.9
1
1.1
)
2/(25 MeV/c
310
×
Counts
0
0.5
1
1.5
2
2.5
K
+π
-+ K
-π
+(b)
*0K
+Au
d
contribution φ (GeV/c) < 2.6 T p 2.3 <]
2Invariant Mass [GeV/c
0.7
0.8
0.9
1
1.1
)
2/(25 MeV/c
310
×
Counts
0
1
2
3
4
5
K
+π
-+ K
-π
+(c)
*0K
Cu+Cu
contribution φ (GeV/c) < 2.6 T p 2.3 <FIG. 4. (color online) The invariant mass distributions of Kπ candidates, where K is identified in TOF and π is matched in PC3, in the range 2.3 < pT < 2.6 GeV/c for (a) p+p, (b) d+Au, and (c) Cu+Cu collisions at √s
N N = 200 GeV. The
distributions are shown after subtraction of the mixed event background and the correlated background from misidentified φ→ K+K−and K0
S→π+π−decays (see text for details). The distributions are fitted to the sum of the RBW function for the
signal and a polynomial (second order in p+p and third elsewhere) for the background shown with solid red line. The residual background is also shown separately with blue dashed line. The φ contribution is shown by the magenta colored histogram.
nal and residual background. The invariant mass dis-tribution is fitted, as explained above and the residual background contribution is obtained by integrating the background component of the fit (second or third or-der polynomial) in the same mass window. The resid-ual background contribution is subtracted from the total signal to obtain the raw yield for K∗0 meson.
C. Calculation of invariant yield
The invariant yields of K0
S and K∗0mesons are
calcu-lated by 1 2πpT d2N dpTdy = 1 2πpT∆pT∆y × N Yraw evtǫ(pT) BR × Cbias ǫtref f , (4) where Yrawis the meson raw yield (see Sections III A and
III B), Nevt is the number of sampled events in the
cen-trality bin and ǫ(pT) includes geometrical acceptance,
re-construction efficiency, and occupancy effects in the high multiplicity environment of heavy ion collisions. The branching ratio (BR) for K0
S → π 0π0
is 30.69 ± 0.05% (BR for π0
→ 2γ is 98.823 ± 0.034%). The branching ratio for the K∗0 → K+π− is close to 67%. The
trig-ger bias correction Cbias is 0.69 [16] for p+p collisions
and for d+Au collisions it varies from 1.03 to 0.94 [30] with increasing centrality. The trigger bias correction in Cu+Cu collision system is taken equal to unity in all an-alyzed centrality bins. The ERT efficiency for K0
S meson
ǫtref f determines the probability of KS0 → π 0π0
→ 4γ
decay products to fire the ERT. For the K∗0 which uses
no additional trigger, ǫtref f = 1.
The invariant cross section in the p+p system is given by : Ed 3σ dp3 = σ inel pp × 1 2πpT d2N dpTdy , (5) where σinel
pp = 42.2 ± 3 mb [39] is the total inelastic cross
section in p+p collisions at√s = 200 GeV. The reconstruction efficiency for the K0
S and K∗0
mesons are obtained from Monte Carlo simulations. Both the K0
S and K∗0mesons are generated using single
parti-cle event generator Exodus [56]. The primary mesons are decayed into the measured channel and all particles are traced through the PHENIX setup using the geant [57] based PHENIX simulation package. The decayed parti-cles are reconstructed using the same analysis procedures as used in the analysis of real data. The reconstruction efficiency is calculated as the ratio of the number of re-constructed mesons counted in the same way as in data, to the number of generated mesons. Due to high detector occupancy in Cu+Cu collisions, the reconstruction effi-ciency becomes smaller due to hit and cluster merging in detector subsystems. To take this effect into account the reconstruction efficiencies for K0
S and K∗0 mesons
were determined after embedding the simulated signals in real events. The K∗0 meson reconstruction efficiency in
Cu+Cu is reduced by ∼ 5% in the most central collisions and by ∼ 1% in peripheral collisions. These corrections are included in ǫ(pT), as shown in Fig. 5.
The probability that one of the K0
S meson decay
prod-ucts fires the ERT trigger is estimated based on the mea-sured single photon ERT efficiency, ǫγ. The latter is
[GeV/c]
Tp
0
2
4
6
8
10
12
14
Reconstruction Efficiency
0
0.01
0.02
0.03
0.04
0.05
0.06
(a)
0 SK
[GeV/c]
Tp
0
1
2
3
4
5
6
7
8
Reconstruction Efficiency
10
-4 -310
-210
-110
Kaon Identified × 7 Unidentified Fully Identified × 5 *0K
(b)
FIG. 5. (color online) Reconstruction efficiency for (a) K0
Sand (b) K∗0for d+Au collisions. The gray band shows the systematic
uncertainty. Please refer to Table III for systematic uncertainties. Fig. (b) shows the reconstruction efficiency for the “kaon identified”, “unidentified” and “fully identified” techniques for K∗0analysis are shown by the red solid line, dotted dashed blue line and black dashed line, respectively.
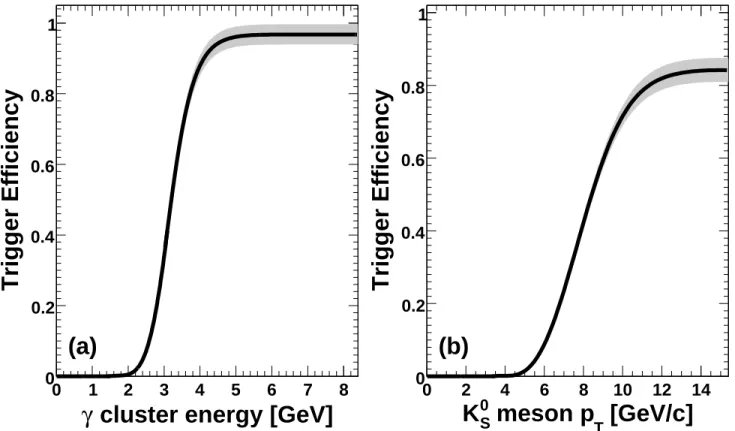
uated as the ratio of the number of clusters that fired the ERT to the number of clusters of the same energy in the minimum bias data sample. The trigger efficiency is cal-culated as a function of cluster energy separately for each EMCal sector. An example of ǫγ in one of the EMCal
sectors is shown in Fig. 6 (a) for the case of 2005 mea-surements for Cu+Cu collisions.
The trigger efficiency grows steeply with energy and reaches 50% at the energy approximately corresponding to the ERT threshold setting. The curves saturate at approximately twice the threshold energy. The level of saturation is below 100% because of inactive areas of the ERT. The trigger efficiency for K0
Smeson (ǫtref f) is
eval-uated using Monte Carlo simulation. The K0
S meson is
considered to fire the ERT if at least one of the pho-tons in the final state fires the trigger. The resulting trigger efficiency for K0
S → π 0
(→ γγ)π0
(→ γγ) is shown in Fig. 6 (b). The trigger efficiency uncertainty for K0 S
meson was evaluated by varying the single photon ERT efficiency within the uncertainties of the measurement.
D. Systematic Uncertainties
Several factors contribute to the systematic uncer-tainty of the measurement of the K0
S meson invariant
yield: the raw yield extraction, the reconstruction effi-ciency and detector acceptance and the K0
S → π 0π0
de-cay branching ratio uncertainty. Evaluation of the sys-tematic uncertainties associated with the K0
S meson raw
yield extraction is done by varying the raw yield extrac-tion method and by modifying the background shape around the K0
S peak. The π0π0 invariant mass
distri-bution is approximated by a second order polynomial outside three standard deviations from the center of the peak region. The polynomial is then interpolated un-der the peak and subtracted from it. The yield is ob-tained by integrating the subtracted invariant mass dis-tribution in a three standard deviation window around the mean of the peak. To modify the background shape the “cross π0 meson” cut is used. This cut significantly
changes the background shape in the invariant mass dis-tributions of π0π0 pairs in the vicinity of the K0
S meson
peak. If two photons with the largest energy, assigned to different π0candidates, produce an invariant mass within
±4 × σπ0(pT) from the Mπ0(pT) given in Eq. 2, the
en-tire combination of four clusters is rejected. The RMS of the corrected raw yields obtained in all combinations of yield extraction and background modification is taken as an estimate of the systematic uncertainty for the signal extraction.
The uncertainty in the reconstruction efficiency is dom-inated by mismatches in detector performance between data and Monte Carlo. The uncertainty on the EMCal acceptance is estimated by artificially increasing dead ar-eas in the EMCal by 10% and redoing the analysis. To
cluster energy [GeV]
γ
0
1
2
3
4
5
6
7
8
Trigger Efficiency
0
0.2
0.4
0.6
0.8
1
(a)
[GeV/c]
Tmeson p
S 0K
0
2
4
6
8
10
12
14
Trigger Efficiency
0
0.2
0.4
0.6
0.8
1
(b)
FIG. 6. (a) Trigger efficiency for single photons as a function of cluster energy. (b) K0
Strigger efficiency as a function of pT.
The bands show the systematic uncertainty. Results are presented for the Cu+Cu data recorded in 2005.
estimate the contribution of the EMCal energy resolution to the systematic uncertainty, the K0
S meson
reconstruc-tion efficiency is recalculated with the energy resolureconstruc-tion artificially worsen by 3%. The 3% variation of the energy resolution was chosen as a maximum value that would still provide consistency between the π0 meson widths
from real data and simulations. The contribution of the EMCal energy scale uncertainty was estimated by vary-ing the energy scale within ±1% in simulation. The vari-ation range is constrained by the π0meson peak positions
in real data and simulation. Photon conversion in the de-tector material is accounted for in the calculation of the reconstruction efficiency. However, detector materials are described in the simulation with some precision and thus an uncertainty associated with the photon conversion is introduced. The conversion correction uncertainty was estimated in Ref. [54] to be equal to 3% for the neutral pions. Thus the K0
S meson conversion correction
uncer-tainty is 6%.
The π0meson candidates are selected within two
stan-dard deviations around the π0 meson peak position in
the invariant mass distribution of two photons. The dif-ference between the π0meson width parameterizations in
real data and Monte Carlo simulations does not exceed 10%. To estimate the π0 selection cut uncertainty, the
window around the π0 meson peak position is varied by
10%. The difference between the K0
S meson
reconstruc-tion efficiencies calculated with changed and default cuts
is taken as the uncertainty related to the π0candidate
se-lection cut. The K0
S meson trigger efficiency uncertainty
is evaluated by varying the single photon ǫγ trigger effi-ciency within uncertainties of its measurement. Relative systematic uncertainties for the K0
S meson measurements
in d+Au and Cu+Cu systems are given in Table III. The uncertainties are categorized by types: A, B and C. Type A denotes the pT uncorrelated uncertainty, type B
de-notes the pT correlated uncertainty and type C denotes
the overall normalization uncertainty such as the mini-mum bias trigger efficiency in p+p and d+Au collisions, branching ratio of the parent particle, γ-conversion factor etc.
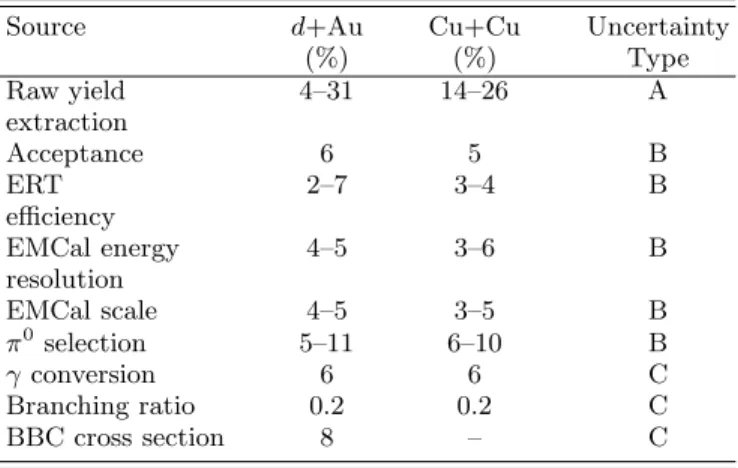
The main systematic uncertainty of the K∗0
measure-ment include uncertainties in the raw yield extraction, EMCal-PC3 matching, TOF PID cuts, track momentum reconstruction, acceptance and BBC cross section. The systematic uncertainty associated with the raw yield ex-traction is estimated by varying the fitting ranges, vary-ing the width of the K∗0 meson peak by ±2% around
its simulated value and taking the integral of the fitted RBW function instead of summing up the yield in each pT bin. In addition, the yield difference when the K∗0
meson mass is fixed to the PDG value and when it is a free parameter in the fit of the mass spectrum, is included in the systematic uncertainty. To evaluate the uncertain-ties from EMCal-PC3 matching and TOF PID cuts, the corresponding cuts are varied within ±17%. The
uncer-TABLE III. Relative systematic uncertainties in percent for the K0
S meson measurement. The given ranges indicate the
variation of the systematic uncertainty over the pT range of
the measurement.
Source d+Au Cu+Cu Uncertainty (%) (%) Type Raw yield 4–31 14–26 A extraction Acceptance 6 5 B ERT 2–7 3–4 B efficiency EMCal energy 4–5 3–6 B resolution EMCal scale 4–5 3–5 B π0selection 5–11 6–10 B γconversion 6 6 C Branching ratio 0.2 0.2 C BBC cross section 8 – C
tainty in momentum reconstruction is estimated by vary-ing the momentum scale within 0.5% in the simulation. A summary of the systematic uncertainties for the case of “kaon identified” analysis technique in p+p, d+Au and Cu+Cu collisions is given in Table IV.
IV. RESULTS AND DISCUSSIONS
In this section we present pT spectra of KS0 and K∗0
mesons in p+p, d+Au and Cu+Cu collisions at √sN N = 200 GeV. The invariant pT spectra are used to calculate
the nuclear modification factors in d+Au and Cu+Cu collisions at different centralities. These nuclear modifi-cation factors are compared to those previously measured for neutral pions, charged kaons, φ mesons and protons.
TABLE IV. Relative systematic uncertainties in percent for the K∗0 meson measurement in “kaon identified” technique.
The given ranges indicate the variation of the systematic un-certainty over the pT range of the measurement.
Source p+p d+Au Cu+Cu Uncertainty (MB) (MB) Type (%) (%) (%) Raw yield 5–8 7–12 2–4 A extraction Acceptance 1–5 3–7 1–3 B Track Momentum 1–4 2–7 1–5 B reconstruction Track Matching 1–4 4–7 2–13 B TOF PID 1–6 4–9 1–4 B BBC cross section 10 8 – C
1
2
3
4
5
6
7
8
-2mb [GeV/c]
dy
Tdp
σ
2d
Tp
π
2
1
-610
-510
-410
-310
-210
-110
1
)/2 *0 K + *0 (K Kaon Identified Unidentified Fully Identified Tsallis function STAR, |y| < 0.5 = 200 GeV s at p + p(a)
[GeV/c]
Tp
1
2
3
4
5
6
7
8
Data/Fit
0.5
1
1.5
(b)
FIG. 7. (color online) (a) K∗0meson invariant yield as a
func-tion of pT obtained with the “kaon identified”, “fully
identi-fied” and “unidentiidenti-fied” analysis techniques in p+p collisions at√s= 200 GeV. The systematic uncertainties shown with boxes are mostly uncorrelated between analysis techniques. The solid blue line is the Tsallis function fit to the combined data points. The star symbols are the K∗0 meson measure-ments from the STAR collaboration [40]. (b) Ratio of the yields obtained with the three analysis techniques to the fit function. The scale uncertainty of 10% is not shown.
A. Invariant transverse momentum spectra
Figure 7 (a), shows the invariant yield of K∗0 mesons
as a function of pT in p+p collisions at√s = 200 GeV.
Experimental points shown with different symbols corre-spond to the different analysis techniques listed in Ta-ble II. The systematic uncertainties, mostly uncorrelated for different techniques, are shown along with the data points and include raw yield extraction, track matching and TOF PID uncertainties listed in Table IV.
The solid line in Figure 7 (a) is the result of a common fit of the data with the Tsallis function in the form used