MIT
ICAT
MIT
ICAT
A
N
A
NALYSIS OF THE
D
YNAMICS OF THE
US C
OMMERCIAL
A
IR
T
RANSPORTATION
S
YSTEM
Ryan Tam and R. John Hansman
Report No. ICAT-2003-2
May 2003
MIT International Center for Air Transportation
Department of Aeronautics & Astronautics
Massachusetts Institute of Technology
A
NA
NALYSIS OF THED
YNAMICS OF THEUS C
OMMERCIALA
IRT
RANSPORTATIONS
YSTEMBY
R
YANT
AM ANDR. J
OHNH
ANSMAN, J
R.
A
BSTRACT
Major trends in the airline industry are analyzed to highlight key dynamics that govern the US
domestic air transportation system. The hypothesis is that air travel supply and demand
equilibriums, a reliance on outside capital, and intra-industry competition are among the most
critical forces that are driving the current restructuring of the airline industry. Data on airline
operational and financial performance is used to trace these dynamics as the industry evolved
through periods of industry deregulation, an economic growth bubble, and the aftermath of the
attacks of September 11, 2001.
The thesis identifies the post-deregulation development of hub-and-spoke networks and yield
management systems as the key forces that would set the stage for a bifurcation of the air travel
market during a cycle of economic growth in the late 1990’s. During this bubble economy, the
dynamics of supply and demand fundamentally shifted as the major carriers focused on
high-revenue, high-cost operations and travelers began to flock to newer low-fare, low-cost carriers.
With the end of the economic growth cycle in 2000, the bifurcation of the airline industry began
to affect revenues and profits at the major carriers. Massive and unprecedented industry losses
would ensue, and would be compounded by the attacks of 9/11.
Airline operational strategies in response to 9/11 and longer-term restructuring efforts are
discussed in order to further identify the key dynamics affecting the air transportation system.
These dynamics are synthesized and then discussed within the broader context of the air
transportation system, the impact of air travel on the economy and mobility, and the role of
government.
This document is based on the thesis of Ryan Tam submitted to the Department of Civil and
Environmental Engineering at the Massachusetts Institute of Technology in partial fulfillment of
the requirements for the degree of Master of Science in Transportation.
A
CKNOWLEDGEMENTS
This work was supported by the MIT Global Airline Industry Program under a grant from the
Alfred P. Sloan Foundation. The authors would like to acknowledge the work of Nida Rizwan
Farid, Aleksandra L. Mozdzanowska, Ian Garrick-Bethell, and Suzanne San Guliano, who all
helped with data plots and analysis over the last year. Other students in the International Center
for Air Transportation provided valuable intellectual and technical assistance, including Tom
Gorin, Francis Carr, Terran Melconian, Alex Lee, Liling Ren, Nathan Doble, Bruno Miller.
Table of Contents
Abstract...3 Acknowledgements...5 Table of Contents ...7 List of Figures...8 List of Tables...10 List of Abbreviations...11Chapter 1: Introduction and Background...13
1.1 Air Transportation and the Economy...14
1.2 Research Methodology ...16
Chapter 2: Post-Deregulation Evolution...19
1.1 Deregulation...19
1.2 Network Development...20
1.3 Other Industry Trends ...23
Chapter 3: The Internet Bubble...25
1.1 The Bubble Economy ...25
1.2 Airline Strategies ...26
1.3 Change in Passenger Dynamics...30
1.4 The Bubble Pops...33
Chapter 4: 9/11 and Industry Recovery ...35
1.1 Industry Performance...35
1.2 Operational Response to 9/11 ...40
1.3 9/11 and Restructuring...45
Chapter 5: Analysis and Outlook ...51
1.1 Summary Observations...51
1.2 Impacts...53
1.3 Conclusion ...55
Notes ...57
List of Figures
Figure Page
1-1 Conceptual model of air transportation system and the economy...14
1-2 Growth of GDP and RPMs, 1954-2000 with economic recessions...15
1-3 Annual Change in GDP and Domestic RPMs with economic recessions, 1954-2000 ...15
1-4 Airline industry net profit and losses with economic recession data, 1965-2001...16
1-5 US Major domestic and international RPMs, 2001 ...17
2-1 RPMs before and after deregulation ...20
2-2 RPM and ASM growth, 1954-2002 ...20
2-3 Example of a hub-and-spoke network showing routes served by Delta Air Lines from its Atlanta hub in July 2000...21
2-4 Histogram of scheduled weekday arrivals per 15-minute interval at Atlanta for selected years between 1965 and 2000 ...22
2-5 Southwest point-to-point network, Summer 2000...23
2-6 Declining real yields after deregulation (in 1978 dollars) ...23
2-7 Average industrywide domestic load factors, 1954-2002...24
3-1 Net profits at US major carriers, 1990-2000...26
3-2 Increase in market capitalization of US major carriers, 1990-2000 ...26
3-3 Histograms showing distribution of one-way airfares purchased between New York-JFK and Los Angeles for selected years on American Airlines ...27
3-4 Plot showing growth of domestic routes operated by regional jet aircraft ...28
3-5 Growth in labor cost components per ASM at US Majors, 1984-2001...29
3-6 Boeing Airplane Deliveries through April 2003...30
3-7 Domestic market share of US Majors and other carriers, 1991 and 2001...31
3-8 Quarterly change in GDP, 1990-2002...32
3-9 Downshift in fare types...32
3-10 Year-over-year change in domestic airfares, 2000-2001 ...33
3-11 Market capitalization of selected US major carriers, 1995-2001 ...33
4-1 Domestic traffic in RPMs, 2000-2003 ...36
4-2 Domestic capacity in ASMs, 2000-2003 ...36
4-3 RPMs as percentage of 1999 levels, 2000-2003...36
4-4 Average domestic load factors, 2000-2003...36
4-5 Annual change in average domestic airfare...37
4-6 Domestic breakeven and actual load factors...37
4-7 Quarterly profits of selected US major carriers ...38
4-9 Relative share of market capitalization, US majors with Jet Blue...38
4-10 Major airline stock prices in the months before and after 9/11 ...39
4-11a Plot of relative Market Capitalization in March 2003 vs. RPM Share in February 2003 ...39
4-11b Plot of change in relative market capitalization and major RPM share, August 2001 to March 2003 ...40
4-12 Histogram of scheduled departures per 15-minute period showing elimination of last hub “bank” after 9/11 ...42
4-13 Histogram showing conversion to rolling hub schedule at Dallas-Ft. Worth ...42
4-14 Comparision of block-hour operating costs, B727-200 vs. A320 at United Airlines, 2000...43
4-15 Domestic spot fuel prices, 1999-2003 ...44
4-16 ATC Delays, 1999-2003 ...45
4-17 Expansion of Scheduled ASMs, JetBlue and AirTran ...46
4-18 Federal taxes and airport facility charges as a percentage of total ticket price...48
5-1 Curve-fit projection of increasing oscillating profits and losses based on industry net profits and losses...53
List of Tables
Table Page
4-1. Status of ATSB loan guarantee program...47 4-2. Breakdown of taxes on a hypothetical single-connection round-trip w/ $4.50 PFC ...48
List of Abbreviations
Abbreviation Description
9/11 Terrorists attacks on the United States, September 11, 2001 ATA Air Transport Association
ATC Air Traffic Control
ATSB Air Transportation Stabilization Board ASM Available seat mile
BEA Bureau of Economic Analysis BTS Bureau of Transportation Statistics CAB Civil Aeronautics Board
CASM Cost per available seat mile CRS Computer reservation system DOT Department of Transportation GDP Gross domestic product
IATA International Air Transport Association OAG Official Airline Guide
OAI Office of Airline Information
RJ Regional jet
RASM Revenue per available seat mile RPM Revenue passenger mile
WRDS Wharton Research Data Services
DOT Airline Classifications
Majors Over $1 billion in revenues
Nationals Revenues between $100 million and $1 billion Regionals Revenues less than $100 million
The attacks of September 11, 2001 and the current financial crisis within the airline industry have
highlighted the critical instabilities in the structure of the US air transportation system. Although changes in traffic, declining revenues, and increased costs were all issues which were structurally present well before 9/11, the subsequent operational changes has made it easier to identify their effects on airline performance. Capacity and customer service issues—aside from security delays—were removed from the equation. Airline profitability has clearly emerged as the key issue facing the US airline industry today. This thesis attempts to explore the dynamics of the air transportation system—looking at recent responses to major shocks and fundamental changes in the relationship between supply and demand. Starting with an overview of major industry forces since deregulation, the thesis will look at how airline strategies during the economic boom of the late 1990’s may have set the stage for the current restructuring efforts. These longer-term trends will be set within the context of industry responses and strategies after the attacks of September 11, 2001 in order to look at the robustness of the air transportation system and provide some guidance as to how air mobility could be stabilized and preserved.
The air transportation system is an extremely complex, and airline actions are driven by a host of different factors—including competition, finance, organizational structure, consumer demand, and even technology. Although much has already been written in the media or academic journals on the airline industry, the goal of this thesis is to bring together current trends and information in a holistic manner. By identifying the key dynamics and interrelationships within the air transportation system, this paper should also inform subsequent research and modeling investigations into the relationship between air transportation, the economy, and society.
Chapter 1:
1.1 Air Transportation and the Economy
One of goals of this thesis is to begin to understand and evaluate the dynamics at play within the airline industry and the broader air transportation system. Simple conceptual models can be useful at structuring such analyses and enabling key relationships to be identified and expanded. Sussman uses the CLIOS framework to understand the complexity, scale, integration, and openness of transportation systems.1
While air transportation is clearly a CLIOS, an analysis of its dynamics also needs to account for the industry forces that regulate the supply and accessibility of its services.
Yet the openness and integration of the system makes these industry forces highly subject to a range of motivating factors and dynamics that cannot necessarily be modeled or documented in their entirety. Even relatively obscure details such as executive compensation packages can affect airline strategies; hidden motivations to force a company into liquidation, for example, could play a role in pricing strategies and overall industry competition. Porter’s five forces model also attempts to understand the competitive intra-industry dynamics, but does not look at the broader role of the transportation system.2
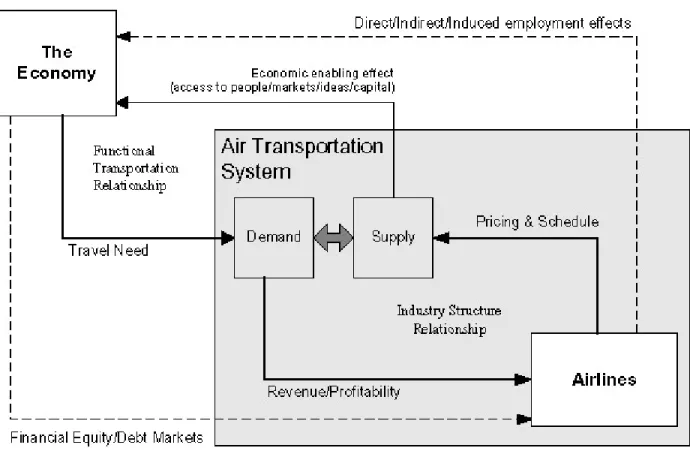
To better understand the air travel supply and demand relationships with the larger US economy as well as with individual airline companies, a conceptual model was developed. Figure 1-1 shows this model of the relationship between the economy and the air transportation system. The model sets up the external relationship between the economy (shown in the upper left corner) and the air transportation system (shaded in gray on the lower right). The internal relationship between the air travel supply-demand equilibrium and the airline companies is shown within the gray box.
The economy generates a Travel Need which creates the Demand for air transportation services. The
Supply of air transportation services, in turn, provides an Economic Enabling Effect that creates access
to people, markets, ideas and capital and thus enables the economy to function at a regional or national level. These relationships between Supply, Demand, and the Economy illustrate the basic macro functionality of the air transportation system. Economic growth in the mid-1990’s caused growth in air travel and enabled the airlines to rethink their business strategies. The subsequent economic recession, however, caused a major downturn in travel demand. The economy exhibits cyclical characteristics, however, and the demand for business and leisure travel should return as the economy recovers. The model further illustrates how the internal structure of the Air Transportation System (gray box) is based on the profitability of the airline industry. This internal feedback loop connects the demand for air travel to airline revenues and the supply of air transportation. Airlines control the Supply of air transportation by modifying Prices, Networks, and Schedules, which in turn have a major impact on the
Demand for air transportation services.
Finally, the model also shows the traditional financial relationships between the economy and the airline industry (shown in dashed lines). The Economy influences the ability of the Airlines to secure capital Equity and finance Debt. Employment and spending by the airlines, in turn, have Direct, Indirect, and Induced impacts on the economy. The performance of the economy also generally affects how the capital markets support and invest in the airline industry.
Economic Cycles and the Airline Industry
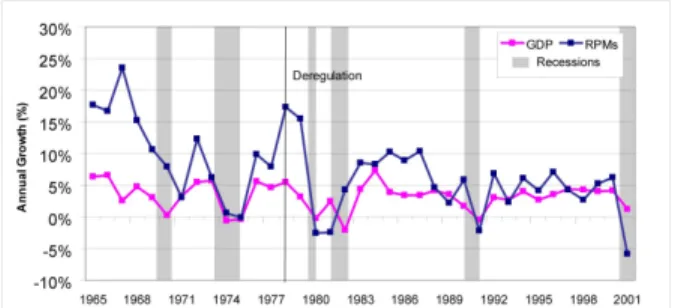
The close linkages between air travel and the economy makes the airlines extremely subject to cyclic forces of market supply and demand. The economy is one of the forces that plays a key role in shaping the airline industry, and the growth of air travel has historically tracked with that of basic economic performance. This relationship can be seen by analyzing increases in the US Gross Domestic Product (GDP) alongside the growth of domestic air travel. Constant 1996 dollars were used to measure the relative increase in GDP between 1954 and 2001, while air travel was measured using Revenue Passenger Miles (RPMs). Periods of economic recessions as identified by the National Bureau of Economic Research were also highlighted in gray3. Figure
1-2 illustrates that the growth of air traffic has historically tracked with the rise in GDP, and that rises in enplanements followed those for GDP. The annual percentage change in RPMs and GDP was also analyzed in order to further investigate this relationship. Figure 1-3 confirms that there was a close correlation between annual economic growth and air travel, as changes in one were always
Figure 1-2: Growth of GDP and RPMs, 1954-2000 with economic recessions. Source: US
BEA and BTS data with NBER classification of recession periods.
Figure 1-3: Annual Change in GDP and Domes-tic RPMs, 1954-2000 with economic recessions.
Source: US BEA and BTS data with NBER classifi-cation of recession periods.
accompanied by changes in the other.
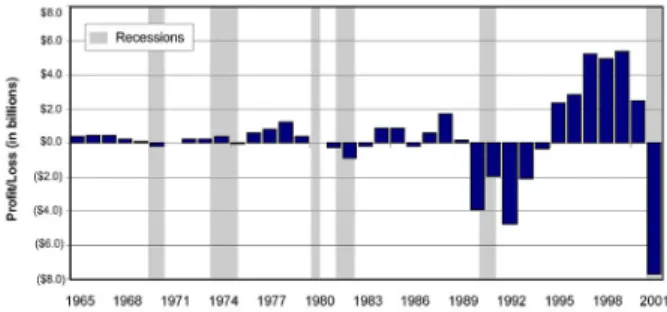
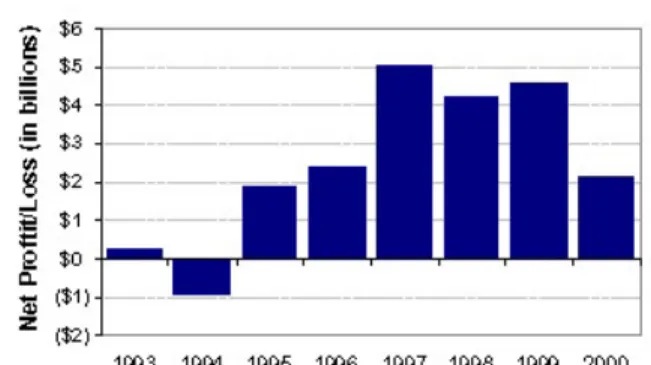
The cyclic nature of the economy and the demand for air travel can also be seen in the performance of airline profits. Historically, periods of successively higher profits in the US airline industry during the 1960’s 1970’s, 1980’s, and 1990’s were followed by record losses. Figure 1-4 depicts the net profits and losses of the US major, national, and regional passenger and cargo airlines in current-year dollars. Losses in the airline industry generally also corresponded with the periods of economic recessions shaded in gray. The cycles of profits and losses have also exhibited an exponentially growing oscillatory profit and loss behavior since the deregulation of the airline industry in 1978.
As such, periods of successfully record profits have been similarly followed by periods of record losses. The airline industry lost $1.4 billion during the economic recession of the early 1980’s. This was
followed by an up-cycle between 1984 and 1989, when the industry earned a total of $3.8 billion. During the next recession and down-cycle between 1990
and 1994, the industry lost an unprecedented $13.1 billion dollars—but this itself was overshadowed by record profits of $23 billion dollars between 1995 and 2000. These gains were quickly wiped out, however, as the industry lost over $7 billion dollars in 2001 and over $11 billion dollars in 2003.
The marketplace of air travel also exhibits fundamentally cyclic characteristics, as airline profits are tied to supply and market prices. Increased airline profits encourage new airlines to enter the market and existing airlines to increase
their own supply and gain market share. Similarly, reductions in profit are theoretically linked to reductions in supply, although operational constraints make it easier to use pricing to manipulate supply rather than physically removing capacity.
In general, understanding the dynamics of these cycles can help to indicate whether or not they will persist over time and have a longer-term effect on the air transportation system4. This can also help
to find key relationships within the system that are not fundamentally linked to cyclical trends. As will be seen in subsequent chapters, the changes in stock prices and the withdrawal of capital from the airline industry shows that investors have decoupled themselves from the cycles of airline industry—a fundamental change to the airline business and one which will possibly require new strategies to preserve domestic air service connectivity.
1.2 Research Methodology
To identify the key dynamics and recent changes within the air transportation system, this thesis uses a case-study analysis of individual airlines and on the industry as a whole. The analysis looks at macro-level industry-wide trends and micro-macro-level individual airline strategies in order to more fully examine the motivations and dynamics within the air transportation system. The recent impacts of and responses to major exogenous shocks to the airline industry such as the attacks of 9/11 will be also used to highlight the dynamics of the air transportation system.
Figure 1-4: Airline industry net profit and loss-es with economic recloss-ession data, 1965-2001.
Airline strategies and key trends have been primarily identified through airline media releases, media reports, and other sources. Standard industry financial and operating performance data is being synthesized with other media reports and sources to corroborate these trends. Data sources include the US Department of Transportation DB-1A ten-percent sample of ticket receipts and the Form 41 database of traffic and airline operating statistics. Industry stock prices and market capitalization data were also tracked and analyzed to look at the relationship between the financial markets and the airline industry. Airline schedule data from the Official Airline Guide, individual carrier timetables, and the FAA Enhanced Traffic Management Database System were also used to analyze the operational changes to airline networks. In general, the thesis concentrates on a network-level analysis of the air transportation system, and does not get into specific analyses of
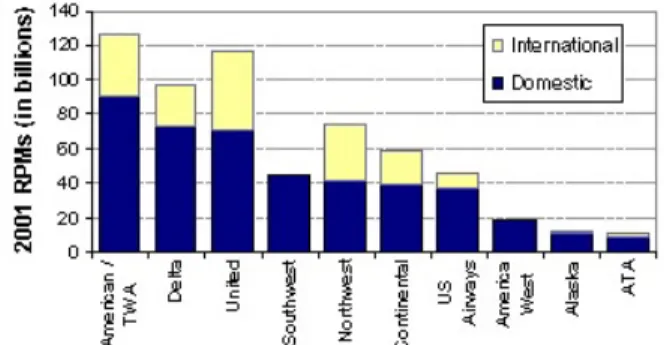
competition on specific routes or travel markets. The thesis is focused primarily on analyzing the position and strategy of the ten major US carriers. Monthly air carrier traffic data on domestic and total system-wide revenue passenger miles was used to compare the relative market size of the ten major US carriers. This is shown in Figure 1-5, and the carriers are sorted by domestic market share from left to right. It was also found that these carriers collectively accounted for 86 percent of the total domestic revenue passenger miles in 2001.5 Six of these carriers—American,
Continental, Delta, Northwest, United, and US Airways—all operate large, multi-hub networks with extensive international connections and large regional commuter feeder services. These airlines are also among those in the most severe financial jeopardy after the downturn in 2000. The other four major carriers differ in network size, operating philosophies, and cost structures and thus almost share more commonalities with low-cost carriers such as AirTran or JetBlue.
The low-cost model pioneered by Southwest Airlines is the primary antithesis to big network carriers, and its integrated national point-to-point network was able to sustain its profitability throughout the current industry crisis. America West and Alaska have significantly smaller operations than the other major carriers, but have the advantage of lower cost structures than the other majors due to bankruptcies and restructuring during the mid-1990s. ATA operates a more limited network of charter and scheduled services, and it only recently achieved status as a US major carrier when revenues surpassed $1 billion dollars in 1999.6 The emergence of smaller low-cost carriers has also had a major impact on the airline
industry in recent years, however, and the impact of AirTran and JetBlue will also be discussed.
It should be noted that while intercontinental connectivity is one of the key roles of aviation, this thesis focuses on the role of domestic air travel in the United States. One of the underlying motivations behind this thesis was initially to understand how the connectivity of the air transportation system provides a strategic advantage for the US by facilitating enhanced regional and national economic and social integration. Although this analysis largely ignores the feedback effects of employment and mobility on the economy, these impacts are significant. It is estimated that US commercial aviation was responsible for over $800 billion dollars in direct, indirect, and induced employment in 2000—about 8 percent of the US economy.7 Although identifying and accounting for the economic opportunity benefits from
connectivity and mobility is outside the scope and capability of this thesis, it nevertheless remains a worthy challenge which is faced by the airline industry and governments alike.
Figure 1-5: US Major domestic and internation-al RPMs, 2001. Source: US DOT Form 41 data,
The deregulation of the airline industry in 1978 triggered a set of dynamics that would reshape the air transportation system and set the stage for dramatic growth in domestic air travel. The industry developed comprehensive national hub-and-spoke systems to expand the scope and connectivity of their route networks, while yield management systems gave the airlines pricing power to manipulate demand to match supply. Low-fare carriers also brought the dynamics of price competition and cost control into the airline industry. Indeed, many of these dynamics that emerged after deregulation still plague the airline industry today. This chapter will describe the structural evolution of the airline industry and will set the context for subsequent discussions on the dynamics during and after the Internet economic boom of the late 1990’s.
2.1 Deregulation
Prior to 1978, the Civil Aeronautics Board (CAB) regulated entry, routes, and fares7 in order to promote
stability in the air transportation system. It was felt that the production economies of scale would eventually lead to monopolies and degraded service, and the avoidance of excessive competition would help to maintain the system.8 Amidst a wave of political support for deregulation and a growing body
of academic research that disputed these long-held beliefs, administrative deregulation actually began as early as 1975. The Airline Deregulation Act of 1978 eliminated CAB authority over routes and domestic fares.
The supply of and demand for domestic air transportation grew dramatically after deregulation. In order to fully document the changes in the supply of air transportation, the growth in passenger traffic
Chapter 2:
and airline capacity was analyzed. The growth in domestic capacity was measured in terms of Available Seat Miles (ASMs), while Revenue Passenger Miles (RPMs) were used to measure traffic. Figure 2-1 shows that scheduled RPMs grew considerably faster after deregulation than in the period between 1954 and 1978. Between 1954 and 1978, RPMs grew at an average annual rate of 5.8 million RPMs per year, but this more than doubled during the period between 1978 and 2002 to an average rate over 11.7 million RPMs per year. Airline capacity grew accordingly with this increased demand. Figure 2-2 shows the growth of scheduled ASMs together with the growth in RPMs. Scheduled annual ASMs increased from 300 billion in 1978 to over 700 billion by 2000.
2.2 Network Development
A fundamental restructuring of the air
transportation system occurred after deregulation as the industry consolidated and developed hub-and-spoke networks. Defacto hubs had naturally developed in large regional centers such as
Chicago, Atlanta, and Dallas. The large population
and economic nodal function of these major cities created large markets for local traffic and supported a natural concentration of flights. Interline connections between airlines were commonplace and frequent. The Civil Aeronautics Board, however, generally limited the extent to which airlines could buildup their operations at any single airport in order to preserve local competition.
After deregulation, however, airlines moved to develop their individual hubs and to capture as much online connecting traffic as possible. Vertical consolidation throughout the industry occurred as airlines developed regional feeder services using turboprop aircraft and acquired international route authorities. Horizontal consolidation was also undertaken through mergers and acquisitions—creating instant nationwide or regional networks. While the hub-and-spoke concept was not new, the development of comprehensive route networks became one of the primary dynamics that drove the airline industry in the years after deregulation. The dominance of these hub-and-spoke networks would affect the intra-industry dynamics well into the 1990’s.
Hub-and-Spoke
The relaxation of CAB controls enabled airlines to actively build coordinated route systems to increase network scope and market share. These hub-and-spoke systems funneled passenger connections from multiple cities through a central hub. This enabled the maximum number of city-pair combinations to be covered with a minimum number of flights. This consolidation of demand offered fundamental economies of scale—enabling service to smaller cities or other weak markets that wouldn’t otherwise
Figure 2-2: RPM and ASM growth, 1954-2002.
Source: US DOT and ATA data.
Figure 2-1: RPMs before and after deregula-tion. Source: US DOT and ATA data.
be covered in a point-to-point network. The difference is that in a point-to-point network, each route needs to support itself based on the local traffic between those two cities. In contrast, new cities can be added and justified to a hub-and-spoke networks based on the incremental revenue generated to the entire network.
Two other characteristics of hub-and-spoke systems made them extremely popular service strategies. The first is that by being able to consolidate smaller, more discrete levels of demand to more destinations, a hub-and-spoke system would enable a given airline to support more frequent services out of any given airport. The increased frequency would give the airline a greater market shareand would enable them to better serve the needs of time-sensitive, high-revenue business travelers.
The second characteristic is that hub-and-spoke systems gave airlines a strategic advantage on the display screens of computer reservation systems (CRS). Hub and spoke systems would enable airlines to offer more frequencies and thus display a greater presence to travel agents—increasing the likelihood of making a sale. The logic behind CRS displays also encouraged airlines to create tightly scheduled operations at major hubs. Because travel times were used to rank the order of display on flight screens, airlines had an incentive to offer the fastest travel time between two places. Airlines concentrated flight arrivals and departures at hub airports into extremely narrow time windows in order to minimize the ground time between connecting flights. This peaking effect also would dictate greatly increased terminal requirements and staffing requirements at hub airports—resulting in increased employment and major terminal expansion projects during the 1980’s and 1990’s.
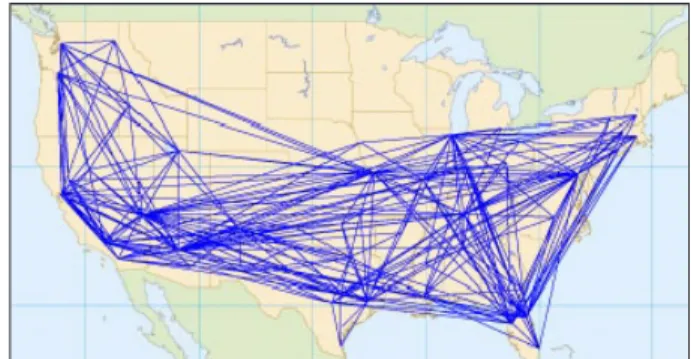
The growth of hub-and-spoke operations can be illustrated by an analysis of historical operations at one airport. During 2001, Atlanta’s Hartsfield International Airport was the busiest airport in the world in terms of enplanements (75.8 million passengers), and the second busiest in terms of aircraft operations (890,000 movements). As shown in Figure 2-3, Atlanta is a large transfer hub for Delta Airlines and its regional affiliates. Together, they operated 850 flights per day to 133 destinations in the contiguous United States on an average day during Summer 2000. Flights to and from Atlanta accounted for 40 percent of the Delta’s entire domestic operations.
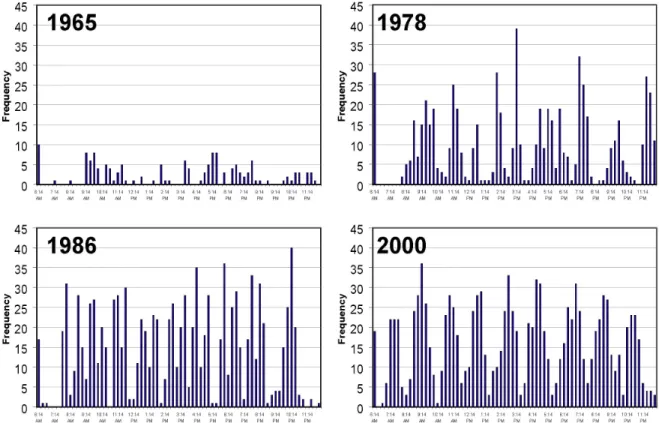
To show the evolution of the hub and the growth of the highly connected hub-and-spoke bank structure, the OAG flight schedule data for all carriers at Atlanta was analyzed at selected intervals between 1965 and 2000. Figure 2-4 illustrates the evolution of the banking structure using a histogram of all scheduled flight arrivals in 15-minute increments on an average summer weekday.9 The plot for 1965
shows a concentration of scheduled flights around the mid-morning and late afternoon periods. In 1978, the development of the bank structure is already starting to be evident. The banking structure can be identified in the 1986 analysis by the high peaking of flights—between 25 and 40 flights per 15-minute period, although the presence of two major airline hubs (Delta and Eastern) shows the effect of competition at that time. The full nine-bank structure had been clearly developed by 2000.
Figure 2-3: Example of a hub-and-spoke net-work showing routes served by Delta Air Lines from its Atlanta hub in July 2000. Source: OAG
Industry Consolidation
In the two decades after deregulation, the airline industry went through a period of significant consolidation as airlines merged or liquidated their assets. Airline acquisitions or mergers often complemented the development of hub-and-spoke systems—enabling airlines to feed their networks with regional and international traffic and increasing their market share and scope. When Delta acquired Western in 1986, it picked up a hub in Salt Lake City as well as a strong presence along the West Coast. Pan Am’s sale of its Pacific Division in 1986 enabled United to merge a relatively strong domestic transcontinental network with a large international feed. In addition, smaller, twin-engine long-range aircraft also enabled inland regional hubs like Atlanta or Dallas to become international gateways—thus increasing the strength and overall strategic importance of major hubs.
Industry consolidation also came about as a result of liquidation. While numerous startup carriers failed during the years after deregulation, some larger and more notable carriers such as Braniff, Eastern, and Pan Am were also liquidated. Although these failures did remove large amounts of capacity from the industry, the overall net impact was less due to the smaller market share presence. Consolidation also occurred over time as airlines pulled out of entire markets and eliminated smaller hubs. During the economic recession of the early 1990’s, American and USAir effectively closed down their west coast operations and smaller hubs at Raleigh-Durham, Dayton, and Nashville.
Figure 2-4: Histogram of scheduled weekday arrivals per 15-minute interval at Atlanta for selected years between 1965 and 2000 shows the evolution of tight hub-and-spoke banking structure.
2.3 Other Industry Trends
Other trends after deregulation include included early competition from low-fare carriers, the
development of customer loyalty programs, and the implementation of yield management systems. These trends would shape the relationship between low-fare and major network carriers, and would set the stage for the evolution of the industry dynamics during the internet economic bubble. Yield management and network size made the major carriers relatively immune to the competition from these early low-fare carriers. This coexistence seemed to suggest that the airline industry could survive with these two radically different business models—thus enabling the big network carriers to target high-revenue passengers and sustain high-cost operations.
A number of new startup airlines entered the market after deregulation to compete with the established carriers. In the early 1980’s, airlines like People Express developed niche low-fare, no-frills strategies to stimulate the demand for low-cost travel. While these low-fare carriers were popular, they did not have a significant impact on the long-term structure of the industry for a variety of reasons. The major network carriers had only limited exposure to
low-cost competition, since they did provide a substantially different product with larger route networks, higher levels of customer service, and new frequent flyer programs. In addition, issues with airline reputation, safety, and convenience presumably outweighed the cost savings for many passengers. Poor management and rapid expansion also sent many startup carriers into liquidation. Nevertheless, there were a few notable exceptions. Southwest Airlines was able to begin expanding its successful point-to-point network model beyond Texas into other parts of the country. With a
sustainable growth strategy of serving city-pair markets with relatively high volumes of local traffic, Southwest was able to gradually build its reputation and niche base of low-fare customers. The point-to-point route network for Southwest on a typical weekday in summer 2000 was plotted using OAG data and is shown in Figure 2-5. This point-to-point network shows a distinct contrast from the centralized hub model used by Delta at Atlanta and other major carriers elsewhere.
One major reason that limited the impact of low-cost carriers in the early years after deregulation was the development of yield management systems. Advances in seat inventory control and automated pricing systems enabled the major carriers to effectively
compete with low-fare airlines without diluting their entire inventory and revenues. By offering different prices for virtual groupings of seats, the airlines could offer a range of fares differentiated by both price and other ticketing restrictions. It enabled airlines to offer low fares to stimulate demand and sell-off excess seat inventory while preserving the revenue from passengers willing to pay higher fares. The ability to increase load factors and maximize revenues effectively insulated the majors from the early low-cost carriers, and gave them a way to compete.
Figure 2-5: Southwest point-to-point network, Summer 2000. Source: OAG data.
Figure 2-6: Declining real yields after deregula-tion (in 1978 dollars). Source: ATA data.
Yield management resulted in increased load factors and increased airline profitability. The impact of these practices was analyzed at the industry level by looking at historical data on airline revenue and traffic. Airline yields (the average price paid per passenger-mile) were examined using constant 1978 dollars in order to account for inflation. Figure 2-6 shows that the average yield has been continually declining since the 1960s, although this decline slowed in the 1990s. At the same time, Figure 2-7 shows that the average industry domestic load factors increased from about 60 percent in 1978 up to 72 percent in 2000. This indicates that even though prices on average were going down, airplanes had more seats filled and were thus generating more revenue per flight.
Figure 2-7: Average industrywide domestic load factors, 1954-2002. Source: US DOT Form
The economic boom of the late 1990’s affected the dynamics of supply and demand as airlines adjusted their operating strategies and passengers modified their travel behavior. While these dynamics enabled record industry profits, the hypothesis is that these changes set the stage for heavy losses once the economic growth began to slow. The factors identified in this chapter include changes to the pricing and availability of airline seats as well as modifications to airline route networks and fundamental cost structures. In addition, changes in the demand for and attitudes towards low-cost air travel began to increase the effects of competition between different segments of the airline industry. Altogether, these factors would ultimately shape airline strategies in dealing with the economic downturn and events of 9/11.
3.1 The Bubble Economy
Here, the notion of the “bubble economy” is used to refer to the dramatic US economic growth during the mid-to-late 1990’s. This growth cycle was partially fueled by the development of the internet and the investment boom in startup dot-com companies. Between 1992 and 2000, the real gross domestic product increased by $2.3 trillion in 1996 dollars,10 while annual growth rates ranged from 2.7 to 4.1 percent.11
The fundamental relationship between economic growth and the demand for air travel translated into record traffic loads and profits for the airline industry during this period. Between 1990 and 2000, the domestic revenue passenger miles at the major US carriers12 increased by 40 percent from 338 to 474
billion RPMs. Total capacity increased by only 23 percent, however, thus load factors climbed to record levels. The average load factor in 1990 was 60.5 percent, but that had increased to 71.7 percent by 2000.
Chapter 3:
To examine the industry earnings during the economic bubble, US Department of Transportation (DOT) data on airline financial performance was analyzed. Figure 3-1 shows the total net profits earned by the US majors during the 1990s.13 Total net profits among the major
US carriers increased from $1.8 billion dollars in 1995 to over $5 billion dollars just two years later. Profits at American and Delta exceeded $1 billion dollars in 1998, and United joined them during the following year. Even Southwest Airlines earned a net profit of over $600 million dollars in 2000. Airline stock prices and market activity on the last trading day of each month between 1990 and 2000 were compiled to investigate the relationship between airline performance, the economy, and investor activity. Market capitalization was used to estimate of the relative value of each airline,14
and was calculated from the closing stock price multiplied by the number of outstanding shares. The combined market capitalization of the majors is shown in Figure 3-2.15 The total market
capitalization of the airline industry increased from $11.4 billion in 1990 to a peak of $49.0 billion in April of 1999—an increase of 330 percent. This dramatic increase in valuation of the airline industry during the late 1990’s corresponds with the record profits and the strong economy, and suggest that these forces are certainly interrelated.
3.2 Airline Strategies
During the late 1990’s, traditional issues surrounding labor relations, airspace congestion, network alliances, and customer service continued to plague the airline industry as they did during previous decades, but these trends did not necessarily represent a fundamental departure from earlier years. Yet increased traffic and record industry earnings during the Internet bubble generally enabled the major carriers to adopt business strategies without feeling the effects of the stiff competition from smaller, low-cost airlines.
Driven in part by the strong economy and high investor expectations, major trends that began to transform the industry included more aggressive yield management and the shift to regional jet aircraft. The strong economy enabled airlines to focus on increasing revenues through aggressive yield management practices and focusing on higher-revenue business travelers. Regional jets were also deployed to enhance service, increase network competition, and boost market share. In general, the additional traffic and revenue generated by these strategies enabled the airlines to increase spending on capital improvements and labor—changing their fundamental cost structure and relationship with low-fare travel markets.
Figure 3-2: Increase in market capitalization of US major carriers, 1990-2000. Source: Author’s
calculations from WRDS data.
Figure 3-1: Net profits at US major carriers, 1990-2000. Source: Author’s calculations from
Yield Management
The refinement of yield management techniques during the economic boom of the late 1990’s increased revenues at the major network carriers. Airline strategies were focused on overall system-wide revenue instead of the profitability or yields of individual flights. In an integrated hub-and-spoke system where it becomes difficult to allocate revenues to specific flights, the measure of total overall network revenue becomes extremely important. Advanced-generation revenue management systems, for example, could refuse a request for a low-fare seat between Boston and Chicago if that seat would displace a higher-fare passenger connecting from Boston through Chicago to Seattle.
As they refined their revenue management skills, the network carriers continued to use this pricing power to compete with low-cost carriers and to fill seats at the last-minute that would have otherwise gone unsold. The economic bubble had created an environment where yield management systems could successfully extract more revenue from passengers who needed to travel while also stimulating demand for discretionary travel. In this perfect environment, the healthy economy and the increased monetary circulation generally resulted in increased business and personal air travel budgets. Companies could afford to spend more on business-related travel expenses, while individuals had more discretionary income for leisure travel.
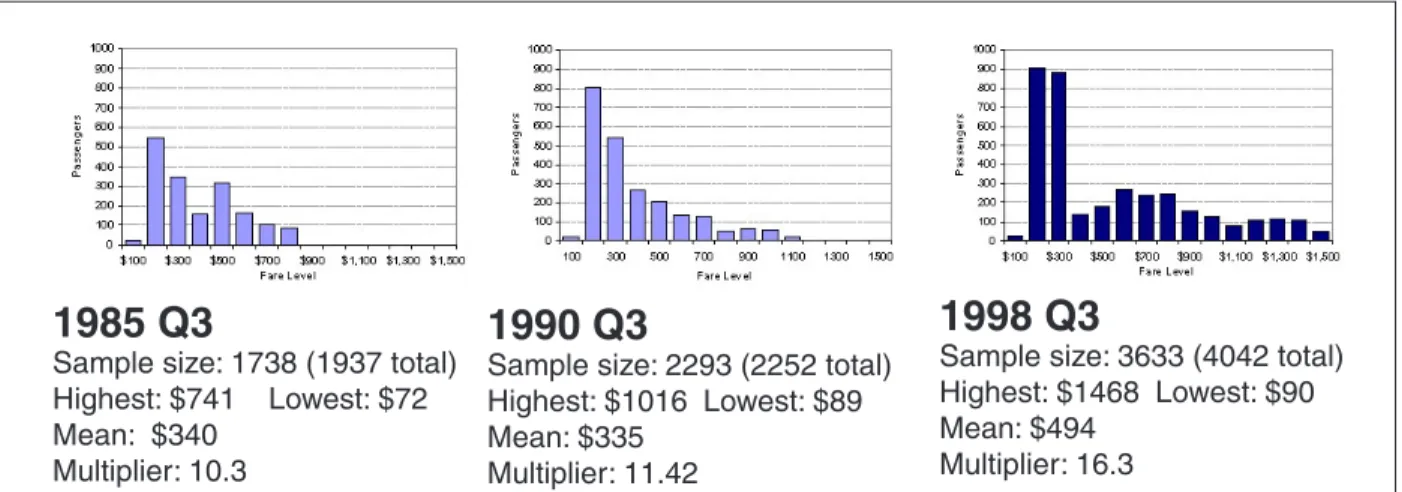
To illustrate the changes in network pricing strategies, the evolution of fares in one specific city-pair market at one major airline was analyzed using the US DOT DB-1A ten-percent sample of all domestic tickets. Although this example does not necessarily account for the effects of competition, aircraft size, and other factors, it nevertheless provides some insight into the pricing actions within the industry.16 The market between New York-Kennedy and Los Angeles was selected because it is a highly
competitive market linking the two largest cities in the United States with basically no alternate mode of transportation. Figure 3-3 shows the distribution of the fares purchased using a histogram set at $100 dollar intervals. Only the middle 90 percent is plotted in order to reduced the effect of frequent flyer award tickets, non-revenue travel, and other data anomalies.
The data shows several key changes. The average current-dollar fare actually dropped between 1985 and 1990, but had increased significantly by 1998. This is important because at the same time, there was
1998 Q3
Sample size: 3633 (4042 total) Highest: $1468 Lowest: $90 Mean: $494
Multiplier: 16.3
1985 Q3
Sample size: 1738 (1937 total) Highest: $741 Lowest: $72 Mean: $340
Multiplier: 10.3
1990 Q3
Sample size: 2293 (2252 total) Highest: $1016 Lowest: $89 Mean: $335
Multiplier: 11.42
Figure 3-3: Histograms showing distribution of one-way airfares purchased between New York-JFK and Los Angeles for selected years on American Airlines. Middle 90
per-cent of fares shown in current-year dollars. Source: Author’s calculations from US DOT DB1A data.
a distinct increase in the gap between the highest and lowest fares. The ratio between the highest and lowest fares increased from 10.3 in 1985 up to 16.3 in 1998. In addition, the number of passengers in the lowest fare segments had increased dramatically by 1998, creating a much more skewed distribution of passengers at the lower end. While these changes were able to preserve and even enhance overall yields in the face of stiff low-cost competition, it is thought that the increased volume of lower-fare traffic and the growing spread between fares began to change the overall passenger perception of airline pricing systems.
While revenue management was highly successful at extracting higher revenues from the travelers, it had the possibly unintended consequence of changing passenger attitudes towards the airline industry. Customer dissatisfaction with paying enormous fares for last-minute travel or travel without a Saturday night stay began to increase the attractiveness of low-cost carriers, many of which offered more flexible ticketing rules. Further discussion about the impact of bubble-era yield management on travel demand is in Section 3.3.
Regional Jets
The advent of regional jets was another major development in the airline industry during the bubble economy. Airlines were eager to differentiate themselves, and the regional jets offered a way to provide better service. Regional jets introduced a smaller unit of capacity (35 to 70 seats) into airline fleets,
Figure 3-4: Plot showing growth of domestic routes operated by regional jet aircraft, 1998 and 2000.
Source: OAG data.
1998
enabling them to provide enhanced service and increased capacity in smaller markets that couldn’t support traditional mainline jet service. With faster cruising speeds, regional jets could fly on longer routes than turboprops and could thus enable hubs to be expanded and strengthened. In addition, regional jets could be used on point-to-point flights to bypass major hubs.
Regional jets were rapidly introduced throughout airline networks during the mid-1990’s. Schedule data from the Official Airline Guide was sorted by aircraft type and used to determine the number of routes used by regional jet aircraft.17 Figure 3-4 shows that the number of nonstop domestic city-pairs served
by regional jets increased from over 380 in May 1998 to over 950 by July 2000. By 2002, the number of routes had increased to over 1500. This growth, however, was dampened by scope clauses that had been negotiated into pilot union contracts. Concerned about the threat of mainline aircraft being replaced by regional jets, many pilot unions negotiated limitations on aircraft weight, seating capacity, fleet size, and scheduling. In Fall 2001, for example, scope clauses at United limited the airline to operating only up to 65 regional jets with less than 50 seats and a maximum aircraft weight of 60,000 pounds. Among the rules at Delta Air Lines were stipulations that 85 percent of its regional jets must be flown on routes less than 900 miles.18
One of the major strategic impacts of regional jets, however, is that they increased the competition between hub networks and enabled carriers to focus on high-revenue connecting passengers. Where they replaced turboprops, regional jets brought upgraded service to smaller communities but also changed cost structures and profit thresholds of these routes.
Spending
With finely-tuned revenue management tools and new ways to compete, the major airlines thrived under the growth cycle of the economic bubble. High profits gave labor unions some leverage to seek pay raises, and also made it possible for airline management teams to increase capital spending. These dynamics increased the structural costs of the
airline industry, and would affect profits during the subsequent downturn.
To analyze the impact of changes in costs at the US majors, DOT Form 41 data was analyzed. Unit costs for the various expense categories were calculated using total scheduled and nonscheduled ASMs.19 Figure 3-5 shows that average labor costs
per ASM increased by 26 percent between 1994 and 2001. These increases outpaced the growth of costs in some other areas such as materials or other services, but this increase was more significant because labor had already been such a large component of the total operating costs. Overall, labor costs had also increased as a percentage of total operating cost from 34.3 percent in 1990 to 37.7 percent in 2001. Part of the reason for the increase in labor costs is that the airlines were also under pressure to restore wage concessions that had been granted during the recession and traffic
Figure 3-5: Growth in labor cost components per ASM at US Majors, 1984-2001. Source:
Author’s calculations from US DOT Form 41 data, Schedules P6 and T1.
downturn of the early 1990’s. With profits soaring under the umbrella of a growth environment, airlines were more able and willing to pay for expensive labor contracts to prevent disruptive strikes and to enable the introduction of new airplanes.
Capital spending was also a cost issue as airlines continued to undertake expensive airport
improvement projects, deploy information technology systems, and renew aging aircraft fleets. As the major network carriers tried to distinguish their travel product from one another as well as from their low-fare competitors, many
focused on their connecting hubs. Airlines spent billions of dollars to transform hub terminals at Newark, Dallas-Ft. Worth, Chicago, Miami, New York-Kennedy, Los Angeles, Detroit, and elsewhere. To
upgrade their customer image, airlines such as Continental and USAirways also embarked on large fleet replacement programs during the late 1990’s. New airplanes were often more fuel efficient and cheaper to operate, but they added structural costs to the industry as airlines began to lease more aircraft instead of depleting cash reserves. Figure 3-6 shows the annual deliveries from one major airplane manufacturer.20
Airplane deliveries fell off during the mid-1990’s after the recession but peaked again in 1999 just as the industry headed into another downturn. Because of the length of time that it takes to build an airplane, deliveries are slightly lagged behind the economy and airline profits cycles. The result is that airplane commitments often coincide with the beginning of the industry downturns, and add extra expenses when airlines can least afford them.
In general, the major network carriers chose to compete with themselves and the rest of the industry by focusing their products and services on the premium, high-fare passengers identified and captured through revenue management systems. Network development was focused to serve the frequency and connectivity needs of high-yield business travelers. Services were enhanced with upgraded premium cabins, and both American and United removed rows of coach seats to offer increased legroom for premium passengers. While this high-cost, high-service philosophy was successful during the economic bubble, however, changes in the economy and the dynamics of passenger demand would begin to affect the viability of these strategies by the late 1990’s.
3.3 Change in Passenger Dynamics
Except for only marginally successful attempts at developing low-cost divisions to compete with low-fare carriers, the major network carriers primarily relied on their product and revenue management systems to distinguish themselves and protect their revenue base. This revenue base, however, began to change fundamentally as people began to purchase airline tickets in new ways and shifted their attitudes towards low-cost carriers during the late 1990’s. This fueled the growth of the low-cost carriers, and these forces began to altogether change the competitive dynamics between the major network and low-fare segments of the airline industry.
Figure 3-6: Boeing Airplane Deliveries through April 2003. Source: Boeing.
Demand for Low-Cost Travel
Smaller, nontraditional and often low-fare carriers enjoyed large increases in the overall market share during the 1990’s, and this had a substantial impact on the dynamics of the industry. The relative change in RPM market share is shown in Figure 3-7. While the legacy network carriers—including American, Continental, Delta, Eastern, Northwest, TWA, United, and USAir—accounted for 88.4 percent of the total market share of revenue passenger miles in
1991. By 2001, this had dropped to 73.1 percent. In contrast, Southwest increased its market share from 3.0 percent in 1991 to over 9.2 percent in 2001, while the combined total of the other smaller carriers had a similar increase.
The rapid growth and popularity of carriers such as AirTran or JetBlue also appears to reflect a change in public acceptance of low-fare travel. While the physical scope and size of these networks did limit their actual travel utility, other issues such as safety and perceived quality also presented barriers to market penetration. Such qualitative issues presumably contributed to the failure other low-fare carriers such as PeopleExpress, Kiwi, or Western Pacific. Safety, for example, was often cited as a major concern with travelers flying on
low-cost carriers. The Valujet crash in the Florida Everglades in 1996 fueled these doubts. Like other low-cost startup airlines in the early 1990’s such as Kiwi and Frontier, the business model at Valujet was to use old aircraft and reinforce its visible appearance of a low-cost operation. This model backfired after the 1996 crash, however, as it was perceived that inexperienced, low-paid personnel and outsourced maintenance providers contributed to the crash.
To increase its credibility while maintaining its image as a low-cost carrier, Valujet merged with AirTran, took its name and acquired a brand-new fleet of 50 Boeing 717 airplanes. Other new carriers such as JetBlue and National Airlines followed similar business strategies with new airplanes and unblemished safety records. They also tried to compete with the major carriers by providing superior levels of service. JetBlue offered leather seats and live satellite television, while National included a first-class cabin and a comprehensive frequent flyer rewards program. As this generation of low-fare carriers overcame the issues of safety and image, they began to present a real and credible threat to the traditional major network carriers throughout the country and even in specific home markets. An analysis of itinerary-level data from the DOT ten-percent ticket sample shows that AirTran has been able to penetrate Delta’s fortress hub at Atlanta, and has increased its share of the local origin-demand market from 9.9 percent in 1998 to 14.0 percent in 2001. JetBlue has been able to capture 28.6 percent of the local market at New York-JFK within two years of its startup in 2000.21
Change in Customer Behavior
One of the other factors that contributed to the change in attitudes towards low-fare travel had to do with changes in how tickets were purchased. The advent of the internet and web-based ticketing appears to have enabled passengers to place a greater emphasis on ticket value rather than travel time or other
Figure 3-7: Domestic market share of US Ma-jors and other carriers, 1991 and 2001. Source:
service characteristics. Airlines began to rapidly implement web-based ticketing processes because it provided an extremely low-cost means of product distribution—providing substantial savings as compared to traditional telephone customer reservations systems, city ticket offices, or even travel agent commissions.
To help attract customers to their websites, airlines marketed the price-saving benefits of online ticketing—enabling passengers to easily search for flights based on price instead of schedule. Other third-party websites such as Travelocity or Orbitz also focused on comparing prices instead of travel time. The perhaps unintended outcome of these features was that it changed the way passengers perceived the value of air travel. When customers were given the ability to book flights themselves, they became more willing and able to take the time to find the lowest fares and rearrange their activity schedules in order to save money.
By contrast, traditional distribution methods involving travel agents and airline reservation systems provided little incentive and made it often difficult for customers to find the lowest airfares. Web-based booking engines also gave customers more access and exposure to the schedules and fares of lesser-known, low-cost airlines such as Southwest or JetBlue. This would increase their visibility and market competitiveness with the network carriers. It also affected the strategic advantage of tightly scheduled hub-and-spoke operations. This will be discussed further in Chapter 4.
3.4 The Bubble Pops
During the internet bubble, the industry had evolved into a two-tiered system consisting of major network carriers and low-cost regional airlines. Continued growth, as well as the effects of yield management systems and differences in route connectivity noted earlier, had been able to somewhat insulate each segment of the industry from direct competition. Yet one of the crucial dynamics that began during the late 1990’s was a change in the demand for air travel as both business and leisure travelers became more sensitive to price. With more acceptable and lower-cost alternatives, people began changing their travel behaviors rather than tolerate price “bidding” from yield management systems. The end of the internet bubble had effectively placed an end to traffic growth and capped the amount of revenues which could be extracted from the passenger base. Since the economic “pie” stopped growing, the majors found themselves in competition with the low-cost carriers for passengers who were no longer willing to pay for premium services. The economic slowdown is shown in Figure 3-8 using seasonally adjusted quarterly data on GDP from the US BEA.
Figure 3-9: Downshift in fare types. Source:
Belobaba (2002) from IATA data.
Figure 3-8: Quarterly change in GDP, 1990-2002. Source: US BEA data.
Quarterly GDP growth peaked in the fourth quarter of 1999 at 7.1 percent, then began sliding down through 2000 until it declined to a negative 1.6 percent in the second quarter of 2001.
In addition, the softening economy began to drive passengers from higher, flexible tickets to lower fares. Key traffic indicators during the first half of 2001 showed that traffic had already begun to soften and shift between fare types. Figure 3-9 shows the quarterly change in IATA passenger traffic by fare category.22 First class traffic during
the first half of 2001 dropped by 15 to 20 percent over 2000 levels, while business class traffic dropped by about 10 percent. Coach passenger traffic, however, continued to grow by about 5 to 7 percent. In addition, average fares also began dropping by March 2001. This presented a major threat to airline revenues because yield management systems had enabled airlines to rely on a small number of passengers for a
disproportionately high percentage of the revenue. A common industry rule-of-thumb was that ten percent of the passengers produced half of the overall revenue.23
Airlines responded to the downturn in traffic by reducing fares to stimulate traffic. Industry data on airfares for a typical 1,000-mile domestic trip was used to analyze the change in airfares, and is plotted in Figure 3-10.24 Airfares had grown in
1995 and 1996, but stayed relatively flat during 1997, 1998 and 1999 before increasing about 3 to
5 percent during 2000. Between February and August 2001, however, the average airfares actually began to decrease significantly below the prior-year levels. By August of 2001, average domestic airfares were already about 12 percent less than they were at the same time in 2000.
The shift to low-fare tickets and the decline in airfares had a major impact on the financial performance and yields of the airline industry. Losses at the US majors began in the fourth quarter of 2000 at United and were followed in the first quarter of 2001 at Delta and American. The exception to this was Southwest, however, as its low-fare business model enabled it to maintain its profitability as the other carriers began to face major losses. Stock prices consequently dropped at the major network carriers, and investors began to withdraw capital from these airlines and the industry as a whole. Figure 3-11 shows the changes in the market capitalization of several major carriers between 1995 and 2001. The decline at Delta and American started in mid-1999 can be seen, but perhaps more notable is the increase in market cap value at Southwest. This showed that investors had a much stronger perception of the long-term market prospects of Southwest and was also indicative of the increased market for low-fare travel.
Figure 3-10: Year-over-year change in domestic airfares, 2000-2001. Source: Katherine Andrus,
ATA data.
Figure 3-11: Market capitalization of selected US major carriers, 1995-2001. Source: Author’s
In the wake of the post-bubble economic recession, the airline industry by mid-2001 had become increasingly aware of declining revenues amidst persisting issues with service quality and flight delays. Structural industry-wide issues of low-fare competition and productivity, however, were only compounded by the attacks of September 11, 2001, and passenger traffic plummeted in the days and weeks after 9/11. Since the post-bubble economic conditions had already placed the major US airlines in a particularly vulnerable financial position, they were quick to implement drastic schedule reductions and other cost-cutting measures. The airlines also grappled with new costs and delays associated with expanded security procedures, and experimented with new pricing strategies to restore traffic and revenues. This chapter will explore how the short-term operational responses were part of a larger industry restructuring which would have arguably occurred even if 9/11 had not happened.
4.1 Industry Performance
The terrorist attacks of 9/11 involved the unprecedented use of commercial airliners filled with revenue-paying passengers as weapons of mass destruction. The Secretary of Transportation ordered a complete ground stop of all non-military aviation activity, and all flights in the United States were ceased within a matter of hours. The shutdown of national airspace lasted two days. Operations at Washington-Reagan National Airport were disrupted for several months, and the airport only reopened after additional security measures were implemented on all incoming and outgoing flights. Thousands of passenger itineraries were disrupted, and airlines collectively lost billions of dollars of revenue from the shutdown of operations.
Chapter 4:
This event had a major impact on the perception of the safety of air travel, and security concerns dramatically decreased the demand for air travel. People stopped most nonessential business and personal travel, and it is believed that 9/11 helped to increase the use of videoconferencing and other telecommunications systems as travel alternatives. This following section will look at how 9/11 affected the performance of the airline industry in areas such as capacity, passenger traffic, and revenues.
Traffic, Capacity, and Fares
To compare the changes to industry supply and demand of air travel, industry data on monthly passenger traffic and airline seats was analyzed between 2000 and 20003. Figure 4-1 shows the year-over-year domestic traffic measured in Revenue Passenger Miles, while Figure 4-2 shows the supply measured in Available Seat Miles. As Figure 4-1 shows, passenger traffic during the first half of 2001 had grown only slightly over 2000 levels—less than one percent on average. August 2001 was a strong month, however, and domestic RPMs increased by about 4 percent. After 9/11, however, traffic immediately dropped by about 20 percent for the month of October over prior-year levels. Traffic slowly came back, however, and the average drop for the last quarter of 2001 was about 16 percent below 2000 levels. Revenue passenger miles in March 2003 are still about 90 percent of 2000 levels.
Figure 4-2 shows that between January and August of 2001, domestic ASMs had averaged about 2.7 percent above prior-year levels. The drop in ASMs after 9/11 meant that in October 2001, capacity was about 15 percent below 2000 prior-year levels. Capacity was gradually phased back into the system, and capacity in the summer of 2002 was about 7 percent below 2001 levels and 4 percent below 2000 levels.
Figure 4-4: Average domestic load factors, 2000-2003. Source: ATA data.
Figure 4-3: RPMs as percentage of 1999 levels, 2000-2003. Source: ATA data.
Figure 4-2: Domestic capacity in ASMs, 2000-2003. Source: ATA data.
Figure 4-1: Domestic traffic in RPMs, 2000-2003. Source: ATA data.
Capacity in March 2003 was still down about 9 percent below 2001 and 2000 levels.
Figure 4-3 shows the RPMs as a percentage of 1999 levels. It shows that while traffic in 2000 and 2001 stabilized at about a five percent average growth over prior-year levels, that traffic still remains below 1999 levels. Despite the decline in traffic, the reduced capacity has been returning average load factors to previous levels. As shown in Figure 4-4, the annual average load factor for 2001 was 69.5 percent, while it was 71.7 percent in 2000. Load factors in 2002 and the first quarter of 2003 averaged 70.5 percent. It should be noted, however, these load factors represent record highs; by comparison, load factors in the mid-1980s were around 60 percent. There are operational limits to high load factors due to passenger no-shows and variability in time-of-day and day-of-week demand.
Figure 4-5 shows the annual change in average airfares for a 1,000-mile hypothetic trip (excludes Southwest). The change in demand and increased low-fare competition is clearly evident throughout 2001, and fares continued to drop from 2000 levels. The decline bottomed out in October 2001 at almost 20 percent below the prior-year. The decrease gradually slowed and leveled off by September 2002.
The divergence of rising airline costs and decreasing passenger revenues is extremely evident in an examination of the system-wide actual and breakeven load factors. Although pricing and supply are disconnected in practice, Figure 4-6 links these two concepts in order to better show the trend of falling ticket prices, rising costs, and shrinking profit margins. During the economic bubble, costs stayed
relatively stable with breakeven load factors remaining at about 64 to 66 percent between 1995 and 1999. Load factors during this same period increased from 67 percent up to 71 percent and corresponded to the record industry profits. Costs began to increase, however, and the breakeven load factors increased to 70 percent in 2000 and 77 percent in 2001. With the impact of 9/11, the actual load factor dropped to 62 percent—thus illustrating the operational evidence of the major industry losses.
Financial Performance
Despite the restoration of load factors, the price and revenue equilibrium has nevertheless shifted considerably. In the months since 9/11, the industry has continued to suffer record losses. In 2001 and 2002, the industry lost $18 billion dollars, and current projections are losses of $8 billion dollars for 2003. US carriers have historically experienced losses during recession periods, but the magnitude of the current losses for the major carriers (excluding Southwest) is clearly unprecedented. Coupled with the impacts of
Figure 4-5: Annual change in average domes-tic airfare. Source: ATA data.
Figure 4-6: Domestic breakeven and actual load factors. Source: Katherine Andrus, ATA.
9/11, the enormity of these losses has transformed the financial environment of the airline industry and threatens the long-term sustainability of the traditional large US network carriers.
Profits. Airline losses increased significantly
after the 9/11 attacks, even after billions of dollars in government aid intended to cover the loss of revenue during the two-day shutdown of the national airspace. In the six quarters following the 9/11 attacks, the three largest US carriers collectively lost over $10.3 billion dollars. Figure 4-7 shows the reported quarterly statements for American, Delta, United, and Southwest Airlines. Of these four airlines, Southwest Airlines was the only one to remain profitable following the events of 9/11, although its profits have eroded considerably. Net profits at Southwest in the first quarter of 2003 amounted to only $24 million dollars, compared to $191 million in the second quarter of 2002.
To show the relationship between unit costs and revenues, Figure 4-8 shows the net profit per available seat-mile unit for five of the major carriers. It shows that the profits began to drop below costs in the second half of 2000. United and USAirways had major spikes in the third and
fourth quarters of 2001 as they reduced their networks (less ASMs) without being able to reducing their costs accordingly. It shows that Delta is the closest of the big three network carriers to achieving financial stability.
Financial Markets. The investment capital markets have recognized that the traditional major US
network airlines have little prospects for long-term profitability, and have shifted market capital to low-fare carriers including Southwest and JetBlue. Figure 4-9 shows that Southwest Airlines market capitalization was substantially greater than the rest of the major airlines and JetBlue combined. JetBlue had a valuation 10 times greater than that of United
Airlines, even though its route network, passenger traffic, and revenues are only a fraction of those at United. Figure 4-10 reflects the dramatic decline in stock prices during 2001 and 2002. Even stocks of well-performing airlines have lost value. Continental has lost over 80 percent of its value, dropping from over $50 to under $10. Also notable is that even Southwest has lost over 54 percent of its original value at the beginning of 2001, and JetBlue over 46 percent of its value from its initial public offering.
Figure 4-9: Relative share of market capitaliza-tion, US majors with Jet Blue, March 18, 2003.
Source: Author’s calculations from Yahoo! Finance data.
Figure 4-7: Quarterly profits of selected US major carriers. Source: Airline press releases.
Figure 4-8: Net Profit per ASM, 1997-2002.
Source: Form 41 data and airline financial re-leases.