.
Radon-222 as a Tracer for Nonaqueous Phase Liquid in the Vadose Zone:
Experiments and Analytical Model
Patrick Ho¨hener* and Heinz Surbeck
ABSTRACT can be used to approximately locate these source zones
and for describing lateral or vertical extensions of
con-The potential use of the naturally occurring noble gas222Rn as a
taminant vapor plumes emanating from them (Robbins
tracer for vadose zone contamination by nonaqueous phase liquids
(NAPLs) is studied experimentally and theoretically. n-Dodecane et al., 1990; Wilson, 1997; Pasteris et al., 2002). However,
was chosen as the model NAPL. In batch experiments containing the contaminant vapor concentrations in the
subsur-unsaturated alluvial sand, a 2.9-fold decrease of the steady-state222Rn
face are by themselves not an indication of the amount
activity in soil gas was measured as a consequence of the increase in of NAPL residual in the source zone. A method for NAPL
the volumetric NAPL content from 0 to 0.074. A one-dimensional ana- quantification based on the measurement of a gaseous
lytical reactive transport model was developed that includes222Rn
compound would therefore be a useful complement to
production, gas-phase diffusion, partitioning, and radioactive decay.
traditional vadose zone soil gas monitoring. For the
va-Radon-222 soil gas profiles were predicted for homogeneous and
dose zone, the use of gaseous tracers is especially
promis-heterogeneous sandy profiles where NAPL contamination was
re-ing because their use can be combined easily with
conven-stricted to selected depth layers. The resulting depth profiles document
tional soil gas monitoring (Werner et al., 2004). Artificial
that the position of the NAPL has great influence on the222Rn activity
depth profile. An outdoor lysimeter experiment was performed using gaseous partitioning tracers have been introduced in
re-unsaturated alluvial sand contaminated by NAPL at depths from 1 cent years for NAPL quantification in the vadose zone
to 1.2 m. In the lysimeter experiment, a spill of 2 L m⫺2NAPL did
(Deeds et al., 1999; Mariner et al., 1999; Whitley et al.,
not alter significantly the222Rn profile, as predicted also by model
1999; Werner, 2002; Werner and Ho¨hener, 2002a;
Brus-calculations. We concluded that222Rn can be used as a NAPL tracer
seau et al., 2003). The tracers may be transported by
in the vadose zone only at heavily polluted sites with uniform
spa-advection (Mariner et al., 1999) or diffusion (Werner
tial222Rn production.
and Ho¨hener, 2002a) through the soil volume of interest. Interpretation of tracer breakthrough curves yields the average volumetric NAPL content of the vadose zone
S
pills of NAPLs, such as petroleum products or sol- (Dwarakanath et al., 1999). However, the injection of vents, to the subsurface are a major problem at many artificial tracers into the vadose zone and the analysis industrial or military sites (Boulding, 1996). Knowledge of breakthrough curves requires technical equipment of the spatial distribution and quantity of NAPL in the and ample time on the site and hence may be costly. subsurface is crucial for optimal management and re- A more simple way of making use of a gaseous tracer mediation of polluted sites. During the migration of is to take advantage of a native soil gas that partitions NAPLs through the vadose zone, a certain amount of into NAPLs. The naturally occurring isotope 222Rn ofliquid is retained in the pores of the vadose zone by the noble gas Rn is such a gas and has been proposed capillary forces. This fraction is known as residual satu- previously as a partitioning tracer for NAPL contami-ration and may occupy up to 20% of the available pore nation in both the vadose zone (Meissner et al., 2000; space (Mercer and Cohen, 1990). The presence of NAPLs Schubert et al., 2000, 2001, 2002; Schubert, 2001) and defines the so-called source zone (Wiedemeier et al., the saturated zone (Hunkeler et al., 1997; Semprini 1999), from which gaseous and aqueous contaminant et al., 2000; Davis et al., 2002). Radon-222 is produced plumes are formed. Source zone delineation is a key by␣-particle decay of 226Ra, an isotope of the natural
procedure at any NAPL-contaminated site. Delineation radioactive decay series of238U (Cecil and Green, 1999).
of source zones with traditional sampling techniques Radon-222 itself decays by␣-particle decay, with a half-(e.g., soil cores, trenches) presents considerable difficul- life of 3.8 d to a series of short-lived daughter prod-ties and costs (Feenstra and Cherry, 1996). Soil gas ucts (218Po, 214Pb, 214Bi, 214Po; Nazaroff, 1992; Van der
monitoring is often used as an exploratory method at Spoel et al., 1997). From minerals that contain 226Ra,
sites where the vadose zone has been contaminated with 222Rn emanates to the surrounding gas or water phase
NAPL containing volatile organic compounds (VOCs, by␣ recoil and diffusion (Hoehn and von Gunten, 1989; Wilson, 1997; Looney and Falta, 2000). High VOC con- Nazaroff, 1992). Radon-222 is a chemically inert noble centrations are associated with the source zones (Wer- gas; however, it partitions into NAPL (Hunkeler et al., ner et al., 2004). Measured vapor concentration profiles 1997). When groundwater containing 222Rn at
emana-tion–decay steady-state activity migrates into a NAPL-P. Ho¨hener, Swiss Federal Institute of Technology (EPFL), ENAC- contaminated zone of an aquifer, the 222Rn activity in
ISTE-LPE, CH-1015 Lausanne, Switzerland; H. Surbeck, University
the water phase decreases due to partitioning of222Rn
be-of Neuchaˆtel, Center for Hydrogeology (CHYN), Rue Emile Argand
tween the NAPL and the water (Hunkeler et al., 1997). 11, CH-2007 Neuchaˆtel, Switzerland. Received 20 Nov. 2003. Original
Research Paper. *Corresponding author: ([email protected]). In vadose zone NAPL source zones with uniform226Ra
Abbreviations: NAPL, nonaqueous phase liquid; TDR, time domain
see Table 1). The fraction fiof222Rn in the air phase of layer distributions,222Rn activities measured in the soil gas may
i can be calculated using (Werner and Ho¨hener, 2002a) decrease similarly. Schubert and coworkers presented
experimental evidence for local222Rn minima in NAPL
fi⫽ 1 1⫹ s(1⫺ t)Kd Ha ⫹ w Ha ⫹ n Kna [1] source zones in a lysimeter (Schubert et al., 2000) and for
two field cases at abandoned gasoline stations (Schubert et al., 2001). They suggested that, as a general rule,222Rn
activities decrease at every NAPL-contaminated site wherea,w,n, andtdenote air-filled, water-filled, NAPL-compared with profiles at uncontaminated sites nearby. filled, and total porosities, respectively, and s denotes the
density of the solids. Note that the inverse value of fiis equal They stated also that222Rn activity profiles in the vadose
to the retardation coefficient R⫽ f⫺1
i , a quantity used for the zone vary as a function of depth, boundary conditions
interpretation of advective partitioning tracer tests (Brusseau at depth, and vadose zone water content. However, a
et al., 2003). detailed study of222Rn profiles in heterogeneously
con-taminated vadose zones including modeling of pertinent
General Equation for222Rn Diffusion in
transport and partitioning processes, is lacking.
Con-the Vadose Zone trary to the work by Schubert et al., it is likely that the
222Rn activities may either increase or decrease at
cer-If decay is described by a single first-order rate constant, the governing equation for one-dimensional diffusion-domi-tain locations in heterogeneously contaminated profiles
nated transport in a porous medium with uniform and constant compared with a reference profile, depending on the
properties can be written as position of the NAPL layer in the subsurface. A NAPL
layer residing near the soil surface could hinder 222Rn
A t ⫽ fiDi
2A
z2 ⫺ A ⫹ fiSi [2a]
transport to the atmosphere. It has been shown that seal-ing of the soil surface (e.g., by a road) leads to increased
where A is the activity of222Rn in soil air (kBq m⫺3) and D
iis
222Rn activities in the vadose zone (Wiegand, 2001).
the effective gas-phase diffusion coefficient of222Rn in soil air
The aim of this paper is (i) to present a general model
of layer i, defined as for222Rn transport in homogeneous and heterogeneous
NAPL-contaminated vadose zones; (ii) to verify basic Di ⫽ Dm [2b]
relevant assumptions of the model experimentally by
where Dm is the molecular diffusion coefficient of 222Rn in
means of batch experiments; (iii) to model the222Rn
ac-air. The tortuosity factor is described using the model of tivities in the vadose zone as a function of depth, volu- Millington and Quirk (1961):
metric water or NAPL content, and NAPL location;
⫽ 2.33
a /2t [2c]
and (iv) to compare a selected model realization with
profiles measured in a lysimeter with a low NAPL con- The production rate of222Rn in pore space S
iis related to
tamination. the Ra concentration according to (Van der Spoel et al., 1997)
Si⫽
CRas(1 ⫺ t)
a
[2d] THEORY AND ANALYTICAL MODEL
Relevant Assumptions with CRabeing the226Ra concentration of the solids, the
ema-nation coefficient, and other parameters as defined in Table 1. The theory presented here relies on the following
assump-The one-dimensional reactive transport Eq. [2] has been tions: The vadose zone is described as a homogeneous porous solved analytically for a homogeneous vadose zone (Van der medium with uniform and constant properties. In particular, Spoel et al., 1997). A222Rn activity of 0 is used for the upper
we assume that226Ra activity is constant in space and time,
boundary condition at the soil surface (Eq. [3a]), and a no-and hence that 222Rn is produced uniformly throughout the
flux boundary condition is implemented at the groundwater vadose zone. The phases of the porous medium are soil air, table at depth L (Eq. [3b]):
soil water, NAPL, and the solid matrix. Partitioning of222Rn
A⫽ 0 at z ⫽ 0 [3a]
between the phases is described by instantaneous, reversible
lin-ear equilibrium. Gas-phase diffusion is the only relevant trans- ␦A/␦z ⫽ 0 at z ⫽ L [3b] port process, and radioactive decay is the only reaction. Soil
The solution is then (Van der Spoel et al., 1997) air, soil water, and NAPL are further assumed to be immobile,
and steady state is assumed for diffusive gas transport and Ra–Rd decay. Both fluids, NAPL and water, influence the
ef-A(z)⫽fiSi
冦
1 ⫺冤
cosh冢
(L⫺ z)冪
fiDi 冣
冒
冤
cosh冢
L冪
fiDi 冣
冥
冧
fective gas-phase diffusion coefficient; the model of Millingtonand Quirk (1961) is used to account for these effects.
[3c]
Note that all parameters with subscript i depend on the charac-Partitioning of222Rn in an
teristics of the vadose zone (i.e., the volumetric water and the NAPL-Contaminated Vadose Zone
NAPL content). These parameters will vary in layered profiles Assuming instantaneous linear equilibrium between the air, having different characteristics, as listed in Table 2 for various water, NAPL, and solid phases, the partitioning of222Rn can be NAPL contents. For media extending to infinite depth,
Naza-described using the air–water partitioning coefficient (Henry roff (1992) and Schubert (2001) have given the corresponding coefficient) H, the solid–water partitioning coefficient Kd, and analytical model for steady-state profiles in a homogeneous
sys-tem. The term fiSi/ is the asymptote at infinite depth, whereas the air–NAPL partitioning coefficient Kn(for notations and units
Table 1. Parameters and notations used in this study, and values of parameters used for the base case model, given for T⫽ 20ⴗC.
Parameter Notation Value Unit Reference
Production rate of222Rn in pore space S
i 1.14⫻ 10⫺5 kBq m⫺3s⫺1 obtained from Batch Exp. and Eq. 4
Molecular diffusion coefficient in air Dm 1.1⫻ 10⫺5 m2s⫺1 Van der Spoel et al. (1997)
Henry’s Law constant H 4.4 – Wilhelm et al. (1977)
Air–NAPL partitioning coefficient Kn 0.085 (⫾0.009) – Schubert et al. (2001)
Solid–water partitioning coefficient Kd 1.4⫻ 10⫺5 m3kg⫺1 Nazaroff (1992)
Decay constant 2.1⫻ 10⫺6 s⫺1 Nazaroff (1992)
Total porosity t 0.42 m3m⫺3 †
Volumetric water content w 0.10 m3water m⫺3 †
Volumetric NAPL content n 0 m3NAPL m⫺3
Volumetric air content a 0.32 m3air m⫺3
Density of solid phase s 2550 kg m⫺3 †
Depth to groundwater table L 2.3 m †
† Parameters were selected to represent as closely as possible the experimental study by Dakhel et al. (2003).
the term公(fiDi/) is also referred to as the characteristic dif- Lucas cell. Thereafter, the Lucas cell was immediately inserted into the counter chamber of an RD-200 Rn detector (EDA fusion length.
For heterogeneous layered profiles, the one-dimensional Instruments) and kept for 5 min in the dark. Radon-222 was subsequently counted for periods of 10 min. Blank values from reactive transport Eq. [2] has been solved analytically by the
authors, using the software Maple (Vs. 8, Waterloo Maple Inc., the same Lucas cell were subtracted, and the results were converted to kilobecquerels per cubic meter using a previously Waterloo, Ontario, Canada). At the interface between two
adjacent layers (at Li), constant flux boundary conditions are established calibration (Surbeck, 1993). Results were adjusted to account for dilution of the soil gas with air initially in the used according to Fick’s first law:
circulation loop and the Lucas cell. The sampling was repeated a1D1A1/z ⫽ a2D2A2/z at z ⫽ Li [3d] after an additional incubation of 12 or 15 d.
For the interpretation of the batch experiments where no
diffusive transport is active, Eq. [2a] becomes Lysimeter
Ai⫽ fiSi/ [4] Vertical profiles of222Rn activity were measured in an
out-door lysimeter operated as part of an independent study of the impact of gasoline additives on groundwater quality (Dakhel MATERIALS AND METHODS et al., 2003). The dimensions of the lysimeter were 1.2 m (di-ameter) by 2.5 m (depth). The porous medium for the unsatu-Batch Experiments
rated zone in this lysimeter was the same alluvial sand as used in the batch experiments, packed to a porosity of 0.42. Below Alluvial sand taken from the Rhone delta in Lake Geneva
and sieved⬍4 mm was used for the batch experiments (see the 2.3-m depth, limestone gravel was holding a total of 50 L of groundwater. A siphon at 2.33 m regulated the height of the Pasteris et al., 2002; Dakhel et al., 2003; Ho¨hener et al., 2003
for detailed properties of the sand). The sand was moistened groundwater table. The height of the capillary fringe in the sand as measured in a laboratory column was 0.07 m (Pasteris to a volumetric water contentwof 0.10⫾ 0.01 before
contami-nated with the NAPL. n-Dodecane having a purity ⬎99% et al., 2002). Details of the instrumentation involving gas and water sampling tubes, thermometers and time domain reflec-from ACROS Chemicals (distributed by Chemie Brunschwig,
Basel, Switzerland) was used as the model NAPL phase (Wer- tometry (TDR) probes are given elsewhere (Dakhel et al., 2003). On 15 Jan. 2002 (Day 0), sand was excavated to a depth of ner and Ho¨hener, 2002a). The sand and NAPL were mixed
in a closed drum and packed immediately into 2.5-L glass 1.2 m. A volume of 226 L of this excavated sand was combined with 3.2 L of an artificial gasoline mixture and mixed in a con-bottles sealed with rubber stoppers. Total porosities of 0.43⫾
0.02 were obtained, as gravimetrically determined. A copper crete mixer (Dakhel et al., 2003). The contaminated sand was placed between the 1.2- and 1.0-m depths in the lysimeter, tube (⬇3 mm, 1/8 inch) was led from the bottom of the bottle
through a stopper, and sealed at its end with a valve. After and immediately covered with clean sand that was previously excavated. Five soil samples were taken to measure the volu-incubation for 20 d at 20⬚C, a steel needle (1-mm i.d.) was
inserted through the rubber stopper for gas extraction from metric NAPL content. The lysimeter was next filled to the top with clean sand within 1.5 h. Volumetric water contents were the top of the bottle. The gas within the bottle was circulated
by connecting the inlet of a GilAir-3 personal air sampler initially obtained from gravimetric analyses and later from TDR readings each day when VOCs were analyzed in the (Lauper Instruments, Murten, Switzerland) to the steel needle
and the outlet to the copper tube. After circulation for 12 min soil gas, as reported previously in the supporting information section of Dakhel et al. (2003). Vertical profiles of222Rn in the
at 700 mL min⫺1, a 180-mL Lucas cell (EDA Instruments,
To-ronto, Canada) was introduced into the circulation loop, and soil gas were measured on Days 10, 28, and 287 after the arti-ficial contamination with gasoline. With a manual peristaltic the gas was circulated for an additional 2 min through the
Table 2. Expected variation of the fraction of222Rn in soil air, f
i, the effective diffusion coefficient, Di, the characteristic diffusion length
(fiDi/)1/2and the production rate of222Rn in pore space, Si, as a function of NAPL content,n, for a sandy soil; other parameters are
as in Table 1.
n⫽ 0
Parameter (base case) n⫽ 0.005 n⫽ 0.01 n⫽ 0.02 n⫽ 0.04 n⫽ 0.08
fi 0.92 0.79 0.69 0.54 0.37 0.20
Di, 10⫺6m2s⫺1 4.38 4.22 4.07 3.77 3.21 2.24
公(fiDi/), m 1.39 1.26 1.16 0.98 0.75 0.46
.
Fig. 1. Measured222Rn activities in the batch experiments as a function
of volumetric NAPL contentn(black diamonds, two to three
re-peated measurements, counting errors of 10%), and predicted222Rn
activities (solid line), using Eq. [4]. Broken lines represent errors of 10% in the air–NAPL partitioning coefficient.
pump connected to the preinstalled soil gas probes (Pasteris et al., 2002), 0.6 L of soil gas were sampled through the Lucas cells and measured immediately on site using procedures as described for the batch experiments.
Measurement of NAPL Content
Soil samples were obtained from the lysimeter using a motor-driven hollow-stem auger of 8-cm diameter (Max Hug, Luzern, Switzerland). The soil was brought to the surface in 0.25-m-long sections. Using a metallic spoon, about 10 g of con-taminated soil from samples taken every 5 cm were immedi-ately transferred into vials prefilled with 20 mL of CH2Cl2as
extractant. After shaking overnight on a rotary shaker, the extracts were analyzed using gas chromatography as described by (Dakhel et al., 2003). Samples from the batch experiments were analyzed similarly.
RESULTS
Batch Experiments
Figure 1 shows measured 222Rn activities from the
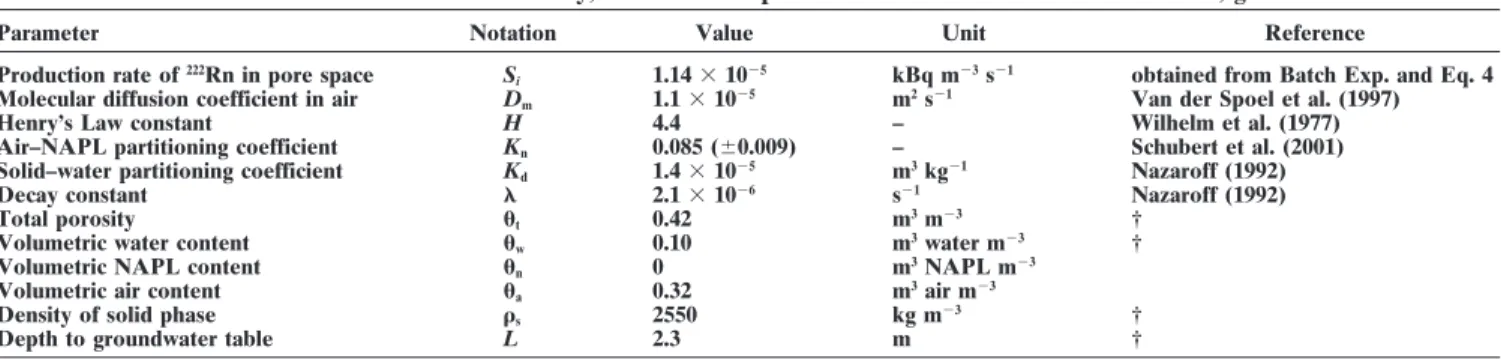
Fig. 2. Modeled222Rn activities in a homogeneous sandy vadose zone:
batch experiments. In uncontaminated sand at a water (A) influence of volumetric NAPL content
nand (B) influence of
contentwof 0.1⫾ 0.01, a steady-state222Rn activity of volumetric water contentw.
5.1⫾ 0.6 kBq m⫺3was measured as an average of two
batches, each with two replicates. Increasing the
volu-were made as consistent as possible to the lysimeter metric NAPL content caused the steady-state222Rn
ac-experiment. Results are shown in Fig. 2A. The predicted tivity to decrease; the lowest activity of 1.8⫾ 0.2 kBq
222Rn activities in the uncontaminated vadose zone (base
m⫺3 was found at the highest NAPL content studied
case) increase from 0 to 3.16 kB m⫺3. Homogeneous
(n⫽ 0.074). Except for one sample at n⫽ 0.017, the
contamination of the vadose zone with NAPL caused a reproducibility of samples from consecutive incubations
was within the counting error. Steady-state222Rn activi- decreases in222Rn activities relative to the base case for
ties were calculated for different NAPL contents with every NAPL content. A minimum relative activity of 46% Eq. [4] (Fig. 1), using Sivalues estimated from the uncon- relative to the base case was found immediately above taminated batch experiments (Table 1). The measured the groundwater table for the highest modeled NAPL steady-state activities closely matched the predicted contentnof 0.08. This is 184 L of NAPL per square
me-values (Fig. 1). ter of vadose zone for a soil column of 2.3-m depth, and
corresponds to about 20% NAPL in the pore space. In
Analytical Model for Homogeneous Profile
the case of variable volumetric water contents (Fig. 2B),maximum222Rn activities are also always observed above
The influence of variable volumetric NAPL content on
the groundwater surface. They increase 2.2-fold when the the222Rn profile in soil gas was modeled for the
homog-water contents increase from 0.1 (base case) to 0.25. For eneous vadose zone using Eq. [1] and [3c]. The
configu-a completely dry homogeneous profile, 222Rn activities
ration of the model (i.e., depth to groundwater) and the
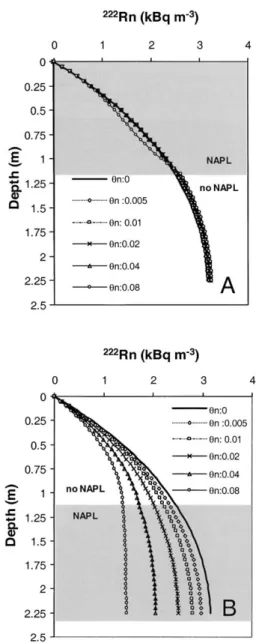
Fig. 4. Modeled222Rn activities in a heterogeneous sandy vadose zone
with a impermeable surface cover. The upper layer is contaminated with NAPL, similarly as in Fig. 3A.
creased NAPL content, especially in the lower part of the profile. Maximum222Rn activities for the case when
n ⫽ 0.08 are 46% of the activities of the base case,
similarly as for the homogeneous model.
The influence of an impermeable soil cover layer is investigated in Fig. 4, where variable NAPL contents are assumed in the upper profile layer. Constant222Rn
activities of 5 kBq m⫺3were found at all depths for the
uncontaminated case. For the contaminated cases,222Rn
activities decreased with respect to the uncontaminated case. The minimum activity was 1.8 kBq m⫺3 for
n⫽
0.08, directly below the soil cover.
Analytical Model for Three-Layered Profiles
We now show results for an uncovered layered vadose zone with three different layers, of which the intermedi-ate layer is contaminintermedi-ated with NAPL. Results were
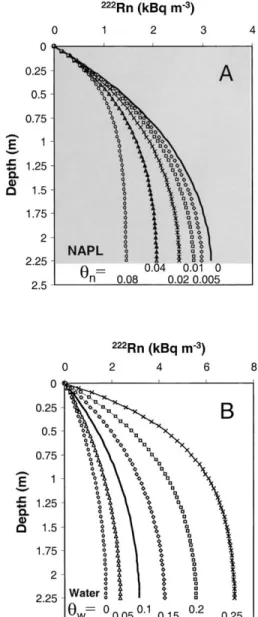
ob-Fig. 3. Modeled222Rn activities in a heterogeneous sandy vadose zone tained using the analytical model given in the Appendix,
with two layers of equal thickness having different volumetric NAPL Part B. The configuration is the same the lysimeter
ex-contentsn: (A) NAPL contamination in upper layer and (B) NAPL periment. An increasing NAPL content of a layer from
contamination in lower layer.
the 1- to 1.2-m depth was found to affect the222Rn
pro-files as shown in Fig. 5A. The highest NAPL spill
corre-Analytical Model for Two-Layered Profiles
sponded to 16 L m⫺2. We found that222Rn activitiesde-creased by up to 20% within and above the contaminated The influence of variable NAPL content in a
two-lay-layer. Radon activity distribution below the NAPL layer ered vadose zone was modeled using the analytical
solu-was not influenced significantly by the NAPL. When a tions given in the Appendix, Part A. Apart from the
2-m-deep contaminated layer with n⫽ 0.08 (16 L of
heterogeneity, the model parameters remained the same
NAPL m⫺2) was placed at different depths in the soil
as for the homogeneous case. Residual NAPL was placed
column (Fig. 5B), the 222Rn activities either increased
in an unsealed upper layer of 1.15-m depth, with the lower
or decreased relative to the base case. For a NAPL re-vadose zone layer assumed to be free of NAPL (Fig. 3A).
siding high in the vadose zone, increases in222Rn
activi-The total amount of NAPL for the most polluted case
ties will occur below the NAPL layer. For a NAPL was 92 L m⫺2. The resulting222Rn depth profiles of the
residing near the groundwater table at the 2.3-m depth, NAPL-contaminated scenarios deviated only slightly
slight lower 222Rn activities will result throughout the
from the uncontaminated case (Fig. 3A). A 3% increase
profile (Fig. 5B). in222Rn activities below the 1.2-m depth was calculated
for the situations where the upper layer is contaminated
Lysimeter Experiment
withn⫽ 0.08. The reverse situations (Fig. 3) involved
varying NAPL contents in the lower half of the profile. Radon-222 activities in the lysimeter were measured 10 and 28 d after contamination with NAPL to allow the These situations lead to lower222Rn activities with
in-Reproduced from Vadose Zone Journal. Published by Soil Science Society of America. All copyrights reserved
.
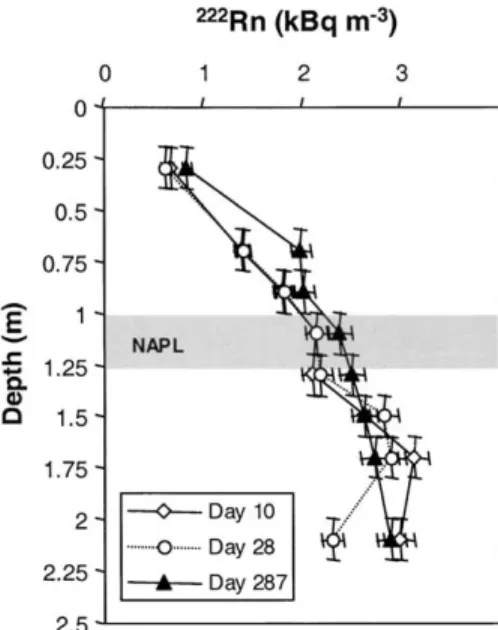
Fig. 6. Measured222Rn activities in lysimeter experiment. NAPL
con-tentnwere 0.01 (Day 10), 0.003 (Day 28), and⬍0.001 on Day 287
in the intermediate layer between 1 and 1.2 m depth. Error bars
represent 5% for the activity measurements, and⫾0.1 m for depth
(accounting for the reach of sampling tubes).
and on Day 287, the NAPL was below the detection limit of 0.001 (Dakhel et al., 2003).
DISCUSSION
Batch Experiments
A nonlinear relationship between 222Rn activity at
equilibrium steady-state and NAPL content was found using the batch experiments (Fig. 1). Radon-222 activi-ties decreased by a factor of 2.9 within the range of volumetric NAPL contents typically found in porous media (Mercer and Cohen, 1990). The analytical model (Eq. [1]) predicted the nonlinear decrease quite satisfac-torily. Nonlinearity is generated by the interdependency
Fig. 5. Modeled222Rn activities in a heterogeneous sandy vadose zone
of NAPL and air content (n and a in Eq. [1] and with three vadose zone layers. (A) Only an intermediate layer from
the 1- to 1.2-m depth is contaminated with different volumetric NAPL in Eq. [2d]). Assuming overall errors in 222Rn activity
contentsn(corresponding to Fig. 6). (B) A 0.2-m-thick interme- measurements of 10%, the smallest NAPL content that
diate layer withn⫽ 0.08 (16 L NAPL m⫺2) is placed at different can significantly be deduced from batch experiments is
depths, with L1being the depth to contamination.
n⫽ 0.0075. The air–NAPL partitioning coefficient Kn
was measured for gasoline, kerosene, and diesel fuel by establishment of steady-state vertical activity profiles. Schubert et al. (2001), who reported an uncertainty of Both profiles showed a steady increase in 222Rn from
⫾10.5%. Results of our batch experiments suggest that the soil surface to the 1.1-m depth, followed by a slight the K
nfrom Schubert et al. (2001) is applicable also to
decrease to the 1.3-m depth, and then again an increase.
our study. We note that similar air–NAPL partitioning Maximum activities of 3.1 and 3.0 kBq m⫺3were found
coefficients can also be obtained from the Henry coeffi-each day at the 1.7-m depth. The deepest soil gas probe
cient (Table 1) divided by NAPL–water partitioning at the 2.1-m depth revealed lower222Rn activities,
partic-coefficients, as found in the literature of222Rn as a tracer
ularly on Day 28 (Fig. 6). The 222Rn profile measured
for the saturated zone (Hunkeler et al., 1997; Semprini on Day 287 showed an increase throughout the lysime- et al., 2000).
ter, with a maximum of 2.9 kBq m⫺3at the 2.1-m depth.
From soil core analyses a NAPL content of 0.01⫾ 0.002
Assumptions and Verification of
(⫽2 L m⫺2) was measured at Day 0 between the 1- and
the Transport Model
1.2-m depths. The measured NAPL content was slightly
lower than the planned content (3.2 L m⫺2) because of For this study, we used an existing analytical
one-dimensional reactive transport model that was previ-some losses of volatile compounds during packing of
the lysimeter. On Day 30, a NAPL content of 0.003⫾ ously verified for homogeneous noncontaminated dry sand column (Van der Spoel et al., 1997) and extended 0.002 was found in samples from the 1- to 1.23-m depth,
Reproduced from Vadose Zon
e Journal. Published by Soil Science Society of America. All copyrights reserved.
the model to profiles containing homogeneously and of adding either water or NAPL to a vadose zone is that the production rate of222Rn in pore space S
iincreases as heterogeneously distributed NAPLs. Except for having
different fluids, the relevant assumptions of our model adecreases (Eq. [2d]). The increase was found to be 33%
for a NAPL or water content increase of 0.08 (Table 2). are thus the same as used previously (Van der Spoel
et al., 1997). The influence of water and NAPL on the
diffusion coefficient was modeled by using the classical
Heterogeneous NAPL Distribution
relationship (Eq. [2c]) developed by Millington andFor the two-layered system with NAPL pollution in Quirk (1961). Diffusive gas tracer tests in the lysimeter
the upper half of the profile, local222Rn minima were
(Werner and Ho¨hener, 2003) previously showed that
found to be indicative for NAPL only for cases where this relationship gives good estimates for the effective
the site is sealed with a soil cover. The model suggests diffusion coefficient. Schubert and Schulz (2002) and
that at sites without an impermeable soil cover, 222Rn
Bunzl et al. (1998) investigated processes that were
ne-measurements will yield relatively little information glected in the model such as gas advection due to
atmo-about the degree of NAPL contamination (Fig. 3A). spheric pressure variations or temperature changes at
However, for sites with impermeable soil surface layers, the soil surface. They found that these processes had only
large deviations were found below the surface (Fig. 4). minor impact on steady-state 222Rn profiles. The lower
Radon sampling at such sites should then be as shallow boundary condition used for the model was a no flux
as possible. condition, thus reflecting a groundwater surface without
When the NAPL is in the lower half of the soil profile
222Rn loss. This assumption is sound for stable
ground-(e.g., at sites contaminated with lighter-than-water NAPLs water tables where the diffusion in the water phase limits
floating on groundwater and being dispersed by water the transfer of dissolved222Rn to soil air. In the case of
table fluctuations in the vadose zone),222Rn minima will
a retreating water table, a rapid net flux of222Rn from
occur in the deeper part of the profile (Fig. 3B). When groundwater to the vadose zone may occur (Cecil and
the NAPL contamination occurs in intermediate vadose Green, 1999), as experimentally shown for volatile
halo-zone layers (e.g., due to leaking underground pipelines), genated pollutants in a laboratory column (Werner and
the model results (Fig. 5) show that the vertical position, Ho¨hener, 2002b). We note in addition that usually a
cap-extension, and quantity of NAPL will determine the illary fringe is found above the groundwater table, which
shape of the222Rn profile. Radon-222 activities may then
may extend significantly into the vadose zone. Models
increase or decrease. A NAPL-polluted layer relatively using constant w are expected to produce erroneous high in the vadose zone will lead to an increase in222Rn
results within the capillary fringe. In our lysimeter study,
in the lower layers with respect to the base case, since the the capillary fringe was, however, limited to⬍7 cm (Dak- NAPL layer hinders222Rn diffusion to the atmosphere.
hel et al., 2003). The homogeneous model (base case)
Nonaqueous phase liquid layers with thicknesses smaller predicted maximum222Rn activities of 3.16 kB m⫺3for
than the characteristic diffusion length of222Rn (Table
the uncontaminated lysimeter using the parameters in
2) will not markedly influence the 222Rn distributions
Table 1. This agrees with measured activities in the vs. depth. Given that the characteristic diffusion length lysimeter (Fig. 6), but is lower than222Rn activities
mea-at a NAPL content of 0.08 is 0.46 m, it follows thmea-at only sured with the uncontaminated batch experiments. The NAPL layers of this extent or larger will significantly lower activities in the lysimeter can be explained by the influence the222Rn profile.
lack of a soil cover and diffusive transport of222Rn to
the atmosphere.
Lysimeter Experiment
The vertical 222Rn profiles obtained in the lysimeter
Homogeneous Vadose Zone
experiment reflect additional difficulties that may be For a homogeneous vadose zone with unsealed sur- encountered when using222Rn as a NAPL tracer. First,
face, the model predicted that222Rn activities will vary 222Rn measurements are affected by errors due to
sam-within a factor of 2.2 for NAPL contents between 0 and pling and analytical precision, as depicted by the error 0.08 (Fig. 2A), and within about a factor of 4 for differ- bars in Fig. 6. The sampling may be biased by the fact ent volumetric water contents between 0 to 0.25 (Fig. that soil gas is drawn from a sphere around a soil gas 2B). Nonaqueous phase liquids can take up significant port. In our case, this sphere had an estimated radius of amounts of222Rn, with the fraction in soil air f
i(Eq. [1]) about 10 cm. The analytical precision is a function of decreasing from 0.92 (noncontaminated) to 0.2 (atn⫽ statistics of counting radioactive decay. In this study,
0.08, Table 2). Nonaqueous phase liquid also decreases sand with a low222Rn activity was chosen, with counting
the effective diffusion coefficient by a factor of 2.6 (Ta- errors are as high as 10%. As a result of both spatial ble 2). As a result, the characteristic diffusion length of and analytical errors, 222Rn soil gas profiles measured 222Rn in a NAPL-contaminated soil decreases from 1.39 on Days 10 and 28 when NAPL was present were not
to 0.46 m (Table 2), leading to distributions that ap- statistically different from the profile measured on Day proach the large-depth asymptote more quickly than in 287 when no NAPL was present, although one measured
an uncontaminated profile. point at a depth of 1.3 m deviated from the rest. In view
Water increases222Rn activities in soil air since it occu- of this single point, however, one may not draw
conclu-pies pore space that otherwise would be filled with soil sions on the presence or absence of NAPL in the profile. We notice here that the experiment involved only a rela-air and does not solubilize much222Rn. A further effect
Reproduced from Vadose Zone Journal. Published by Soil Science Society of America. All copyrights reserve
d.
Nonaqueous phase liquid influences all parameters with sub-tively low NAPL content because of the different aims
script i (see Tables 1 and 2 of manuscript for notations and of the original study. The modeled222Rn profile for
n⫽
values). At the soil surface z⫽ 0, the222Rn concentration is
0.01 in Fig. 5A suggests that the expected deviation from
zero. At z⫽ L, there is a groundwater table with a zero flux the base case will be very small. Thus, the experimental
boundary condition. First, we calculate the profile in the upper data and the modeling results remain within errors of
vadose zone (0⬍ z ⬍ L1) and set the unknown gradient at
both approaches. Schubert and coworkers injected 25 the layer boundary as x. We calculate the Rn activity profile L of diesel fuel at the 1.2-m depth into a 2-m-deep governed by diffusion, decay, and production at steady state. lysimeter having 1-m2surface area (Meissner et al., 2000;
The governing equation and boundary conditions for the Schubert, 2001). They found a decrease in222Rn
activi-upper profile are ties of more than 50% in the lower part of the lysimeter,
and a decrease of about 10% in the upper vadose zone. f
1D1
冤
d2
dz2A(z)
冥
⫺ A(z) ⫹ f1S1⫽ 0 A(0)⫽ 0These findings agree qualitatively with the modeling
results in Fig. 3B. However, the exact location of the D(A)(L
1)1D1⫽ x
NAPL at the time of measurement was not reported,
The analytical solution for depth 0⬍ z ⬍ L1was found by
and quantification of222Rn activities in the deeper part
using the software Maple (Vs. 8, Waterloo Maple Inc.): of the profile may have been biased by interactions of
the diesel fuel with the emplaced in situ Rn probes (Schubert, 2001). The experiment of Schubert and
col-leagues, however, illustrate that222Rn activities can be A(z)⫽ ⫺
e
冢
√ z √f1√D1冣 冤
1D1f1S1⫺ x√f1√D1e冢
√ L 1 √f1√D1冣
√冥
1D1冦冤
e冢
√ L1 √f1√D1冣冥
2 ⫹ 1冧
⫺ an important indicator of large NAPL spills in the lowerhalf of an artificially constructed vadose zone.
e
冢
⫺√ z √f1√D1冣
e冢
√ L1 √f1√D1冣 冤
x√f1√D1√ ⫹ 1D1f1S1e冢
√ L1 √f1√D1冣冥
1D1冦冤
e冢
√ L1 √f1√D1冣冥
2 ⫹ 1冧
⫹f1S1 CONCLUSIONS AND OUTLOOK
The batch experiments presented in this study suggest that the naturally occurring noble gas222Rn is a potential
For the profile in the lower vadose zone, the equations are tracer for vadose zone contamination by NAPLs.
Sam-pling and analysis is relatively simple, fast, and easily
f2D2
冤
d2
dz2A(z)
冥
⫺ A(z) ⫹ f2S2⫽ 0combined with traditional soil gas monitoring. However, our modeling shows that changes in the equilibrium
D(A)(L1)2D2⫽ x D(A)(L)⫽ 0 222Rn activities due to NAPL contamination are
gener-ally less distinct in the field than in batch experiments The analytical solution valid for depths L
1⬍ z ⬍ L is
since diffusive transport of222Rn has a tendency to smooth
the activity gradients, especially when no soil cover is present. For those sites, we do not have a straightforward
A(z)⫽ ⫺ e
冢
√
z√
f2√
D2冣
x√
f2e冢
√
L1√
f2√
D2冣
√
D2√
2冦
⫺冤
e冢
√
L1√
f2√
D2冣冥
2 ⫹冤
e冢
√
L√
f2√
D2冣冥
2冧
⫺diagnostic test to positively identify NAPLs at any depth. For sites with impermeable soil covers,222Rn minima due
to NAPL contamination will be much larger. A diagnos-tic test for NAPL would then involve taking222Rn
sam-ples at shallow depths and compare them with samsam-ples from a covered but uncontaminated control location.
e
冢
⫺√
z√
f2√
D2冣
x√
f2e冢
√
L1√
f2√
D2 ⫹ 2√
L√
f2√
D2冣
√
D2√
2冦
⫺冤
e冢
√
L1√
f2√
D2冣冥
2 ⫹冤
e冢
√
L√
f2√
D2冣冥
2冧
⫹ f2S2 At real sites, it would be expected that differences in222Rn activities would also occur due to changes in
geol-ogy (i.e., changes in Rd concentration, Rn emanation
coefficients and porosity). A thorough knowledge of spa- The boundary condition at L1is given in the manuscript
(Eq. [3d]). The unknown activity gradient x at the boundary tial geology changes and analyses of222Rn profiles in
un-at L1is found by setting A(z ⫽ L1) of the upper profile ⫽
contaminated and contaminated locations of the same
A(z⫽ L1) of the lower profile and solving for x. This gave:
field site would then be necessary to effectively use222Rn
as a NAPL tracer in vadose zones. Future work should also
冢
x⫽√D221D1冤
2 e冢
√ L1(√f2√D2⫹ 2√f1√D1)
√f1√D1√f2√D2
冣
f1S1⫺
include possible effects of real problems having a three-dimensional geometry, since the model presented in this study is applicable only to one-dimensional problems.
2 e
冢
√ (L1√f2√D2⫹ 2L√f1√D1) √f1√D1√f2√D2冣
f1S1⫺
APPENDIX: ANALYTICAL MODEL FOR
f2S2e
冢
2√ (L1√f2√D2⫹ L√f1√D1)
√f1√D1√f2√D2
冣
⫹ LAYERED VADOSE ZONESPart A: Two Layers
f2S2e
冢
2√ L1 √f2√D2冣
⫺ f2S2e冢
2√ L √f2√D2冣
⫹ f1S1e冢
2√ L √f2√D2冣
⫺ This model describes the scenario with two vadose zonelayers of which one is contaminated with NAPL, the other is
not. The upper vadose zone extends from z⫽ 0 to z ⫽ L1, f1S1e
冢
2√ L1(√f2√D2⫹√f1√D1)√f1√D1√f2√D2
冣
⫹ and the lower layer from z ⫽ L1 to z ⫽ L (total depth).Reproduced from Vadose Zone Journal. Published by Soil Science Society of America. All copyrights reserved
.
characterization at a contaminated field site using partitioning in-terwell tracer technology. Environ. Sci. Technol. 33:2745–2751.
f1S1e
冢
2√ (L1√f2√D2⫹ L√f1√D1)
√f1√D1√f2√D2
冣
⫺ Dwarakanath, V., N. Deeds, and G.A. Pope. 1999. Analysis of parti-tioning interwell tracer tests. Environ. Sci. Technol. 33:3829–3836. Feenstra, S., and J.A. Cherry. 1996. Diagnosis and assessment of
f1S1e
冢
2√ L1 √f2√D2冣
⫹ f2S2e冢
2√ L1(√f2√D2⫹√f1√D1) √f1√D1√f2√D2冣冥
冒
DNAPL sites. p. 395–473. In J.F. Pankow and J.A. Cherry (ed.) Dense chlorinated solvents and other DNAPL sites. Waterloo Press, Portland, OR.
冦
√冤
e冢
2√ L1(√f2√D2⫹√f1√D1)√f1√D1√f2√D2
冣
√D22√f1√D1⫺ Hoehn, E., and H.R. von Gunten. 1989. Radon in groundwater: A
tool to assess infiltration from surface waters to aquifers. Water Resour. Res. 25:1795–1803.
Ho¨hener, P., C. Duwig, G. Pasteris, K. Kaufmann, N. Dakhel, and e
冢
2√ (L1√f2√D2⫹ L√f1√D1)√f1√D1√f2√D2
冣
√D22√f1√D1⫺ H. Harms. 2003. Biodegradation of petroleum hydrocarbon vapors:
Laboratory studies on rates and kinetics in unsaturated alluvial sand. J. Contam. Hydrol. 66:93–115.
e
冢
2√ L1√f2√D2
冣
√D22√f1√D1⫹ e
冢
2√ L √f2√D2冣
√D22√f1√D1⫺ Hunkeler, D., E. Hoehn, P. Ho¨hener, and J. Zeyer. 1997.222Rn as a
par-titioning tracer to detect mineral oil contaminations: Laboratory experiments and field study. Environ. Sci. Technol. 31:3180–3187. e
冢
2√ L1(√f2√D2⫹√f1√D1)√f1√D1√f2√D2
冣
√f21D1⫺ e
冢
2√ L1√f2√D2
冣
√f21D1⫺ Looney, B.B., and R.W. Falta. 2000. Vadose zone. Vol. 1. Battelle
Press, Columbus, OH.
Mariner, P.E., M.Q. Jin, J.E. Studer, and G.A. Pope. 1999. The first vadose zone partitioning interwell tracer test for nonaqueous phase e
冢
2√ (L1√f2√D2⫹ L√f1√D1)√f1√D1√f2√D2
冣
√f21D1⫺
liquid and water residual. Environ. Sci. Technol. 33:2825–2828. Meissner, R., H. Rupp, and M. Schubert. 2000. Novel lysimeter
tech-niques—A basis for the improved investigation of water, gas, and e
冢
2√ L√f2√D2
冣
√f21D1
冥冧冣
solute transport in soils. J. Plant Nutr. Soil Sci. 163:603–608. Mercer, J.W., and R.M. Cohen. 1990. A review of immiscible fluids
in the subsurface: Properties, models, characterization, and remedi-Part B: Three Vadose Zone Layers ation. J. Contam. Hydrol. 6:107–126.
Millington, R., and J.P. Quirk. 1961. Permeability of porous solids. Three vadose zone layers are present in this scenario: the
Trans. Faraday Soc. 57:1200–1207.
upper layer extends from z⫽ 0 to z ⫽ L1and is not contami- Nazaroff, W.W. 1992. Radon transport from soil to air. Rev.
Geo-nated, the intermediate layer extends from z⫽ L1to z⫽ L2 phys. 30:137–160.
and contains NAPL, and the lower layer from z⫽ L2to z⫽ Pasteris, G., D. Werner, K. Kaufmann, and P. Ho¨hener. 2002. Vapor
L (total depth) is free of NAPL again. The same equations phase transport and biodegradation of volatile fuel compounds in and boundary conditions as in Part A apply, except that two the unsaturated zone: A large scale lysimeter experiment. Environ. unknown boundary conditions exist at z⫽ L1and at z⫽ L2 Sci. Technol. 36:30–39.
Robbins, G.A., B.G. Deyo, M.R. Temple, J.D. Stuart, and M.J. Lacy. (see Eq. [3d]). The analytical solutions were found again using
1990. Soil-gas surveying for subsurface gasoline contamination the Maple software. They are not printed here for sake of
using total organic vapor detection instruments. Part I. Theory and brevity.
laboratory experimentation. Ground Water Monit. Remed. 10: 122–131.
ACKNOWLEDGMENTS Schubert, M. 2001. Detection of subsurface contamination by NAPLs with the aid of radon measurements in soil air. (In German.) Ph.D. This study benefited from cooperation within the European
diss. Umweltforschungszentrum Leipzig-Halle, Leipzig-Halle. project Groundwater Risk Assessment at Contaminated Sites, Schubert, M., K. Freyer, H.C. Treutler, and H. Weiss. 2000. Radon-GRACOS, EVK1-CT-1999-00029. The authors thank D. Wer- 222 as an indicator of subsurface NAPL contamination. p. 127–128. ner, D. Hunkeler, two unknown reviewers, Associate Editor In P.L. Bjerg et al. (ed.) Groundwater 2000. Balkema, Rotterdam, Y. Yortsos, and Editor R. van Genuchten for comments on The Netherlands.
the model and the manuscript, and G. Pasteris and N. Dakhel Schubert, M., K. Freyer, H.C. Treutler, and H. Weiss. 2001. Using the soil gas radon as an indicator for ground contamination by for operating the lysimeter.
non-aqueous phase-liquids. J. Soils Sediments 1:217–222. Schubert, M., K. Freyer, H.C. Treutler, and H. Weiss. 2002. Using
REFERENCES radon-222 in soil gas as an indicator of subsurface contamination
by non-aqueous phase-liquids (NAPLs). Geofisica Internacional Boulding, R.J. 1996. EPA environmental assessment sourcebook.
41:433–437. Ann Arbor Press, Chelsea, MI.
Schubert, M., and H. Schulz. 2002. Diurnal radon variations in the Brusseau, M.L., N.T. Nelson, and M.S. Costanza-Robinson. 2003.
upper soil layers and at the soil–air interface related to meteoro-Partitioning tracer tests for characterizing immiscible-fluid
satura-logical parameters. Health Phys. 83:91–96. tions and interfacial areas in the vadose zone. Available at www.
Semprini, L., O.S. Hopkins, and B.R. Tasker. 2000. Laboratory, field vadosezonejournal.org. Vadose Zone J. 2:138–147.
and modeling studies of radon-222 as a natural tracer for monitoring Bunzl, K., F. Ruckerbauer, and R. Winkler. 1998. Temporal and
small-NAPL contamination. Transp. Porous Media 38:223–240. scale spatial variability of Rn-222 gas in a soil with a high gravel
Surbeck, H. 1993. Radon monitoring in soils and water. Nucl. Tracks content. Sci. Total Environ. 220:157–166.
Radiat. Meas. 22:463–468. Cecil, L.D., and J.R. Green. 1999. Radon-222. p. 175–195. In P. Cook
Van der Spoel, W.H., E.R. Van der Graf, and R.J. deMeijer. 1997. and A. Herczeg (ed.) Environmental tracers in subsurface
hydro-Diffusive transport of radon in homogeneous column of dry sand. geology. Kluwer, Boston.
Health Phys. 72:766–778. Dakhel, N., G. Pasteris, D. Werner, and P. Ho¨hener. 2003.
Small-Werner, D. 2002. Gaseous tracer diffusion from a point source as a volume releases of gasoline in the vadose zone: Impact of the
ad-site investigation method. Ph.D. diss. Swiss Federal Institute of ditives MTBE and ethanol on groundwater quality. Environ. Sci.
Technology, Lausanne, Switzerland. Technol. 37:2127–2133.
Werner, D., M. Broholm, and P. Ho¨hener. 2004. Simultaneous mea-Davis, B.M., J.D. Istok, and L. Semprini. 2002. Push-pull partitioning
surement of nonaqueous phase liquid (NAPL) saturation and dif-tracer tests using radon-222 to quantify non-aqueous phase liquid
fusive fluxes of volatile organic compounds in the vadose zone. contamination. J. Contam. Hydrol. 58:129–146.
Reproduced from Vadose Zone Journal. Published by Soil Science Society of America. All copyrights reserve
d.
Werner, D., and P. Ho¨hener. 2002a. Diffusive partitioning tracer test Whitley, G.A., D.C. McKinney, G.A. Pope, B.A. Rouse, and N.E. Deeds. 1999. Contaminated vadose zone characterization using par-for nonaqueous phase liquid (NAPL) detection in the vadose zone.
titioning gas tracers. J. Environ. Eng. 125:574–582. Environ. Sci. Technol. 36:1592–1599.
Wiedemeier, T.H., H.S. Rifai, C.J. Newell, and J.T. Wilson. 1999. Werner, D., and P. Ho¨hener. 2002b. The influence of water table
Natural attenuation of fuels and chlorinated solvents in the subsur-fluctuations on the volatilization of contaminants from
ground-face. John Wiley and Sons, New York. water. p. 213–218. In S.F. Thornton and S.E. Oswald (ed.)
Ground-Wiegand, J. 2001. A guideline for the evaluation of the soil radon water quality: Natural and enhanced restoration of groundwater
potential based on geogenic and anthropogenic parameters. Envi-pollution. Proceedings of the Groundwater Quality Conference, ron. Geol. 40:949–963.
Sheffield, UK. June 2001. IAHS Publ. 275. IAHS Press, Walling- Wilhelm, E., R. Battino, and R.J. Wilcock. 1977. Low-pressure
solubil-ford, UK. ity of gases in liquid water. Chem. Rev. 77:219–262.
Werner, D., and P. Ho¨hener. 2003. In situ method to measure effective Wilson, D.J. 1997. Soil gas volatile organic compound concentration and sorption-affected gas-phase diffusion coefficients in soils. Envi- contours for locating vadose zone nonaqueous phase liquid
contam-ination. Environ. Monit. Assess. 48:73–100. ron. Sci. Technol. 37:2502–2510.