HAL Id: halshs-01384730
https://halshs.archives-ouvertes.fr/halshs-01384730
Submitted on 20 Oct 2016
HAL is a multi-disciplinary open access archive for the deposit and dissemination of sci-entific research documents, whether they are pub-lished or not. The documents may come from teaching and research institutions in France or abroad, or from public or private research centers.
L’archive ouverte pluridisciplinaire HAL, est destinée au dépôt et à la diffusion de documents scientifiques de niveau recherche, publiés ou non, émanant des établissements d’enseignement et de recherche français ou étrangers, des laboratoires publics ou privés.
Energy Consumption and Health Outcomes in Africa
Adel Ben Youssef, Laurence Lannes, Christophe Rault, Agnès Soucat
To cite this version:
Adel Ben Youssef, Laurence Lannes, Christophe Rault, Agnès Soucat. Energy Consumption and Health Outcomes in Africa. Journal of Energy and Development, International Research Center for Energy and Economic Development, 2016, 41 (1 & 2). �halshs-01384730�
Energy Consumption and Health Outcomes in Africa
1Adel BEN YOUSSEF2
Université Côte d‟Azur, CNRS, GREDEG, France.
adel.ben-youssef@gredeg.cnrs.fr Laurence LANNES
World Bank llannes@worldbank.org
Christophe RAULT
University of Orléans, CNRS, LEO UMR 7322, rue de Blois-BP 26739, 45067 Orléans, France.
1
Adel Ben Youssef, Associate Professor at the Université Côte d‟Azur, holds a PhD from The University of Nice Sophia-Antipolis. He works for University Paris Sud and EDHEC Business School before joining the University of Nice. Dr. Ben Youssef has coordinate several research projects in multi-lingual and multi-cultural setting for African Development Bank, European Commission, French Ministries, Economic Research Forum Cairo, and UNDP.Dr. Ben Youssef has published more than 50 academic papers in different fields like (Energy Economics, Digital Economics, Industrial Economics and Environmental Economics). His publications are in Journals like:
World Development, Environmental and Resources Economics, Journal of Agriculture and Food Industrial Organization, Energy Policy, Energy and Development Economics, Oxford Development Studies, Middle East Development Journal, Economics Bulletin, Journal of Applied Business Research, European Journal of Industrial Economics and Policy among others.
Laurence Lannes, Senior Economist at the World Bank, holds a PhD from London School of Economics. She has worked as a health economist for ten years with the World Bank and African Development Bank, with a strong focus on health financing and health systems in Africa. Her publications appear in Social Science &
Medicine and the International Journal of Health Planning and Management.
Christophe Rault is a Full Professor of Economics. He has also been a Senior Expert for the European Central Bank (since 2007), for «l‟EcoleNationaled'Administration (ENA)», (since 2010), for «l‟InstitutSupérieur de Gestionet de Planification (ISGP) », of Alger (since 2010). Besides, he has been a Research Network Fellow of CESifo (Center for Economic Studies), Munich (since 2007), a Research Fellow of IZA (Institute for the Study of Labor), Bonn, (since 2003), and a Research Fellow of the William Davidson Institute, of the University of Michigan (since 2007). His applied research interests include energy economics, labor economics, international macroeconomics, and transition economics. His publications have appeared in Ecological Economics, Economic
Letters, Energy Economics, Energy Policy, Environmental & Resource Economics, Oxford Bulletin of Economics and Statistics, Oxford Economic Papers, Journal of Comparative Economics, theJournal of Economic History, Journal of Economic Integration, Journal of Economic Surveys, and Review of World Economics among others.
Agnes Soucat is the Director for Health Systems, Governance and Financing at the WHO in Geneva. Until recently she was Global Leader Service Delivery and Lead Economist at the World Bank. She previously was the director for Human Development for the African Development Bank, where she was responsible for health, education, and social protection for Africa, including 54 countries in sub-Saharan Africa and the Maghreb. She has over 25 years of experience in health and poverty reduction, covering Africa, Asia and Europe. She was a pioneer of several innovations in health care financing including community based financing and performance based financing and authored seminal publications on these topics. She is also the co-author of the World Development Report 2004 “Making Services Work for Poor People” and of the Lancet Commission report “Global Health 2035: a world converging within a generation”. She recently was commissioner of the recentLancet and Rockefeller Commission on Planetary Health. DrSoucat did also extensive work on the health labor market dynamics in Africa. DrSoucat holds an MD and a Masters in Nutrition from the University of Nancy in France as well as a Master of Public Health and PhD in Health Economics from the Johns Hopkins University.
2Authors are grateful to helpful comments and discussions with Professor Mohamed Arouri, Professor
christophe.rault@univ-orleans.fr Agnès SOUCAT World Health Organization
Soucata@who.int
A
BSTRACTWe examine causal links between energy consumption and health indicators (Mortality rate under-5, life expectancy, greenhouse effect, and government expenditure per capita) for a sample of 16 African countries over the period 1971-2010 (according to availability of countries' data). We use the panel-data approach of Kónya (2006), which is based on SUR systems and Wald tests with country specific bootstrap critical values.Our results show that health and energy consumption are strongly linked in Africa. Unilateral causality is found from energy consumptionto life expectancy and child under-5 mortality for Senegal, Morocco, Benin, DRC, Algeria, Egypt, and South Africa. At the same time, we found a bilateral causality between energy consumption andhealth indicators in Nigeria. In particular, our findings suggest that electricity consumption Granger causes health outcomes for several African countries.
JEL Classification: Q43, Q53, Q56
1. Introduction
Economic growth in industrialized countries has historically gone hand-in-hand with increasing energy intensity[Reference]. This is also the case for developing countries where impacts of energy consumption and use on economic development and the progress are increasingly significant [reference]. Africa is following the same trend andthe intensity of energy consumption is increasing rapidly with the economic growth in the last decade.
Africa is experiencing recent rapid economic development and an increasing demand on energy supply. The Continent presents mixed situation with large energy producing countries relying on oil and gas (mainly in North Africa); other countries largely relying on coal (South Africa); and Sub-Saharan Africa havingstrong dependence on biomass. The expected boom of the African population with an increase from 1 billion to 2.3 billion people by 2030 makes it necessary to consider the sustainability of energy use in order to mitigate environmental and public health damages.
Threemain problems can be identified when discussing the energy-health nexus in Africa. Firstly,many African citizens have insufficient access to modern energy sources and largely rely on biomass. This causes health problems due to indoor air pollution caused by the use of traditional fuels. In fact, a large majority of the population is facing problems with access to energy due tounavailability and unaffordability of modern energy sources. Energy poverty and insecurity are major components of poverty [Reference]. Secondly, increasing urbanization, in particular in big cities, seems to present serious negative effects on health when the populations in the new urban areas are lacking access to clean and affordable energy sources [reference]. The combustion of biomass and the coal in urban areas leads to high levels of indoor and outdoor air pollution. This air pollution is exacerbated by the use of “non-clean” technologies by industries and inefficient transports. Thirdly, global warming is modifying Africans life style with deep impact on their health. Global warming and the desertification of certain areas result in the depletion of some traditional energy sources like biomass.
Several papers reported positive effects of energy consumption on economic growth (Arouri et al. 2014, Adom, 2013), education (Ben Abdelkarimet al. 2014 b) andemployment (Adom,2014) in Africa. However, less is known about the effects of energy consumption on health in Africa. Researchers report balanced effects: while for some of them each further
increase in energy consumption produces ever-smaller health gains, others have shown that energy use engender indoor and outdoor pollutions with significant impacts on environment and public health. Pollutants, such as Inhalable Particulate Matter (PM), Methane, micro metal elements, and SO2 have been destroying the environment and affecting public health negatively. Respiratory infections caused by air pollution from energy incomplete combustion are the main threat to the health in developing countries.Wang (2010) reports that 43 millions people would die of respiratory infection each year. However, global studies showing the long-run effects are lacking.
The objective of this paperis to address this gap in knowledge by (i) proposing an analytical framework to discuss the health effect of energy and electricity consumption in Africa; (ii) empirically identifyinghowincreased energy consumption (especially electricity) can improve health outcomes in Africa; and (iii) exploringdirect causality between energy consumption, under-5 child mortality and life expectancy as well as indirect causality between energy consumption, greenhouse effect (air pollution) and government health expenditure. The analysis focuses on 16 African countries.
The first part of the paperdiscusses the positive and negativeimpacts of energy consumption on health. The second part presents the methodology, parameters, and data used. A policy discussion is engaged in the third section followed by recommendations.
2. Expected Health impacts of Energy use and electricity consumption
Energy and public health have not been analyzed together in a single framework until recently, and environment is usually looked as the media in the chain of energy, emission, environment, and human health. We propose in this section to identify the main health problems in Africa and to identify how provision of clean energy can improve Africa’s health outcomes.
2.1. What are the main health problems due to insufficient energy consumption?
Energy consumption and electricity consumption have several direct and indirect impacts on health. This section summarizes the main effects and discusses the channels through which energy consumption (electricity consumption) can affect negatively or
positively a population‟shealth. We restrict ourselves to the channels that are the most pertinent in the African context.
Indoor pollution due to use of biomass
Energy is essential for cooking and heating. It permits access to cooking and hot meals. Evidence on link between good nutrition in children and good health outcomes (also education outcomes) is well established.Lack ofaccess to modern energy sources lead to the usage of biomass energy (mainly woods) as the principal source of energy. The World Health Organization (WHO) estimates that 3 billion people in the World are using Biomass for cooking (2006). While biomass permits access to hot meals and heating, the inefficient burning of solid fuels on an open fire or traditional stove indoors creates a dangerous cocktail to hundreds of pollutants, primarily carbon monoxide and small particles, but also nitrogen oxides, benzene, butadiene, formaldehyde, polyaromatic hydrocarbons and many other health-damaging chemicals. Where coal is used we can add to this list of pollutants sulfur, arsenic and fluorine. The problem of indoor air pollution still fail to mobilize the international community while the WHO estimates also that 4.3 million people a year die prematurely from illness attributable to the household air pollution caused by the inefficient use of solid fuels (WHO, 2014). Indeed, several diseases are associated with indoor pollution such as acute infections of the lower respiratory tract, chronic obstructive pulmonary disease, lung cancer, asthma, cataracts and tuberculosis. In 2002, in Sub-Saharan Africa 396 000 deaths were due to indoor smoke (WHO, 2006).In context of the contribution of energy technologies, Ezzati and Kammen (2002) studied the effect of indoor air pollution on the residents’ health during the two years after advanced energy technologies were introduced. The result showed that stove efficiency innovation could significantly decrease mortality and acute respiratory infections in children.
The indoor pollution problem has a gender bias aspect since women and young girls in developing countries are particularly affected by the negative health outcomes of indoor air pollution (IAP) from the use of solid fuels. Since women are usually responsible for cooking while taking care of children, women and children are most exposed to IAP from the use of solid fuel and its subsequent health impacts. This activity has also an impact in matter of time spent by children and women in order to collect woods and biomass sources of energy. This time devoted to collecting woods and biomass sources of energy is taken from the time devoted to education or other productive activities.Young children living in households
exposed to biomass indoor pollution have a two to three time greater risk of developing an acute lower respiratory infection (ALRI) than others. They are more susceptible than adults to absorb pollutants, since their lungs are not fully developed until they reach their late teens. A study in rural Kenya found that the amount of pollution a child is exposed to correlates to the risk of developing pneumonia (Ezzati and Kammen, 2002).
Outdoor Pollution
Air pollution has several adverse health effects such as asthmatic, cardio-vascular and other related health outcomes. In spite of an increasing awareness about these effects and “better” legislated air pollution policies in many countries, recent studies estimate that 80% of the world‟s population continue to be exposed to ambient pollution that far exceeds the WHO recommended Air Quality Guideline (AQG) of 10mg/m3 for long-term PM2.5 concentration levels (particulate matter with aerodynamic diameter smaller than 2.5 mm) (Van Donkelaar et al., 2010; Rao et al., 2012; Brauer et al., 2012).
Moreover, the increasing urbanization of the African continent and the emergence of megacities like Cairo, Casablanca, Lagos, Kampala has been shown to be associated with air pollution and public health issues [Ref]. Inefficient means of transport, usage of “non-clean” technologies and inefficient ways of cooking have engendered important air pollution and concentration of PM. Estimates indicate that outdoor and household air pollution are globally among the leading causes of mortality and morbidity related outcomes in developing countries (Lim et al., 2012). Emissions from cooking stoves continue to be a major component of global anthropogenic particulate matter (e.g., (UNEP/WMO, 2011)) in particular in Africa and South Asia where emissions from cooking stoves are well over 50% of anthropogenic sources (Bond et al., 2004a, 2013).
Smith (2006) studied air pollution situation in China by referring to the theory of ‘‘Total exposure assessment’’, in which he reviewed the relationship between energy consumption and air pollution, introduced the exposure assessment method, and analyzed the impact of air pollution on public health. Kunzliet al. (2000) analyzed the contributions of air pollution to mortality and morbidity resulted from outdoor and traffic-related air pollution in Austria, France, and Switzerland based on the ‘‘Epidemiology-based exposure–response functions’’.
undertaken in many countries and these are likely to cause energy transformations that will impact air pollution and health related outcomes in the future. There is a growing body of research focusing on the public health and potential climate co-benefits of improving access to modern cooking fuels and stoves in developing countries (Bond et al., 2004b; Haines, 2007; Smith and Balakrishnan, 2009).
Cold related diseases due to lack of energy access
Living in cold homes has been linked to excess winter deaths, Chronic Obstructive Pulmonary Disease (COPD), and respiratory tract infections, as well as increased risk of heart attacks and strokes due to raised blood pressure (Marmot Review Team, 2011). The damp or mould that can accumulate in cold homes has been shown to affect allergic or respiratory conditions including asthma (Fisk et al., 2007) and, in general, stress, depression, and low levels of wellbeing have all been linked with cold or damp housing (Shortt and Rugkasa, 2007). Given the evidence linking cold housing to poor health, it could be assumed that energy efficiency measures should beneficially affect the health of householders. Consistent with this idea, household energy efficiency interventions have been shown to result in a diverse range of positive health impacts (Thomson et al., 2009, 2013), including children's respiratory health, weight and susceptibility to illness, the mental health of adults (Liddell and Morris, 2010), better self-reported health, and reduced respiratory symptoms and school absences due to asthma (PHIS, 2006).
Africa is generally associated with warm and several areas have extreme temperatures like deserts where the temperature is very high during the day and very low at night. Without access to energy there is no way of regulating the temperature and bodies are exposed to several dangers (skin cancer…).
There is also evidence that improved domestic space heating can reduce school absences and health service use for children with asthma (Preval et al., 2010). Given that financial strain may worsen both mental and physical health improving the energy efficiency of homes can also contribute to a better quality of life by reducing energy bills.
Child mortality and inefficient provision of energy
5.9 children aged under five years died in 2015
low income countries. The risk of a child under five dying is about 7 times higher than that of a child in the WHO European Region. . The leading cause among children aged 1-59 months is pneumonia (http://www.who.int/gho/child_health/mortality/causes/en/). Acute lower respiratory infections were responsible for 0.9 million deaths of children under 5 in 2015 (http://apps.who.int/gho/data/view.main.CM1002015WORLD-CH9?lang=en). New born and infants are often carried on their mother‟s back while she is cooking, or kept close to the warm hearth. Consequently, they spend many hours breathing polluted air during their first year of life when they are developing airways and their immature immune systems make them particularly vulnerable. More than half of deaths among children under 5 from acute lower respiratory infections are due to indoor air pollution from household solid fuels (WHO). These deaths are not equally distributed throughout the world: more than one third of the child deaths due to indoor smoke occur on the African Continent.
Thus, energy affects positively and negatively health. The sign of the total effect is not clear and needs to be discussed at continental level as well as over sub-regions. Improved energy services can reduce child mortality, improve maternal health, reduce the time and transport burden on women and young girls, and lessen the pressure on fragile ecosystems. Availability of clinics, care centers and disincentive for doctors and nurses
Another important aspect of energy provision and especially electricity availability is the fact that those facilities are important for health care services. Without electricity most of basic medicine acts cannot be done. Provision of electricity makes it possible to use more sophisticated materials and to act at the nearest place of ill persons, avoiding for them long distance travel and transport which may complicate their initial injuries or diseases. Doctors and nurses are more motivated to access clinics and care centers where energy provision (especially electricity) is available. Lack of electricity is also a disincentive for doctors and nurses to live in those areas and can impact their absence at work. It is obvious that energy and electricity access decreases doctors and nurses absence. Modern energy provision also reduces child mortality, improves maternal health and combats HIV/AIDS, malaria and other diseases. Electricity-access strategies should target public facilities such as health clinics, which benefit the whole population in an area, so that they can provide essential services needed to improve life quality and generate income.
Increasing the availability of energyaffects directly the health of humans. We discuss in this section five channels through which access to modern energy can improve population‟s health.
Revenue generation of energy sector can be used for the health sector
Energy is a special service. Governments generally include several taxes in the energy market. Most of these taxes are settled in order to internalize the externalities of energy. By this mechanism, selling energy generates revenues that can be used to cover hospitals and care centers costs. In some cases, revenue generated from energy improves health services. For example, these revenues can serve to build health centers in rural areas. They can also serve to build medical schools or finance research centers or to strengthen other aspects of the health system including human resources for health and supply chains.
Better refrigeration of basic medicines
Lack of energy is also associated with lack of hygiene conditions and inability to conserve medicines. Sterilized supplies, clean water supply and refrigeration of essential medicines are impaired in health facilities without adequate electricity. Access to modern energy permits the households to buy refrigerators and to keep the medicines available for a long time. Lack of electricity implies also less efficiency in cold chains and distribution of medicines and vaccines.\
Energy consumption can also reduce child mortality
The WHO (2006) shows three main channels through which improvement of energy practices can reduce child mortality. Firstly, reducing indoor air pollution will prevent child morbidity and mortality from acute lower respiratory infections. Secondly, protecting the developing embryo from indoor air pollution can help avert stillbirth, perinatal mortality and low birth weight. Thirdly, getting rid and open fires and kerosene wick lamps in the home can prevent infants and toddlers being burned and scalded.At the same time refrigeration permits medicines conservation and better conservation of food. By this means several diseases can be avoided.
Better energy practices can improve maternal health through three channels. Firstly, curbing indoor air pollution will alleviate chronic respiratory problems among women. Secondly, a less polluted home can improve the health of mothers who spend time close to the fire after giving birth. Thirdly, a more accessible source of fuel can reduce women‟s labor burden and associated health risks such as prolapse due to carrying heavy loads.Lowering levels of indoor air pollution could help prevent tuberculosis cases. Moving up the energy ladder and using improved stoves can increase energy efficiency and decrease greenhouse gas emissions.
Electricity consumption permits access to ICT and to e-Health applications
While there is a consensus about the potential effects of ICT on health in Africa little is said about the access to and consumption of electricity and energy by ICT devices. The health related benefits from ICT are not possible without resolving issues related to energyaccess and consumption , in particular electricity. Alternative solutions, like electricity out of the grid or solar batteriesare partially resolving the problem.
In this section we have seen that poor energy consumption has a negative impact on health outcomes. Increasing the provision of cleaner energy (especially electricity) can substantially improve health outcomes in Africa. Next section proposes the methodology used to identify the long-term relationship between energy consumption and health outcomes.
3. Methodology, data and econometric model
This paper contributes to the literature with a bootstrap panel analysis of causality relationships between energy consumption or electricity consumption and health for a sample of 16 African countries: Algeria, Benin, Cameroon, Democratic Republic of Congo, Egypt, Ethiopia, Ghana, Kenya, Morocco, Mozambique, Nigeria, Senegal, South Africa, Tanzania, Tunisia and Zambia.
Three main reasons justify our sample. Firstly, the availability of data for all our variables. Secondly, the selected countries cover the heterogeneity of Africa since they cover all parts of Africa (South, North East, West and Central Africa). Thirdly, our sample contains the three types of African countries: Fragile States, Middle OncomeCountries and Low Income Countries. We willthus be able to test whether those countries have the same trends.
Data are annual over the period 1991-2010 and sourced from the World Development Indicators. We first estimate a panel Vector AutoRegressive (VAR) model and then implement the panel-data approach of Kónya (2006), based on Seemingly Unrelated Regressions (SUR) system and Wald tests with country specific bootstrap critical values. In the specific framework we use, we allow for cross-country correlation, without the need of pretesting for unit roots and cointegration (as in Phillips, 1995).
We propose to apply a bivariate finite-order vector autoregressive model to energy use or electricity consumption (E) and health (HEALTH):3
i i i i p j p j t i j it j i j it j i i it p j p j t i j it j i j it j i i it b N i T t HEALTH E HEALTH a N i T t HEALTH E E 1 2, 1 2, 1 1 , , 2 , , 2 , , 2 1 1 1 , , 1 , , 1 , , 1 1 ) 1 ( ,..., 1 ,..., 1 ) 1 ( ,..., 1 ,..., 1 where the index i denotes the country, the index t the period, j the lag, and p1i, p2i and p3i, indicate the longest lags in the system. The error terms, and , are
supposed to be white-noises (i.e. they have zero means, constant variances and are individually serially uncorrelated) and may be correlated with each other for a given country, but not across countries.
3 We are grateful to L. Kónya for providing his TSP codes, which we have adapted for our analysis.
i1,...,N
t 1,...,T
1, ,i t
System (1a, 1b) is estimated by the Seemingly Unrelated Regressions (SUR) procedure, since possible links may exist among individual regressions via contemporaneous correlation4 within the two equations. Wald tests for Granger causality are performed with country specific bootstrap critical values generated by simulations.
With respect to system (1a, 1b), in countryi there is one-way Granger-causality from HEALTHto E if in the first equation not all are zero but in the second all are zero; there is one-way Granger-causality from E to HEALTH if in the first equation all are zero but in the second not all are zero; there is two-way Granger-causality between E to HEALTH if neither all nor all are zero; and there is no Granger-causality between E to HEALTH if all and are zero.5
This procedure has several advantages. First, it does not assume that the panel is homogenous, so it is possible to test for Granger-causality on each individual panel member separately. However, since contemporaneous correlation is allowed across countries, it makes it possible to exploit the extra information provided by the panel data setting and therefore country-specific bootstrap critical values are generated. Second, this panel approach which generalizes the methodology developed by Phillips (1995) that tests for non-causality in levels VARs, in a time series context, does not also require pretesting for unit roots and cointegration, though it still requires the specification of the lag structure (which is determined here using the Akaike Information Criterion (AIC) and the Schwarz Information Criterion (SIC)). This is an important feature since the unit-root and cointegration tests in general suffer from low power, and different tests often lead to contradictory outcomes. Thirdly, this panel Granger causality approach allows the researcher to detect for how many and for which members of the panel there exists one-way Granger-causality, two-way Granger-causality or no Granger-causality.
Data and variables choices
Four indicators were chosen in order to discuss the health outcomes. Firstly, life expectancy at birth as the most common health outcome indicator containing all information about health impacts. Improvements in health are translated in additional years of living. Secondly,
4This assumption is very likely to be relevant for many macroeconomic time series for African countries for which strong economic links exist.
5 As stressed by Kónya (2006) this definition implies causality for one period ahead.
1,i 2,i 1,i 2,i 2,i 1,i 2,i 1,i
5 child mortality since the most important effects isexpected for children. Under-5 child mortality is one of the most important health outcomes. Thirdly, energy causes pollution and pollution causes health damage. We have tried to examine this indirect causality by considering air pollution. Finally we have examined a possible positive effect through the budget allocated to energy. As energy consumption and production grow, it may allow government to strengthen their health system by allocating more available revenue for health. For energy we use energy consumption and electricity consumption. Energy consumption is an indicator of energy supply. It varies from a country to another mainly because the productive sector varies and its consumption varies. We would like to catch these differences in our analysis. At the same time we refine our analysis by examining the electricity consumption as a consumption of high-quality energy. Since Africa is increasing its access to electricity, one can expect to see some significant effects on health outcomes. In fact, as electricity consumption is more related to household energy consumption it has more important effects on health outcomes.
4. Empirical evidence of Energy Health nexus in Africa
In order to show the evidence of energy health nexus, we will start by discussing the link between energy consumption and the main health outcomes (direct and indirect links) before refining the analysis and focus only on electricity consumption effect on health outcomes.
4.1. Energy consumption and health outcomes in Africa
The links betweenenergyconsumptionand Mortality rate, under-5
Estimated coefficient
Test Statistic Bootstrap critical values
1% 5% 10%
Algeria -0.3224 -.75170 7.3793 6.1038 5.0913
Benin -0.0331 -.56388 2.3069 1.8775 1.4871
Cameroon 0.1179 1.9076** 2.0482 1.6508 1.3370
Democratic Republic of Congo -0.0210 -.31700 6.3343 5.2180 4.1493
Egypt -0.2504 -1.5199 11.7078 9.9552 8.6169 Ethiopia -0.0687 -1.4365 5.1380 3.9952 3.0776 Ghana -0.1377 -1.5797* 2.1117 1.7037 1.3870 Kenya -0.1582 -2.9198* 4.4788 3.6049 2.8760 Morocco 0.0608 .68573 8.0484 6.8645 5.8442 Mozambique -0.1049 -3.312*** 2.4353 1.9678 1.5833 Nigeria -0.0261 -.34562 2.1900 1.7358 1.4316 Senegal 0.0160 .60482 4.2183 3.4387 2.8143
South Africa -1.5049 -1.2574 3.6078 2.9448 2.3885
Tanzania -0.1394 -5.874*** 2.6194 2.1515 1.7731
Tunisia -0.2898 -1.3834 9.3009 7.9174 6.8380
Zambia -0.1479 -1.1260 3.1931 2.5810 2.0778
***. **. *: significance at the 1%. 5% and 10% levels respectively. H0: Mortality Under-5 does not cause Energy.
Table 1a – Granger causality tests from Health to Energy consumption, bivariate (Energy, Mortality Under-5) model
Estimated coefficient
Test Statistic Bootstrap critical values
1% 5% 10%
Algeria -0.0154 -6.7666** 6.9266 5.5803 4.5913
Benin 0.0020 1.5761 3.9096 3.1560 2.5219
Cameroon 0.0094 6.3312*** 5.5186 4.6401 3.9559
Democratic Republic of Congo -0.0258 -5.4216*** 4.3222 3.5030 2.7821
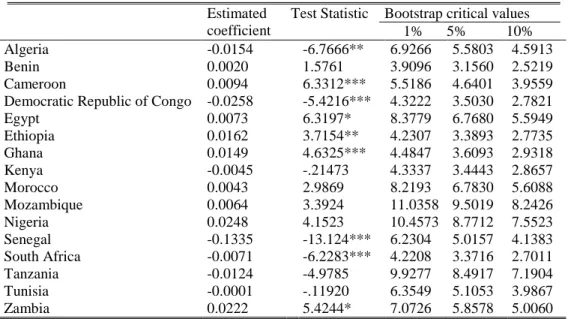
Egypt 0.0073 6.3197* 8.3779 6.7680 5.5949 Ethiopia 0.0162 3.7154** 4.2307 3.3893 2.7735 Ghana 0.0149 4.6325*** 4.4847 3.6093 2.9318 Kenya -0.0045 -.21473 4.3337 3.4443 2.8657 Morocco 0.0043 2.9869 8.2193 6.7830 5.6088 Mozambique 0.0064 3.3924 11.0358 9.5019 8.2426 Nigeria 0.0248 4.1523 10.4573 8.7712 7.5523 Senegal -0.1335 -13.124*** 6.2304 5.0157 4.1383 South Africa -0.0071 -6.2283*** 4.2208 3.3716 2.7011 Tanzania -0.0124 -4.9785 9.9277 8.4917 7.1904 Tunisia -0.0001 -.11920 6.3549 5.1053 3.9867 Zambia 0.0222 5.4244* 7.0726 5.8578 5.0060
***. **. *: significance at the 1%. 5% and 10% levels respectively.
H0: Energydoes not cause Mortality Under-5.
Table 1b – Granger causality tests from Energy consumption to Health, bivariate (Energy, Mortality Under-5) model
Tables1a and 1b contain the results of the causality tests between energy consumption and mortality rate under-5 for a sample of 16 African countries for the period 1971-2010.
Our results show a unidirectional Granger causality from energy consumption to mortality rate under-5 for Algeria, Democratic Republic of Congo, Egypt, Ethiopia, Senegal, South Africa, and Zambia. For these seven countries, we found strong links between energy consumption and one of the main health outcomes (children mortality). This result confirms our analytical discussion about the potential positive effect of energy use on Health. One plausible explanation is that in those countries there is a substitution between the sources of energy. People are using more high-quality energy and less low-quality energy like biomass. Since ten, citizens are less exposed to indoor pollution, are benefiting from more heating, warm food and better sanitation conditions. Our result shows that energy consumption is a
good leverage for better health in Africa. It can be used in order to shortcut children mortality in Africa. We can remember that 80% of world child mortality isin Africa (AfDB, 2014 - HCS).
We further find a bidirectional Granger causality for Cameroon and Ghana at the 10%. The explanation of energy consumption effect on under-5 children mortality in these two countries relies on the same arguments than those previously explained. However, the retroaction effect is a novelty. One possible explanation is the fact that children mortality decrease indicates a change in the nature of the human capital in these countries and allows better production and growth for the country. As a consequence the energy consumption grows. It can be noticed that a unidirectional Granger causality from mortality rate under-5 to energy consumption for Kenya, Mozambique, and Tanzania is also found. We can also advocate the same explanations.
The links between energy consumptionand life expectancy at birth
Estimated coefficient
Test Statistic Bootstrap critical values
1% 5% 10%
Algeria 3.2174 1.0727 8.4199 7.0258 5.9627
Benin 0.2688 .46869 2.2469 1.8562 1.4822
Cameroon -0.4608 -.63269 3.2501 2.6434 2.1042
Democratic Republic of Congo 0.1544 .10050 4.0624 3.3112 2.6999
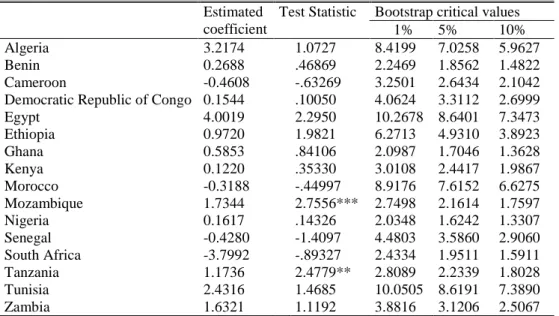
Egypt 4.0019 2.2950 10.2678 8.6401 7.3473 Ethiopia 0.9720 1.9821 6.2713 4.9310 3.8923 Ghana 0.5853 .84106 2.0987 1.7046 1.3628 Kenya 0.1220 .35330 3.0108 2.4417 1.9867 Morocco -0.3188 -.44997 8.9176 7.6152 6.6275 Mozambique 1.7344 2.7556*** 2.7498 2.1614 1.7597 Nigeria 0.1617 .14326 2.0348 1.6242 1.3307 Senegal -0.4280 -1.4097 4.4803 3.5860 2.9060 South Africa -3.7992 -.89327 2.4334 1.9511 1.5911 Tanzania 1.1736 2.4779** 2.8089 2.2339 1.8028 Tunisia 2.4316 1.4685 10.0505 8.6191 7.3890 Zambia 1.6321 1.1192 3.8816 3.1206 2.5067
***. **. *: significance at the 1%. 5% and 10% levels respectively. H0: Life Expectancy at Birthdoes not causeEnergy.
Table 2a – Granger causality tests from Life Expectancy at Birthto Energy consumption model
Estimated coefficient
Test Statistic Bootstrap critical values
1% 5% 10%
Algeria 0.0011 16.469*** 11.0248 9.7769 8.7914
Benin 0.0008 11.094*** 4.1493 3.3412 2.7477
Cameroon -0.0011 -5.2056*** 3.6968 3.0184 2.5491
Democratic Republic of Congo 0.0094 15.363*** 5.5294 4.4466 3.7054
Egypt -0.0009 -14.303*** 4.9001 4.0157 3.2943
Ethiopia -0.0011 -4.2125*** 4.0844 3.2658 2.6409
Ghana 0.0010 1.8613 5.6523 4.5122 3.7206
Morocco -0.0004 -3.5866 6.5486 5.4826 4.5393 Mozambique 0.0005 5.3356 12.2049 10.3832 8.8010 Nigeria -0.0025 -9.8306 15.8256 14.3201 13.0581 Senegal 0.0046 19.310*** 5.8636 4.8950 4.0417 South Africa -0.0001 -2.6351 5.7361 4.6255 3.7424 Tanzania 0.0046 40.180*** 16.2130 14.8707 13.5920 Tunisia -0.0011 -1.4840 3.1921 2.5665 2.1053 Zambia -0.0007 -1.3371 9.8478 8.3028 6.9503
***. **. *: significance at the 1%. 5% and 10% levels respectively.
H0:Energy does not cause Life Expectancy at Birth.
Table 2b – Granger causality tests from Energy consumption to Life Expectancy at Birthmodel
Tables2a and 2b report the results of the causality tests between energy and life expectancy for a sample of 16 African countries for the period 1971-2010.
Our results show a unidirectional Granger causality from energy consumption to life expectancy for Algeria, Benin, Cameroon, Democratic Republic of Congo, Egypt, Ethiopia, Kenya, and Senegal. Half of our sample confirms our analytical discussion about the possible impact of energy consumption on health assessed here by life expectancy. As Africa is growing, the income per capita increases allowing more per capita energy consumption. Energy consumption permits better sanitation, more heating and warm food, less indoor pollution and better medicines conservation. Our result is a strong result strengthened by the finding of a bidirectional Granger causality for Tanzania. For this country, the same arguments are valid for the link between energy consumption andlife expectancy. However, the retroaction effect is also found. It is an expected result, since as life expectancy increases, the energy use need to be increased.
Evidence of a unidirectional Granger causality from life expectancy to energy consumption is found only for Mozambique. One plausible explanation is the fact that as life expectancy increases, energy consumption increases. While this result is expected for the entire sample, it was but found only in the case of Mozambique (and Tanzania). It may be explained by the fact that Mozambique has shown the most important impact in recent years. The links between energy consumption and air pollution
Estimated coefficient
Test Statistic Bootstrap critical values
1% 5% 10%
Algeria 13.0236 .9842 4.7131 3.8147 2.9667
Benin 11.4442 .64724 2.6245 2.1064 1.7164
Cameroon 9.4935 1.6249 3.3653 2.6734 2.1527
Democratic Republic of Congo -40.1817 -1.5279 3.6725 2.9222 2.3111
Egypt 77.3073 3.1724 5.3894 4.3230 3.4960
Ghana -11.1861 -.19511 2.7219 2.1569 1.7601 Kenya -40.0997 -3.2851* 4.5976 3.7221 2.9840 Morocco 36.0428 .79953 7.6621 6.4114 5.2446 Mozambique 10.1366 .28261 5.0191 4.0666 3.2699 Nigeria -5.3890 -.65417 9.2876 7.8338 6.7430 Senegal -14.9221 -1.1181 4.5266 3.5411 2.8888 South Africa -22.4703 -.69359 3.3159 2.7129 2.2161 Tanzania -142.4678 -3.1373** 3.6380 2.9948 2.3564 Tunisia 79.9783 2.2748 7.3406 5.9603 4.9666 Zambia 84.4599 7.9478** 8.1667 7.0705 6.0961
***. **. *: significance at the 1%. 5% and 10% levels respectively.
H0: Greenhousedoes not causeEnergy.
Table 3a – Granger causality tests from Greenhouse to Energy consumption model
Estimated coefficient
Test Statistic Bootstrap critical values
1% 5% 10%
Algeria 0.00091 3.4335*** 1.9443 1.5514 1.2557
Benin -0.00029 -1.6961 3.8325 3.0870 2.4335
Cameroon 0.00040 .37132 3.8015 2.9706 2.3826
Democratic Republic of Congo 0.00017 2.1289 4.3261 3.4543 2.7978
Egypt 0.00087 2.9162 9.4349 8.1525 7.0484 Ethiopia 0.00009 1.6495 3.8558 3.1515 2.5475 Ghana 0.00100 5.4220*** 3.1129 2.5230 2.0541 Kenya 0.00080 1.7277 3.7496 3.0272 2.4121 Morocco 0.00107 1.6115 10.6206 9.2137 7.7765 Mozambique -0.00003 -.32141 5.2126 4.3583 3.6068 Nigeria -0.00085 -2.0137 5.8873 4.7023 3.8401 Senegal 0.00039 1.2716 2.0552 1.6665 1.3398 South Africa 0.00059 1.3352 3.9152 3.2859 2.6758 Tanzania 0.00042 4.7859* 5.7094 4.6977 3.8633 Tunisia 0.00146 5.2926** 6.3266 5.1848 4.1940 Zambia -0.00025 -.95378 6.8369 5.6581 4.7463
***. **. *: significance at the 1%. 5% and 10% levels respectively.
H0: Energydoes not causeGreenhouse.
Table 3b – Granger causality tests from Energy consumption to Greenhouse model
Tables 3a and 3b show the results of the causality tests between energy and greenhouse effect.
Our results show that energy consumption is causing air pollution in Algeria, Tunisia and Ghana. Per capita consumption of energy is among the highest in the Continent in Tunisia and Algeria. Those economies are transforming and the demand for energy is fast growing implying air pollution. One plausible explanation is that those countries are in the first phase of the Kuznets curve where economic growth is accompanied by pollution (Arouri et al. 2012). One can also note that these two countries are among the most urbanized in Africa and that urbanization foster air pollution [Ref]. Ghana is fast growing and its per capita energy
consumption is also fast growing implying air pollution. The same explanation than Tunisia and Algeria is valid while the per capita income is different. What is happening in Tunisia, Algeria and Ghana is expected also to happen to the other African countries.
Our results show also bidirectional Granger causality for Tanzania, at the 10% or lower level of significance. While the link between energy consumption and air pollution can be easily explained by economic growth and perhaps the use of biomass as main source of energy; the reverse link is less easily explained. Greenhouse effect may lead some counties to use more the air conditioning and by this increase their energy consumption. The evidence of a unidirectional Granger causality from greenhouse to energy consumption for Kenya,and Zambia can also be explained by the same fact.
The links between energy consumption and government health expenditure per capita Tables4a and 4b report the results of the causality tests between energy and Government health expenditure.
Estimated coefficient
Test Statistic Bootstrap critical values
1% 5% 10%
Algeria 0.2250 1.16078 31.5603 24.1557 19.0303
Benin 4.4351 6.86810 27.5836 21.4818 16.8741
Cameroon -1.4985 -2.82614 35.4122 27.0757 20.7601
Democratic Republic of Congo 0.4627 .773530 35.5358 26.4677 20.3036
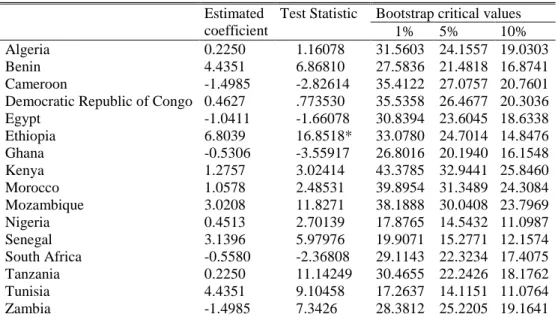
Egypt -1.0411 -1.66078 30.8394 23.6045 18.6338 Ethiopia 6.8039 16.8518* 33.0780 24.7014 14.8476 Ghana -0.5306 -3.55917 26.8016 20.1940 16.1548 Kenya 1.2757 3.02414 43.3785 32.9441 25.8460 Morocco 1.0578 2.48531 39.8954 31.3489 24.3084 Mozambique 3.0208 11.8271 38.1888 30.0408 23.7969 Nigeria 0.4513 2.70139 17.8765 14.5432 11.0987 Senegal 3.1396 5.97976 19.9071 15.2771 12.1574 South Africa -0.5580 -2.36808 29.1143 22.3234 17.4075 Tanzania 0.2250 11.14249 30.4655 22.2426 18.1762 Tunisia 4.4351 9.10458 17.2637 14.1151 11.0764 Zambia -1.4985 7.3426 28.3812 25.2205 19.1641
***. **. *: significance at the 1%. 5% and 10% levels respectively. H0: Government healthexpenditure per capita does not cause Energy.
Table 4a – Granger causality tests from Government healthexpenditure per capita to Energy consumption model
Estimated coefficient
Test Statistic Bootstrap critical values
1% 5% 10%
Algeria 0.3287 9.23906* 31.3104 24.2821 9.1911
Benin 0.0107 1.37080 27.4500 20.5580 15.6580
Cameroon -0.0156 -1.58181 23.1895 17.9419 13.6062
Democratic Republic of Congo 0.0110 2.18518 25.0483 19.4576 14.9910
Egypt 0.0236 6.16102 38.0513 27.5071 19.0758
Ghana 0.0631 1.71180 41.8271 32.9599 25.6130 Kenya 0.1132 3.90737 9.6338 7.4824 5.9461 Morocco 0.1167 6.70038* 23.3377 13.1529 6.5095 Mozambique 0.0354 1.79486 41.7964 32.4499 25.3856 Nigeria 0.0779 3.89060* 5.0191 4.0666 3.2699 Senegal -0.0044 -.201174 38.9076 22.0789 14.0938 South Africa 0.0438 3.20691 27.2186 21.8501 17.4535 Tanzania 0.3287 2.13476 23.1643 19.5056 15.8260 Tunisia 0.0107 5.86543 17.3406 15.9603 14.9666 Zambia -0.0156 3.09865 38.1667 27.0705 16.0961
***. **. *: significance at the 1%. 5% and 10% levels respectively.
H0:Energy does not cause Government healthexpenditure per capita)
Table 4b – Granger causality tests from Energy consumption Government healthexpenditure per capita model
There is no evidence of Granger causality from government health expenditure to energy consumption, of Granger causality from energy consumption to government health expenditure for Algeria, Morocco, Nigeria, and of a bidirectional Granger causality for Ethiopia, at the 1% level of significance.
As energy consumption grows, the revenue generated (directly: through production of energy or indirectly through taxation of energy consumption) allows more government expenditure on health in Algeria, Morocco, and Nigeria. Algeria and Nigeria are big oil producers. The domestic consumption of energy and the government health expenditure are strongly linked to the oil production rent and the better awareness of those countries about the health investment. Investing in health and energy consumption is expected to help the countries to invest in human capital and making the necessary economic transformation of the countries.
While for the case of Morocco, the relation seems more correlated to the increasing income per capita and better fiscal policies allowing increasing the health expenditure. For the case of Ethiopia, we found a feedback effect. In fact, as the energy consumption grows, the economic activities grows and allows more resources for the government that re-invest them in public expenditures in matter of health allowing better human capital. People are becoming more educated and in better health increasing their productivity which increase their revenues and as a consequence their energy consumption. Ethiopia is perhaps the virtue circle that may occur in different parts in Africa in the next decade.
4.2. Electricity consumption and health outcomes
The links between electricity consumption and child mortality under-5
Estimated coefficient
Test Statistic Bootstrap critical values
1% 5% 10%
Algeria 0.3138 1.2673 6.2883 5.1104 4.2314
Benin -0.0899 -2.6585 10.7969 9.4348 8.2539
Cameroon -0.1390 -1.0128 9.5972 8.3618 7.3932
Democratic Republic of Congo 0.1448 1.5035 6.4916 5.4421 4.5232
Egypt 0.0008 .73312 4.3154 3.5576 2.8902 Ethiopia 0.0017 .18262 3.0056 2.4021 1.9544 Ghana 0.1961 .75527 3.7728 2.9722 2.3359 Kenya -0.0664 -1.5163 5.4289 4.5317 3.7025 Morocco -0.0545 -.47071 7.1190 5.9510 5.0396 Mozambique -0.6531 -3.7959 10.6425 8.8989 7.6470 Nigeria -0.4823 -5.2859*** 4.7055 3.6224 2.9585 Senegal -0.0902 -1.9145 8.8678 7.6787 6.5624 South Africa -4.7735 -2.3154 7.6241 6.3484 5.2870 Tanzania -0.1064 -2.6116 5.8902 4.6894 3.7010 Tunisia -0.1089 -.61200 6.6711 5.6962 4.7469 Zambia 0.0356 .13819 3.6759 2.9481 2.3659
***. **. *: significance at the 1%. 5% and 10% levels respectively.
H0: Child Mortality under-5 does not cause Electric Consumption.
Table 5a – Granger non-causality tests from Child Mortality under-5 to Electric Consumption model
Estimated coefficient
Test Statistic Bootstrap critical values
1% 5% 10%
Algeria 0.0040 1.5855 7.5674 6.0284 4.9644
Benin 0.0030 .74265 3.6752 2.9910 2.3797
Cameroon -0.0073 -6.2015*** 1.8555 1.4809 1.1765
Democratic Republic of Congo -0.0078 -1.9993 8.9473 7.5185 6.5549
Egypt 0.0062 9.4544*** 6.4583 5.1216 4.1407 Ethiopia 0.2118 5.9007** 6.1666 5.1067 4.1770 Ghana 0.0033 3.1369* 4.4879 3.5102 2.8194 Kenya 0.0360 1.7378 7.1101 5.8552 4.7369 Morocco 0.0067 6.2858** 6.7409 5.4880 4.5323 Mozambique 0.0032 2.2127 4.9570 4.1199 3.3122 Nigeria 0.0709 7.1768** 8.1650 6.7646 5.6090 Senegal -0.0789 -5.6725** 5.8768 4.8717 4.0309 South Africa 0.0003 .51312 5.5049 4.4679 3.6767 Tanzania -0.0490 -2.7879 6.0762 4.8094 3.9432 Tunisia 0.0002 .69591 5.9257 4.7682 3.8647 Zambia 0.0083 6.6783*** 4.3276 3.5546 2.8859
***. **. *: significance at the 1%. 5% and 10% levels respectively.
H0: Electric Consumptiondoes not cause Mortality under-5.
Tables5a and 5b show the results of the non-causality tests between electric consumption and under-5child mortality for a sample of 16 African countries for the period 1971-2010.
As expected, there is no evidence of a unidirectional Granger causality from health to electric consumption. There are no or few arguments explaining this link.
In contrast, there is as expected evidence of a unidirectional Granger causality from electric consumption to under-5 child mortality for Cameroon, Egypt, Ethiopia, Ghana, Morocco, Senegal, and Zambia. As we have largely argued in our theoretical framework, increasing the electricity access has strong effect on child mortality. Access to electricity allows better conditions for cooking and heating and avoiding by this indoor-pollution and associated diseases.
There is evidence of a bidirectional Granger causality for Nigeria, at the 10% or lower level of significance. While the same arguments occur for the link between electricity consumption and under-5 child mortality.Electricity consumption has differentiated effects on Life expectancy at birth in Africa.
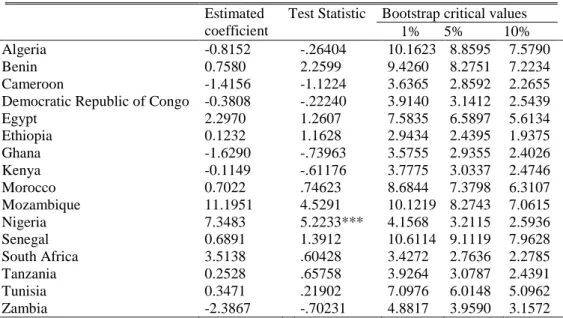
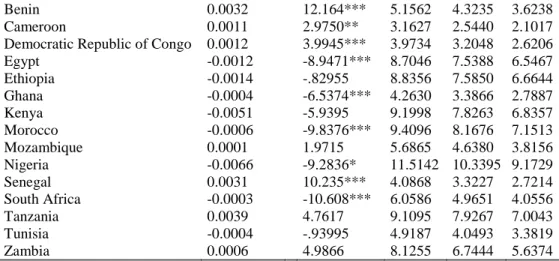
The links between electricity consumption and Life expectancy at birth in Africa
Estimated coefficient
Test Statistic Bootstrap critical values
1% 5% 10%
Algeria -0.8152 -.26404 10.1623 8.8595 7.5790
Benin 0.7580 2.2599 9.4260 8.2751 7.2234
Cameroon -1.4156 -1.1224 3.6365 2.8592 2.2655
Democratic Republic of Congo -0.3808 -.22240 3.9140 3.1412 2.5439
Egypt 2.2970 1.2607 7.5835 6.5897 5.6134 Ethiopia 0.1232 1.1628 2.9434 2.4395 1.9375 Ghana -1.6290 -.73963 3.5755 2.9355 2.4026 Kenya -0.1149 -.61176 3.7775 3.0337 2.4746 Morocco 0.7022 .74623 8.6844 7.3798 6.3107 Mozambique 11.1951 4.5291 10.1219 8.2743 7.0615 Nigeria 7.3483 5.2233*** 4.1568 3.2115 2.5936 Senegal 0.6891 1.3912 10.6114 9.1119 7.9628 South Africa 3.5138 .60428 3.4272 2.7636 2.2785 Tanzania 0.2528 .65758 3.9264 3.0787 2.4391 Tunisia 0.3471 .21902 7.0976 6.0148 5.0962 Zambia -2.3867 -.70231 4.8817 3.9590 3.1572
***. **. *: Significance at the 1%. 5% and 10% levels respectively. H0: Life Expectancy at birth does not cause Electric Consumption.
Table 6a – Granger non-causality tests from Life Expectancy at birthto Electric Consumption model
Estimated coefficient
Test Statistic Bootstrap critical values
1% 5% 10%
Benin 0.0032 12.164*** 5.1562 4.3235 3.6238
Cameroon 0.0011 2.9750** 3.1627 2.5440 2.1017
Democratic Republic of Congo 0.0012 3.9945*** 3.9734 3.2048 2.6206
Egypt -0.0012 -8.9471*** 8.7046 7.5388 6.5467 Ethiopia -0.0014 -.82955 8.8356 7.5850 6.6644 Ghana -0.0004 -6.5374*** 4.2630 3.3866 2.7887 Kenya -0.0051 -5.9395 9.1998 7.8263 6.8357 Morocco -0.0006 -9.8376*** 9.4096 8.1676 7.1513 Mozambique 0.0001 1.9715 5.6865 4.6380 3.8156 Nigeria -0.0066 -9.2836* 11.5142 10.3395 9.1729 Senegal 0.0031 10.235*** 4.0868 3.3227 2.7214 South Africa -0.0003 -10.608*** 6.0586 4.9651 4.0556 Tanzania 0.0039 4.7617 9.1095 7.9267 7.0043 Tunisia -0.0004 -.93995 4.9187 4.0493 3.3819 Zambia 0.0006 4.9866 8.1255 6.7444 5.6374
***. **. *: significance at the 1%. 5% and 10% levels respectively.
H0: Electric Consumptiondoes not cause Life Expectancy at birth.
Table 6b Granger non-causality tests from Electric Consumption to Life Expectancy at birth model
Tables6a and 6b contain the results of the non-causality tests between electricity consumption and health (Life expectancy at birth).
Our results show contrasted results in matter of electricity consumption and health. Two sub-groups of countries have significant links between electricity consumption and life expectancy at birth. In fact, It can be noticed no unidirectional Granger causality from health to electricity consumption, a unidirectional Granger causality from electricity consumption to health for Benin, Cameroon, Democratic Republic of Congo, Egypt, Ghana, Morocco, Senegal, and South Africa, and a bidirectional Granger causality for Nigeria,at the 10% or lower level of significance.
We found negative unidirectional causality from electricity consumption to life expectancy for South Africa, Nigeria, Ghana, Morocco, and Egypt. This finding is surprising! As electricity consumption increases the life expectancy at birth decreases?
However, we found positive unidirectional causality from electricity consumption to life expectancy for Benin, Cameroon, DRC and Senegal (West and Central Africa). As electricity consumption increases the life expectancy increases. Most of these countries have very low per capita consumption of electricity and poor coverage of the grid. Most rural areas are lacking access to electricity.
Two plausible explanations may be presented. Firstly, the consumption of electricity has raised the budget allocated to energy and lower the budget for health. If we consider that electricity is subsidized like in some countries (Tunisia, Egypt…). As consequence, the
energy poverty acted in a way that lowered life expectancy at birth. Secondly, as the consumption of electricity increased, the production has followed the same trends. The problem comes from the technologies used for the production of electricity. Electricity provision can be based on several types of technologies with differentiated effects ion health. While green technologies like wind power and hydropower have (no) or small health impacts, other technologies based on Coal, Gasoil, etc....have deep impacts on health. Several reports show local air pollution due to SO2 emissions, NOx emissions and others GHG. The combined effect may be negative in the short run. Other explanations rely on the fact that electricity consumption may led to harmful behaviors: watching TV for hours, less sport activity and more time spent on screens, etc…
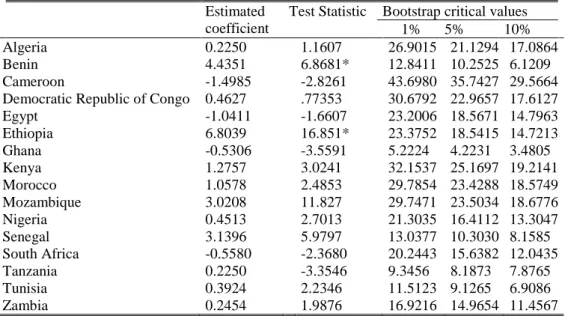
The links between electricity consumption and Government health expenditure per capita
Estimated coefficient
Test Statistic Bootstrap critical values
1% 5% 10%
Algeria 0.2250 1.1607 26.9015 21.1294 17.0864
Benin 4.4351 6.8681* 12.8411 10.2525 6.1209
Cameroon -1.4985 -2.8261 43.6980 35.7427 29.5664
Democratic Republic of Congo 0.4627 .77353 30.6792 22.9657 17.6127
Egypt -1.0411 -1.6607 23.2006 18.5671 14.7963 Ethiopia 6.8039 16.851* 23.3752 18.5415 14.7213 Ghana -0.5306 -3.5591 5.2224 4.2231 3.4805 Kenya 1.2757 3.0241 32.1537 25.1697 19.2141 Morocco 1.0578 2.4853 29.7854 23.4288 18.5749 Mozambique 3.0208 11.827 29.7471 23.5034 18.6776 Nigeria 0.4513 2.7013 21.3035 16.4112 13.3047 Senegal 3.1396 5.9797 13.0377 10.3030 8.1585 South Africa -0.5580 -2.3680 20.2443 15.6382 12.0435 Tanzania 0.2250 -3.3546 9.3456 8.1873 7.8765 Tunisia 0.3924 2.2346 11.5123 9.1265 6.9086 Zambia 0.2454 1.9876 16.9216 14.9654 11.4567
***. **. *: significance at the 1%. 5% and 10% levels respectively.
H0: Health expenditure per capitadoes not causeElectric Consumption.
Table 7a – Granger non-causality tests from expenditure per capitato Electric Consumption model
Estimated coefficient
Test Statistic Bootstrap critical values
1% 5% 10%
Algeria 0.3287 9.2390* 17.7488 9.6706 7.0807
Benin 0.0107 1.3708 26.4519 20.0469 16.1444
Cameroon -0.0156 -1.5818 24.1989 19.0736 15.1717
Democratic Republic of Congo 0.0110 2.1851 24.6775 19.3065 15.2766
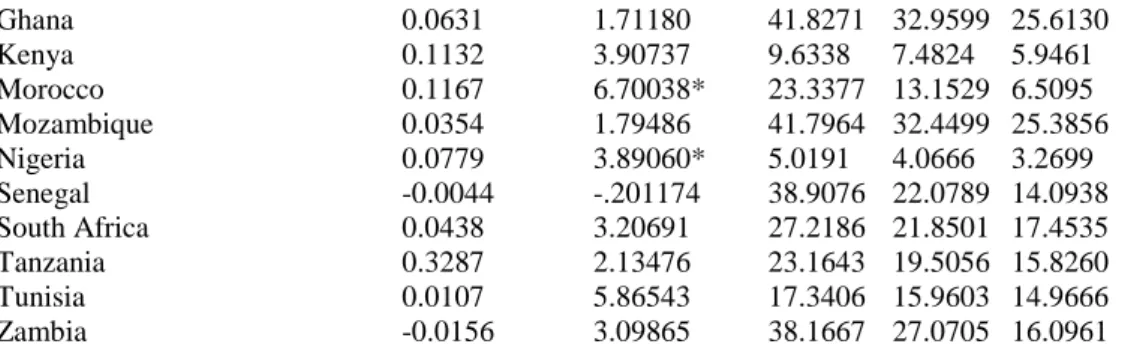
Egypt 0.0236 6.1610 41.4677 29.4222 16.0679 Ethiopia -0.0310 -16.019* 37.1127 28.5266 12.5332 Ghana 0.0631 1.7118 43.0568 34.3979 27.2814 Kenya 0.1132 3.9073 9.3856 7.3393 5.8544 Morocco 0.1167 6.7003 49.7991 32.2589 20.4923 Mozambique 0.0354 1.7948 41.3394 32.1611 25.2466
Nigeria 0.0779 3.8906 51.7398 41.4223 32.9166 Senegal -0.0044 -.20117 28.4903 22.2955 17.2014 South Africa 0.0438 3.2069 53.1188 42.7987 35.0586 Tanzania 0.0456 4.4567 38.1786 34.6578 29.6543 Tunisia -0.0324 3.6543 45.6754 38.1765 31.4567 Zambia 0.0235 1.5487 23.8796 19.8976 16.0098
***. **. *: significance at the 1%. 5% and 10% levels respectively.
H0: Electric Consumptiondoes not cause Health expenditure per capita.
Table 7b Granger non-causality tests from Electric Consumption to Health expenditure per capitamodel
Tables7a and 7b report the results of the non-causality tests between electricity consumption and Government health expenditure per capita for a sample of 16 African countries for the period 1971-2010. Evidence of a unidirectional Granger causality from health to electricity consumption is found for Benin.Evidence of a unidirectional Granger causality from electric consumption to health for Algeria, and a bidirectional Granger causality for Ethiopia, at the 10% or lower level of significance.
4.3. Discussion
Our results show that there is strong impact of energy use in Africa on under-5 children mortality and life expectancy. The evidence is found for at least eight countrieshaving different levels of income per capita. The results are robust in fragile states like DRC and Côte d‟Ivoire and Middle Income Countries like Tunisia and Morocco. One can expect that the effect of increasing energy consumption will be strengthened in the near future given the currentlow level of energy consumption. As per capita electricity consumption represents in SSA 1% of the European consumption level, there is an expected “health effect” in the near future of energy consumption. Moreover, we found an evidence of the link between energy consumption and Government health expenses. The revenues generated by the domestic consumption of energy are partially recycled in health care and medicines. Our results did not show significant trends between energy use and electricity consumption.
5. Policy implications
Increasing access to modern sources of energy and electricity implies an improvement in cooking conditions and heating (lowering the risk associated with indoor air pollution), in health centers‟ infrastructure (improving child and maternal health), in medicinesconservation,
and provides more incentives for health workers. The overall effect of such improvement is a healthier workforce, and an increase in life expectancy.
Recent economic growth in Africa allows more investment in health, education, infrastructure, and electrification. With increasing per capita income Africanscan invest more in energy use and electricity and substitute their energy sources from pollutant ones (biomass) to less pollutant ones (Electricity, GPL). At the same time, Africa is benefitting from the technological latter comer effect. Africa is benefitting from latest technologies for provision of electricity (more efficient and cheaper technologies), especially in matter of renewable energies. While this “market dynamic” seems important, it will not be sufficient to help Africa bridge its divide in energy use and electrification. There is a strong need that must be fulfilled with Global initiatives, local and regional policies especially to improve the health impacts of energy access.
The most prominent global initiative for the provision of energy for African is the newly launched initiative of the Secretary General of the United Nations toward „„Sustainable Energy for All‟‟ (http://www.sustainableenergyforall.org/).The UN and most of development agencies have putt African households high in their agenda. Energy poverty seems one of the majorcomponents of poverty nowadays and even in developed countries, millions of people are facing this kind of poverty, which impacts their health, education and labor performances. This initiative targets universal access to electricity in Africa by 2025. The seventh goal of the Sustainable Development Goals (SDG) also aim to ensure universal access to affordable, reliable and modern energy services by 20306.
Initiatives in matter of improving the cooking stoves like the Global Alliance for Clean Cookstoves (http://www.cleancookstoves.org/) are innovative solutions in order to decrease health risks due to indoor pollution. Switching the cooking stoveshas agreat potential toreduce the risk of death and chronic diseases associated to indoor air pollution.Improved
6
7.1: By 2030, ensure universal access to affordable, reliable and modern energy services
7.2: By 2030, increase substantially the share of renewable energy in the global energy mix
7.3: By 2030, double the global rate of improvement in energy efficiency
7.4: By 2030, enhance international cooperation to facilitate access to clean energy research and technology, including renewable energy, energy efficiency and advanced and cleaner fossil-fuel technology, and promote investment in energy infrastructure and clean energy technology
7.5: By 2030, expand infrastructure and upgrade technology for supplying modern and sustainable energy services for all in developing countries, in particular least developed countries, small island developing States, and land-locked developing countries, in accordance with their respective programmes of support
access to modern energy services including cleaner-combusting and more efficient cooking fuels like LPG, biogas, natural gas and an advanced biomass stove reduce the health risks.It also has an impact on reducing carbon emissions in developing countries (Bond et al., 2013; Shindell et al., 2012). Several measurement campaigns have evaluated the performance of improved stoves and fuels, including the evaluation of climate relevant species (Maccarty et al., 2007, 2010), and the potential health benefits of their introduction (Anenberg et al., 2012). In addition to resulting in significant health benefits, recent assessments suggest that such residential cooking fuel and stove switching, may also have a greater potential to curb global warming by reducing black carbon emissions. The major challenge in Africa is the access to these technologies at an affordablecost.
Last mile policies need also to be strengthened. Most of African infrastructure projects especially in of the area of transport, energy and water need to consider the last mile to health care, schools and public facilities as part of the projects. In fact, several schools, health care and public facilities (especially in rural Africa) lack electricity despite the proximity of an electricity grid. Insufficient resources and non-consideration of health and education aspects in infrastructure projects lead to a situation where people have no access to basic health services because of lack of electricity. For instance, maternal health services need to be close to the population but are often not available due to absence of electricity and energy sources.
6. Concluding remarks
The objective of this articlewas to discuss the causality links between energy consumption and health outcomes in Africa. We proposed an analytical framework to identify the expected causality links and an econometric analysis of this causality for 16 countries during the period 1971-2010.
Our analysis suggests a strong link between energy consumption and decreasing under-5 child mortality on the one hand and increased life expectancy on the other hand. The causality is well-established for more than half of the countries under study in several regions of Africa and at different levels of development.
The examination of the same causality for electricity consumption and health outcomes confirms the previous results, while showing surprising links for life expectancy. There is a negative effect in the case of five large African countries: South Africa, Nigeria, Ghana, Morocco, and Egypt. We found also the evidence of a causality link between energy
use, electricity consumption and government spending in health.
Our results advocate for improving electricity provision for Africans. Health externalities (considered as positive externalities) can balance the potential environmental negative externalities. Africa contribution to Greenhouse effect is very limited (less than 5%) and is marginal compared to countries such China and United States. While it is important that Africa grows using cleaner technologies and fosters the use of renewable energies (following a sustainable pathway), there is also urgency for Africans to use more energy (especially electricity) to reverse the dramatic health and sanitation situation leading tomaternal and child morbidity and mortality. It is also urgent to implement new technologies based on electricity out of the grid in rural Africa, wheremost important problems are reported.