HAL Id: hal-01341103
https://hal.archives-ouvertes.fr/hal-01341103
Submitted on 4 Jul 2016
HAL is a multi-disciplinary open access
archive for the deposit and dissemination of
sci-entific research documents, whether they are
pub-lished or not. The documents may come from
teaching and research institutions in France or
abroad, or from public or private research centers.
L’archive ouverte pluridisciplinaire HAL, est
destinée au dépôt et à la diffusion de documents
scientifiques de niveau recherche, publiés ou non,
émanant des établissements d’enseignement et de
recherche français ou étrangers, des laboratoires
publics ou privés.
An Architecture to Support the Collection of Big Data
in the Internet of Things
Cyril Cecchinel, Matthieu Jimenez, Sébastien Mosser, Michel Riveill
To cite this version:
Cyril Cecchinel, Matthieu Jimenez, Sébastien Mosser, Michel Riveill. An Architecture to Support the
Collection of Big Data in the Internet of Things. International Workshop on Ubiquitous Mobile cloud
(co-located with SERVICES), Jun 2014, Anchorage, United States. �10.1109/SERVICES.2014.83�.
�hal-01341103�
An Architecture to Support the Collection of Big Data in the Internet of Things
Cyril Cecchinel, Matthieu Jimenez, S´ebastien Mosser, Michel Riveill Univ. Nice Sophia Antipolis, I3S, UMR 7271, 06900 Sophia Antipolis, France
CNRS, I3S, UMR 7271, 06900 Sophia Antipolis, France {cecchinel,jimenez,mosser,riveill}@i3s.unice.fr
Abstract—The Internet of Things (IoT) relies on physical objects interconnected between each others, creating a mesh of devices producing information. In this context, sensors are sur-rounding our environment (e.g., cars, buildings, smartphones) and continuously collect data about our living environment. Thus, the IoT is a prototypical example of Big Data. The contribution of this paper is to define a software architecture supporting the collection of sensor-based data in the context of the IoT. The architecture goes from the physical dimension of sensors to the storage of data in a cloud-based system. It supports Big Data research effort as its instantiation supports a user while collecting data from the IoT for experimental or production purposes. The results are instantiated and
validated on a project named SMARTCAMPUS, which aims to
equip the SophiaTech campus with sensors to build innovative applications that supports end-users.
Keywords-Data collection; Software Engineering; Architec-ture; Distributed Computing; Sensors;
I. INTRODUCTION
Big Datais one of the most important research challenges
for the 2020 horizon. This paradigm relies on the collection of tremendous amount of data to support innovation in the upcoming decades [1]. A dataset is considered as big when it meet the “four Vs” requirements: Volume, Variety, Velocity and Value. The keystone of Big Data exploitation is to leverage the existing datasets to create new information, enriching the business value chain. According to the IDC group, the amount of world data will be 44 times greater in this decade, from 0.8 zettabyte to 35 zettabytes. In this context, the Internet of Things (IoT) paradigm relies on a world of interconnected objects [2], able to communicate between each others and collect data about their context. Day after days cars, smartphones and buildings collect various information about our living environment, generating zettabytes of sensed data. The Gartner group predicts up to 26 billions of things connected to the Internet by 2020. Intechno Consulting estimates that this market will generate up to 180 billions of Euros worldwide. This is a typical example of Big Data collection and analysis as it addresses the four Vs: large Volume of Various data, collected with an high Velocity to define application with added-Value.
The coupling between the IoT and the Big Data munities is strong [3]–[5]. Unfortunately, there is no com-prehensive approach to support the collection of data from sensors and their exploitation: research efforts are focused
on the collection of data from the data producer tiers [6], the reception tiers [7] or the exploitation one [8]. The objective of this paper is to complement state of the art approaches by describing a comprehensive software archi-tecture supporting the collection of sensor data produced by the IoT. In such a situation, architects must handle sensors as hardware devices, and route the produced data to data warehouses able to store the large amount of data produced by these devices. This class of architecture must tackle several challenges, e.g., data storage, avoiding processing bottlenecks, sensors heterogeneity, high throughput. We use
as a running example the SMARTCAMPUS project, which
aims to equip the SophiaTech campus (Sophia Antipolis, France) with sensors collecting data about campus’ usage.
The remainder of this paper is organized as follow: first,
SEC. II identifies the requirements of the architecture based
on the SMARTCAMPUSexample. Then, SEC. III depicts an
overview of the architecture, and SEC. IV focuses on the
sensor viewpoint of the contribution. Thus, SEC. V addresses
data processing concerns, and SEC. VI the data exploitation
ones. Finally, SEC. VII describes research efforts relevant
with this contribution, and SEC. VIII concludes this paper,
sketching upcoming perspectives based on these results.
II. MOTIVATINGSCENARIOS
The McKinsey Global Institute has identified up to seven
Big Data levers in the manufacturing value chain [1]
(FIG. 1). With respect to the IoT paradigm, these levers
are related to (i) collection of very-large datasets to support experiments, (ii) the publication of marketplaces to exploit the collected data and (iii) the exploitation of such datasets with relevant application, e.g., monitoring dashboards.
In this paper, we use as a running example the SMART
-CAMPUSproject, a prototypical example of Big Data
appli-cation. The University of Nice-Sophia Antipolis is exploiting
a new campus named SophiaTech1, located in the Sophia
Antipolis technology park. The ultimate goal of this project is to consider sensors deployed in buildings as an open platform to let final users (i.e., students, professors, adminis-trative staff) build their own innovative services on top of the collected (open) data. The campus occupies 58, 000 squared meters (∼ 14.5 acres), including 8 buildings representing
78
Exhibit 25
We have identified the following big data levers across the manufacturing value chain
Build consistent interoperable, cross-functional R&D
and product design databases along supply chain to
enable concurrent engineering, rapid experimentation and simulation, and co-creation
1
Implement sensor data-driven operations analytics to improve throughput and enable mass customization
6
Implement lean manufacturing and model production
virtually (digital factory) to create process transparency,
develop dashboards, and visualize bottlenecks
5
Aggregate customer data and make them widely available to improve service level, capture cross- and
up-selling opportunities, and enable design-to-value
2
Source and share data through virtual collaboration sites (idea marketplaces to enable crowd sourcing)
3
Collect after-sales data from sensors and feed back in real time to trigger after-sales services and detect manufacturing or design flaws
7
Implement advanced demand forecasting and supply
planning across suppliers and using external variables
4
SOURCE: McKinsey Global Institute analysis
R&D and design Supply-chain mgmt Produc-tion Market-ing and sales After-sales service
1. Product lifecycle management. Over decades, manufacturing companies have implemented IT systems to manage the product lifecycle including computer aided-design, engineering, manufacturing, and product development management tools, and digital manufacturing. However, the large datasets generated by these systems have tended to remain trapped within their respective systems. Manufacturers could capture a significant big data opportunity to create more value by instituting product lifecycle management (PLM) platforms that can integrate datasets from multiple systems to enable effective and consistent collaboration. For example, PLM could provide a platform for “co-creation,” e.g., bringing together internal and external inputs to create new products. This is particularly useful in fields such as aerospace where a new product might be assembled with hundreds of thousands of components supplied by hundreds of suppliers from around the world. In this context, having the OEM co-create designs with suppliers can be extraordinarily valuable. PLM platforms can also significantly enable experimentation at the design stage. Designers and manufacturing engineers can share data and quickly and cheaply create simulations to test different designs, the choice of parts and suppliers, and the associated manufacturing costs. This is especially useful because decisions made in the design stage typically drive 80 percent of manufacturing costs. Leading players in advanced industries are already embracing the collaborative use of data and controlled experimentation. Toyota, Fiat, and Nissan have all cut new-model development time by 30 to 50 percent; Toyota claims to have eliminated 80 percent of defects prior to building the first physical prototype.68
However, while the payoff for this opportunity is large, manufacturers will likely need to invest significantly upgrade their systems, which in many cases are decades old. In addition to the technical work of integrating datasets from
68 Note that in addition to reducing development time, manufacturers, as a result of using integrated PLM, are able to improve quality and reduce resources in order to develop more derivatives or product extensions.
Figure 1. Big Datalevers in the manufacturing value chain [1].
23, 000 squared meters (∼ 5.75 acres) of workspaces, labs
and amphitheatres. The SMARTCAMPUSproject preliminary
study was started in September 2013 and involves a team of 18 persons. Its objective is to develop a technological stack acting as a mediation layer between sensors deployed in buildings and developers who wants to develop innova-tive services based on these data. The development effort is focused on data collection, scalability issues and data visualization. The functional analysis phase (ended in 2013) relied on a questionnaire and several user’s interviews to identify prototypical scenarios for living labs experiments and smart building use cases to be used as relevant validation test cases. In this paper, we focus on the following two scenarios:
• Parking lot occupation. The campus contains five
dif-ferent parking lots (∼ 500 spaces). The occupation rate of each lot can be aggregated based on sensors (e.g., sonar sensors located on arbour overhanging the cars). Collected measurements must be exploited in real-time to guide user looking for an available space, and the global occupation log is exploited to compute average usage of parking and classify car movements.
• Heating regulation. The campus is located in a warm
area. To save energy and avoid the intensive use of A/C, the external doors include a mechanism to stay open, helping to regulate the temperature during summer. Unfortunately, during winters, doors kept opened lead to loss of heat. To diagnose these losses and support the logistic team, temperature sensors located in corridors and rooms continuously collect data. These data are correlated to presence detectors through monitoring
dashboards (FIG. 2), identifying empty spaces with heat
losses. These data can also be exploited to assess the “green” dimension of the building.
Simplifying the reality, let a measurement be a triplet
Figure 2. Heating monitoring with temperature and presence correlation.
binding a sensor identifier to a given timestamp and the associated value, without any additional meta-data. Con-sidering each element of the triplet encoded as a 32 bits value, an update rate of one measurement per minute in this context generates up to 2Gb of data per year for the first scenario, only considering a single sensor. This is related to the classical 4Vs of Big Data: large Volume of data (i.e., 2Gb per year for one sensor), high-Velocity of data production (i.e., 1 measurement per second for each sensor), Various sources of data (e.g., sonar, temperature sensors), and
added-Value applications built on top of the collected datasets.
III. ARCHITECTUREREQUIREMENTS& OVERVIEW
To support the scenarios described in the previous section, we identified the following requirements to be supported by the designed software architecture. These four requirements
are not specific to the SMARTCAMPUSproject, and do apply
to any IoT-based platform.
R1 Sensor heterogeneity. The system must handle various
sensors platforms, data formats and protocols.
R2 Reconfiguration capabilities. The system will be
de-ployed in wide environments, thus one must be able to reconfigure it remotely.
R3 Scalability. The system must scale according to two
di-mensions: vertical scalability for storage purpose (e.g., enlarging the databases size), and horizontal scalability for processing purpose (e.g., load-balancing requests).
R4 Data As A Service. The system must provide a
mecha-nism to support users who want to retrieve the collected data, at the right level of abstraction (i.e., hiding the underlying database).
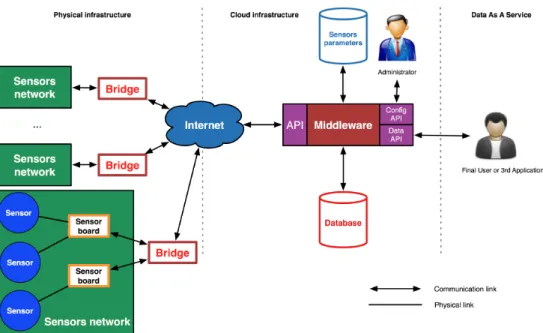
FIG. 3 depicts an overview of the contribution of this
paper, i.e., a comprehensive software architecture supporting the collection of Big Data in the IoT, with respect to the previsouly described requirements. The architecture is
Figure 3. High-level description of the software architecture.
comprehensive as it addresses the complete spectrum of elements involved in such a context.
• Sensors: in this study, we consider sensors as black
boxes, transforming a physical quantity into a mea-surement. Classically, an electronic device is used to transform such a quantity (e.g., temperature) into an electrical resistance value (e.g., with a thermistor).
• Sensor Board: a board aggregates several sensors
physi-cally connected to it. The board is usually implemented
by a micro-controller (e.g., Arduino2). The
responsibil-ity of a board is to collect the data and send it to its associated bridge.
• Bridge: the bridge responsibility is to aggregate data
streams from several boards. The different boards can be connected to the bridge using physical links (e.g.,
USB), or wireless protocols (e.g., Zigbee3). The bridge
is connected to the Internet and broadcast the received streams to a reception Application Programming
Inter-face(API). Bridges can be controlled by the system to
configure the way measurements are sent.
• Middleware: the reception middleware defines three
distinct APIs: (i) a reception API used by the bridge to send data, (ii) a configuration API to support the set up of measurements retrieval and (iii) a data API used to interact with the collected datasets. The responsibility of the middleware is to support the data reception as well as broadcasting the configuration made on the sensors to the relevant bridges. The middleware
con-2http://arduino.cc/
3http://www.digi.com/xbee/
tains the global sensor configuration, and the measured datasets.
This architecture fulfills the previously identified require-ments. First of all, sensors are considered as black boxes and decoupled from the collection middleware. Thus, it is the responsibility of the bridge to handle sensor
hetero-geneity (R1). The reconfiguration part (R2) is supported by
the middleware that stores the expected configuration and broadcast it to the different bridges. Using a cloud-based platform to host the middleware, the scalability of the data
collection (R3) is intrinsically handled by the underlying
cloud. Finally, providing a measurement-driven API as a support for users’ interactions addresses the Data as a
Servicerequirement (R4).
The presented architecture can be prototyped with rela-tively cheap hardware and software. The initial prototype of
the SMARTCAMPUS project, involving 32 boards and 130
sensors costed less than $1, 200.
• Sensors: specialized hardware, pre-configured shields;
• Sensor Boards: Arduino Uno micro-controller;
• Bridge: Raspberry Pi nano-computer;
• Middleware: Amazon EC2 cloud service;
IV. INTERACTING WITHVARIOUSSENSORS
In this section, we particularly describe the mechanisms provided in the architecture to support sensor heterogeneity
(R1) and measurement reconfiguration (R2).
A. Challenges
There is no standard among manufacturers for sensor interaction, each of them uses its own choices either for
the format of data or for the configuration of a sensor board. Thus, implementing a sensor network is error-prone and time consuming when the ultimate objective is to collect datasets for further exploitation. Moreover, boards can become ob-solete and no more available to customers. That’s why, as time goes by, a network might have different boards, bought from several manufacturers. The heterogeneity of the sensor boards combined with the lack of standard among triggers three challenges that need to be tackled:
• Consistency. To support system consistency and data
exploitation, the different data formats must be unified into something usable technologically-independent.
• Transparency. The underlying protocol used to
config-ure the measconfig-urement process must be transparent for the final user, independently of manufacturers’ choices.
• Configuration. As the sensor network is aimed to be
deployed on a large scale, the architecture must allow one to reconfigure it at runtime, e.g., plugging in new sensors or boards, as well as changing the frequency of data measurements.
B. Application to the SMARTCAMPUSuse case
At the prototype level, the SMARTCAMPUS use case
needs to deal with three different kinds of sensor boards:
(i) Electronic Bricks4 (temperature and light sensors, now
discontinued), (ii) Grove Shields5 (parking spaces sonar,
temperature and light sensors) and finally (iii) Phidgets6
(presence detector). Obviously these platforms rely on differ-ent tools to collect data. More critically, even if the two first ones use an Arduino micro-controller as sensor board, the needed software libraries used to decode the measure differ. As the sensor can be deployed anywhere on the campus even in the rooftop, it is mandatory to remotely configure the sensors from a centralized interface, without knowing which technology is used.
C. Tackling the Challenges
1) Unifying Data format: To tackle the Consistency
chal-lenge, a mechanism must be provided to unify the different data formats used in the architecture. In the described architecture, the bridge is dedicated to this role. It defines and implements an intra-network protocol that standardize messages between the boards and the bridge, sending to the middleware the measurements in a standardized format.
Intra-network protocol. The bridge receives data on
its sensor network communication interface from the sensor board. The specificities of each manufacturer are implemented, as an off-the-shelf class inheriting a
SensorProvider interface. Thus, the bridge
transpar-ently translate the proprietary format into a common
rep-resentation encoded in JSON [9] (FIG. 4). It contains the
4http://www.seeedstudio.com/wiki/Electronic Brick Starter Kit
5http://www.seeedstudio.com/wiki/GROVE System
6http://www.phidgets.com/
{"n": "TEMP_SENSOR", "v":24, "t":4520}
Figure 4. Example of message forged by the sensor board.
following pieces of information: (i) identifier of the sensor,
(ii)measurement value and (iii) associated timestamp.
Bridge routing.Messages coming from the different
sen-sor boards are collected by the bridge in order to be sent over the Internet. The application on the bridge maps each sensor with an endpoint and sends the data collected to this endpoint. When a message is received by the bridge, the identifier field is read to determine the corresponding endpoint. The message is then queued and will be sent in an array along with others messages assigned to this endpoint.
2) Tranparency of configuration: To be able to work with
various platform without having to deal with specificity of each platform, transparency is mandatory. The architecture relies on a minimal configuration protocol defined as the intersection of operations classically supported by sensor providers. This protocol works on the following data for each sensor:
• id: unique identifier for each sensor;
• type: type of sensor (e.g., temperature, sonar);
• period: time interval between two measurements;
• interface: communication interface used to send
mea-surements to the bridge;
• end point: where do measurements must be sent?
To handle manufacturers’ heterogeneity with respect to sensor configuration, we used the same mechanism than the one used to unify the data formats: a generic interface (SensorConfiguration) implemented differently for each sensor configuration protocol. This interface contains the following operations:
• add. It adds a sensor on the platform, allowing the
sensor network to send measurements for this sensor;
• del. It deletes a previously added sensor;
• freq. It modifies the measurement frequency;
• route. It declares the endpoint associated to this
sensor.
For example, one can physically plug a temperature sensor on a given board, and then send an add command to declare it and start to collect data from it. One can change its destination (endpoint) by using the route operation (e.g., for privacy reasons), as well as its frequency using the freq one (e.g., suspending measurement at night).
3) Remote and dynamic configuration: To achieve the
Configuration challenge, specific functional elements are
defined in the middleware to support configuration
manage-ment (FIG. 5).
• Sensors parameters Database: A database that contains
configuration of every sensors in the sensor network, lists all sensor boards and all bridges.
Collector Authentication Split message packets into single messages Fast ! Collector Authentication Split message packets into single messages Fast ! Messages Queue Message processing Message processing Database Checker Sensors emission checking Sensors parameters Sensors API Config Configuration broadcasting Accessor Virtual sensors or Raw data Internet Data API
Figure 5. Architecture description of the middleware.
• Configuration: A routine called periodically to
propa-gates the configuration of sensors to their related bridge. Therefore, to add or update a sensor in the architecture, the user connects to an application and enters the configu-ration of this sensor. This configuconfigu-ration is stored in Sensors parameters Database. This configuration is then periodically broadcasted by the configuration block to the related bridge, the bridge will then translate the configuration in a way that the related sensor board understand.
It is important to notice that a user does not have to know on which bridge the sensor board is connected. The configuration block first asks each bridge for the list of all the sensor board connected to it. Then it sends to each bridge the configuration of every sensors on those board. As boards are often connected to the bridge using a wireless protocol, the user can move a given board from one place to another as long as it stays in the reception range of an existing bridge.
V. DATASETSVELOCITY ANDVOLUME
Considering the data collection as realized thanks to the previous section, the data reception must be handled, as well as the storage of the received measurements. This part addresses requirements related to horizontal and vertical
scalability (R3), implemented in the middleware (FIG. 5).
A. Challenges
The middleware should not be a bottleneck for the data collection. It has to handle the reception of large amount of data and be able to store it. Moreover, this middleware should maintain quality of data by identifying if a data is relevant or corresponds to a dysfunctional sensor.
• Horizontal scalability. The system must support
high-throughput data reception. It must not reject a
mea-Table I
COLLECTOR’SREST INTERFACE
Method Resource Parameter
POST /value Message array
surement because of an overload. While processing the incoming measurements, the system must identifies abnormal data.
• Vertical scalability. The system must store the received
data, and as new sensors can be added at runtime, the database storage size must scale.
B. Application to the SMARTCAMPUS use case
Since many sensors are deployed in the SMARTCAMPUS
use case, data will be sent in parallel to the middleware. In the worst case, all the sensors of the whole campus will send a measurement at the very same time. As the initial prototype was built using cheap sensors for experimental purpose only, sensor stability was not the priority. As a consequence, the temperature sensors used on the prototype often send deviant data (e.g., a temperature suddenly greater than the previous one by more than 70 celsius degrees for a couple of seconds). The middleware has to identify such deviation and handle it properly. Finally, as time goes by the datasets increased, and the storage has to be adapted to support it.
C. Tackling the Challenges
1) High-throughput Data collection: First of all, the
mid-dleware has to collect data and pre-process it. Two specific functional elements are designed to handle those tasks : (i) the collector and (ii) the message processing blocks.
• Collector.The collector represents the front side of the
Figure 6. V olume.year−1= ϕ(|sensors|, period)
thanks to a REST API (see TAB. I). When a message
array is received, the collector splits it into single message packets and authenticates the sensor. If the sensor is correctly identified, the packet is put into a message queue in order to be processed by the Message processing block. Based on these principles, the collector is intrinsically stateless and can be load-balanced with simple HTTP mechanisms.
• Message processing. Message processing blocks are
designed to pre-process data in the queue before storing them in the database. It allows some specific handling on data coming from a given class of sensors like verifying the relevance of data. These handlers are defined by the system administrator and executed on the received messages. This process can also be load balanced, as in concurrent programming terms the message queue is a data producer and the processing step a consumer. If too much messages are accumulated in the queue, one can start additional consumers to accelerate the processing throughput.
2) Data storage: According to the Velocity of the
re-ceived measurement, the Volume of the datasets become quickly extremely large. Let the length of a sensor data message be assumed as weighting 96b, using the assumption
made in SEC. II (it is an underestimation of classical
mes-sage weights). The volume produced by a set of sensors pushing measurements with a given period is computed as the following: volume = |sensors| × period × 96b.
As a consequence, considering a single sensor with a period of one second, up to 3.03 Gb of data are generated
in a single year. We represent in FIG. 6 the evolution of
this function when both the number of sensors and the period vary, representing the volume of data after one year of measurements.
Figure 7. Virtual sensor implementation.
Table II
DATA RETRIEVAL INTERFACE
Method Resource Return
GET /sensors Properties of all sensors
GET /sensors/{id} Properties of a given sensor
GET /sensors/{id}/data Measurement for a given sensor
To exemplify this challenge, we take in consideration
scenarios presented in SEC. II:
• Parking lot occupation. Let’s consider a single
park-ing space equipped with a sonar located on arbour overhanging the cars. This sonar sends data every 10 seconds. This sonar generates 300 Mb by year. Let’s multiply this amount by the number of sonars on each parking space (∼ 500) : 300 × 500 = 150 Gb.
• Heating regulation. The SophiaTech campus is
com-posed by 8 building with 100 rooms each. Let’s con-sider a single room equipped with a temperature sensor sending data every 10 seconds. By the same computa-tion done previously, we figure out a 300 Mb amount of data produced each year. For a single building this amount is 300 × 100 = 30 Gb. For the whole Sophia-Tech campus this amount of data is : 30 × 8 = 240 Gb The database should offer such storage with a fast data recovery for users. To implement the database, all solutions are possible, e.g., SQL, NoSQL, data warehousing. The usage of a JSON standard format as described in the previous section gave a document orientation to the architecture. As a consequence, the MongoDB NoSQL database was used in the prototype.
VI. ADDINGVALUE TOBIGDATA
In this section, we describe the mechanisms available to an user to exploit the data stored in the previous section. These mechanisms address requirements related to the Data
As A Serviceparadigm (R4).
A. Challenges
Users accesses the database to retrieve data collected from the different sensor networks. As we offer them a large
dataset, search and retrieval might not be as easy as it could seem. Moreover, they might use and build user-defined sensors which perform statistics, aggregation and translation on data. We identify two challenges that need to be tackled:
• Lookup: A convenient way to retrieve specific
measure-ments must be offered to users.
• User-defined sensors: To add value on data, users might
group them to perform statistics and aggregation. More-over, as some data could not be easily understandable (e.g., values returned from sensors depends on the sensor technology), a mechanism to translate these raw data into exploitable data must be provided to users.
B. Application to the SMARTCAMPUSuse case
Since the SMARTCAMPUSproject provides access to the
collected datasets to many different users (e.g., students or researchers), who do not have the same needs, different use cases have to be considered. Indeed, a survey in the campus showed that some people were interested in raw data for statistic uses, others wanted pre-processed data to create third party applications. For example, a developer can build an application which counts how many free parking spaces are available by retrieving from the database the last occupation rate measurements thanks to the sensors deployed on each parking space. This application answers the motivating scenario of parking lot occupation presented
in SEC. II. A user-defined sensor freeSpaces can be defined
as the sum of the other occupation values to build a virtual sensor providing the number of free parking spaces in the campus.
C. Tackling the Challenges
1) Data retrieval: A large dataset is accessible to users. To tackle the lookup challenge, a simple access interface must be provided. The table II presents methods that users can call to retrieve data or
sen-sors properties. The data access can also be
re-stricted depending of the data criticality. The resource
/sensors/{id}/data accepts as an input filtering
requests, e.g., the time range expected by the user, a sampling method to be used to sample the dataset. 2) User-defined sensors: To tackle this challenges, we
introduce the notion of Virtual sensor. A virtual sensor is defined by a user and is stored into the configuration database like a physical one. It differs from physical sensors by having a script properties executed when
its dependencies produce data. For example in FIG. 7,
a physical sonar sensor is located on top of a parking space. An occupation sensor for this space is defined as a script which transform the sonar measurement into a boolean, determining if the space is occupied or free based on the distance between the arbour and the ground. Virtual sensors are used to add transparency for the user. Indeed, they can perform data conversion
and aggregation on-the-fly. From the user’s point of view, everything is transparent: she does not have to know if the sensor is physical or virtual. She only gets from the Data API a list of sensors. An accessor
(cf. FIG. 5) between the Data API and the database
addresses this issue. The accessor leads to two types of behavior when accessing data:
• If the sensor’s type is physical: the accessor
queries the sensor’s data database where sensor’s data are saved, and returns the measurements.
• If the sensor’s type is virtual: the accessor needs
to access both sensor’s configuration database and sensor’s data databases. The sensor’s config-uration database provide the accessor a way to compute measures asked with physical sensor’s measures.
VII. RELATEDWORK
The pervasive dimension of Big Data is known, especially when applied to the IoT and sensors. Research initiatives focused on software architecture in this context address
(i)the storage dimension of the platform [10], (ii) the quality
of the collected data [4] and (iii) the availability of the datasets as services [3]. The architecture presented in this paper complement these efforts, as it strengthen the hard-ware dimension of such an architecture. At the middlehard-ware level, we rely on complementary technologies (e.g., NoSQL databases, service orientation, REST interfaces) that can be integrated with the one used in the previous approaches with well known technologies, e.g., Enterprise Service Buses, workflows. On of the strength of the service orientation is to allow one to replace one service by another, creating its own middleware through the composition of these works, according to her very own needs.
Sensor storage marketplaces are essentially proprietary,
e.g., InfoChimp7, Xively8, TempoDB9. The architecture
de-scribed in this paper is an alternative to these platforms. Moreover, the same architecture supports both data storage and sensor reconfiguration, which is not supported by the previously listed tools.
Sensor data format are critical to support their exploita-tion. Our architecture relies on a simple data format for presentation purpose, which can be replaced by standardized data representation such as the SensorML initiative [11] provided by the Open Geographical Consortium. This
fam-ily of languages defined the Sensor Observation Service10
facility to support sensor measurements (meta) data repre-sentation [12].
From a service-oriented point of view, the literature con-tains work about the requirements of a sensor collection
7http://www.infochimps.com/
8http://xively.com/
9https://tempo-db.com
middleware [13], or the definition of sensor data exploita-tion [14]. Our work is complementary, as it glues all these approaches together.
VIII. CONCLUSIONS& PERSPECTIVES
In the context of the IoT, this paper describes a software architecture that supports research efforts on Big Data through the collection of large datasets obtained from phys-ical sensors. This architecture addresses real-life
require-ments extracted from the SMARTCAMPUS project, which
aims to equip an academic campus with sensors and supports the definition of innovating application exploiting these data. This architecture goes from sensors to data management, and supports a user who wants to set up a research or production infrastructure to collect very large datasets in the context of the IoT. The architecture is validated based on
SMARTCAMPUSscenarios, assessing its viability in practical
contexts.
The SMARTCAMPUSproject is still at its beginning. As a
consequence, the work done in this architecture focused on data collection and storage, i.e., the critical path of any Big
Data collection platform. The next step is to exploit these
large datasets: initial scenarios (e.g., temperature evolution, parking lot occupation rate) were validated, and we are conducting surveys and user interviews to capture extra re-quirements from campus’ users. The key point is to develop software application on top of these datasets to support the base scenarios, and open the datasets to the users to let them create their own services. It triggers interesting challenges about scalability of a community-driven usage of such an open data platform, the evolution capabilities of the Data as
a Service API, as well as privacy and security issues. We
plan to address these points in future works.
ACKNOWLEDGMENT
This project is partially funded by the Univ. Nice Sophia Antipolis and the I3S laboratory. Authors want to thanks the
SMARTCAMPUS team: Romain Alexandre, Mireille
Blay-Fornarino, Cecile Camilieri, Adrien Casanova, Joel Colinet, Philippe Collet, Thomas Di’Meco, Fabien Foerster, Ivan Lo-gre, Laura Martellotto, Jean Oudot, J´erome Rancati, Marie-Catherine Turchini and Guillaume Zanotti.
REFERENCES
[1] J. Manyika, M. Chui, B. Brown, J. Bughin, R. Dobbs, C. Roxburgh, and A. H. Byers, “Big data: The Next Frontier for Innovation, Competition, and Productivity,” McKinsey Global Institute, May 2011.
[2] L. Atzori, A. Iera, and G. Morabito, “The Internet of Things: A Survey,” Comput. Netw., vol. 54, no. 15,
pp. 2787–2805, Oct. 2010. [Online]. Available: http:
//dx.doi.org/10.1016/j.comnet.2010.05.010
[3] J. Zhang, B. Iannucci, M. Hennessy, K. Gopal, S. Xiao, S. Kumar, D. Pfeffer, B. Aljedia, Y. Ren, M. Griss et al., “Sensor Data as a Service–A Federated Platform for Mobile Data-centric Service Development and Sharing,” in Services Computing (SCC), 2013 IEEE International Conference on. IEEE, 2013, pp. 446–453.
[4] L. Ramaswamy, V. Lawson, and S. Gogineni, “Towards a Quality-centric Big Data Architecture for Federated Sensor Services,” in Big Data (BigData Congress), 2013 IEEE International Congress on, June 2013, pp. 86–93.
[5] A. Zaslavsky, C. Perera, and D. Georgakopoulos, “Sensing as a Service and Big Data,” arXiv preprint arXiv:1301.0159, 2013.
[6] N. Haderer, R. Rouvoy, and L. Seinturier, “Dynamic De-ployment of Sensing Experiments in the Wild Using Smart-phones,” in DAIS, ser. Lecture Notes in Computer Science, J. Dowling and F. Ta¨ıani, Eds., vol. 7891. Springer, 2013, pp. 43–56.
[7] S. Mosser, F. Fleurey, B. Morin, F. Chauvel, A. Solberg, and I. Goutier, “SENSAPP as a Reference Platform to Support Cloud Experiments: From the Internet of Things to the Inter-net of Services,” in Management of resources and services in
Cloud and Sky computing (MICAS), workshop. Timisoara:
IEEE, Sep. 2012.
[8] S. Mosser, I. Logre, N. Ferry, and P. Collet, “From Sensors to Visualization Dashboards: Need for Language Composition,” in Globalization of Modelling Languages
workshop (GeMOC’13). Miami: IEEE, Sep. 2013, pp. 1–6.
[Online]. Available: http://www.i3s.unice.fr/∼mosser/ media/
research/gemoc13.pdf
[9] D. Crockford, “The application/json Media Type
for JavaScript Object Notation (JSON),” RFC 4627
(Informational), Internet Engineering Task Force, Jul. 2006. [Online]. Available: http://www.ietf.org/rfc/rfc4627.txt [10] P. B. Gibbons, B. Karp, Y. Ke, S. Nath, and S. Seshan,
“IrisNet: An Architecture for a Worldwide Sensor Web,” IEEE Pervasive Computing, vol. 02, no. 4, pp. 22–33, 2003. [11] M. Botts and A. Robin, “OpenGIS Sensor Model Language (SensorML) Implementation Specification,” OGC, Tech. Rep., Jul. 2007.
[12] C. A. Henson, J. Pschorr, A. P. Sheth, and K. Thirunarayan, “SemSOS: Semantic Sensor Observation Service.” in CTS,
W. K. McQuay and W. W. Smari, Eds. IEEE, 2009, pp.
44–53. [Online]. Available: http://dblp.uni-trier.de/db/conf/ cts/cts2009.html#HensonPST09
[13] N. Mohamed and J. Al-Jaroodi, “A Survey on Service-oriented Middleware for Wireless Sensor Networks,” Serv.
Oriented Comput. Appl., vol. 5, no. 2, pp. 71–85,
Jun. 2001. [Online]. Available: http://dx.doi.org/10.1007/ s11761-011-0083-x
[14] S. R. Madden, M. J. Franklin, J. M. Hellerstein, and W. Hong, “TinyDB: An Acquisitional Query Processing System for Sensor Networks,” ACM Trans. Database Syst., vol. 30, no. 1, pp. 122–173, Mar. 2005. [Online]. Available: http://doi.acm.org/10.1145/1061318.1061322
![Figure 1. Big Data levers in the manufacturing value chain [1].](https://thumb-eu.123doks.com/thumbv2/123doknet/13505049.415511/3.918.470.839.104.353/figure-big-data-levers-manufacturing-value-chain.webp)