R E S E A R C H
Open Access
Association between time perspective and
organic food consumption in a large
sample of adults
Marc Bénard
1*, Julia Baudry
1, Caroline Méjean
1,2, Denis Lairon
3, Kelly Virecoulon Giudici
1, Fabrice Etilé
4,
Gérard Reach
5, Serge Hercberg
1,6,7, Emmanuelle Kesse-Guyot
1and Sandrine Péneau
1Abstract
Background: Organic food intake has risen in many countries during the past decades. Even though motivations associated with such choice have been studied, psychological traits preceding these motivations have rarely been explored. Consideration of future consequences (CFC) represents the extent to which individuals consider future versus immediate consequences of their current behaviors. Consequently, a future oriented personality may be an important characteristic of organic food consumers. The objective was to analyze the association between CFC and organic food consumption in a large sample of the adult general population.
Methods: In 2014, a sample of 27,634 participants from the NutriNet-Santé cohort study completed the CFC questionnaire and an Organic-Food Frequency questionnaire. For each food group (17 groups), non-organic food consumers were compared to organic food consumers across quartiles of the CFC using multiple logistic regressions. Moreover, adjusted means of proportions of organic food intakes out of total food intakes were compared between quartiles of the CFC. Analyses were adjusted for socio-demographic, lifestyle and dietary characteristics.
Results: Participants with higher CFC were more likely to consume organic food (OR quartile 4 (Q4) vs. Q1 = 1.88, 95% CI: 1.62, 2.20). Overall, future oriented participants were more likely to consume 14 food groups. The strongest associations were observed for starchy refined foods (OR = 1.78, 95% CI: 1.63, 1.94), and fruits and vegetables (OR = 1.74, 95% CI: 1.58, 1.92). The contribution of organic food intake out of total food intake was 33% higher in the Q4 compared to Q1. More precisely, the contribution of organic food consumed was higher in the Q4 for 16 food groups. The highest relative differences between Q4 and Q1 were observed for starchy refined foods (22%) and non-alcoholic beverages (21%). Seafood was the only food group without a significant difference.
Conclusions: This study provides information on the personality of organic food consumers in a large sample of adult participants. Consideration of future consequences could represent a significant psychological determinant of organic food consumption.
Keywords: Organic food consumption, Nutrition, Consideration of future consequences, Psychology
* Correspondence:m.benard@eren.smbh.univ-paris13.fr
1
Equipe de Recherche en Epidémiologie Nutritionnelle, Centre de Recherche en Epidémiologie et Statistique Sorbonne Paris Cité, INSERM U1153, INRA U1125, Cnam, Université Paris 13, 74, rue Marcel Cachin, 93017 Bobigny, France
Full list of author information is available at the end of the article
© The Author(s). 2018 Open Access This article is distributed under the terms of the Creative Commons Attribution 4.0 International License (http://creativecommons.org/licenses/by/4.0/), which permits unrestricted use, distribution, and reproduction in any medium, provided you give appropriate credit to the original author(s) and the source, provide a link to the Creative Commons license, and indicate if changes were made. The Creative Commons Public Domain Dedication waiver (http://creativecommons.org/publicdomain/zero/1.0/) applies to the data made available in this article, unless otherwise stated.
Background
The demand of organic foods has been notably increas-ing over the past years. In France, sales of organic products represented 5.5 billion euros in 2014 corre-sponding to a 10% increase from the previous year as it was the case in most European countries [1]. The major reasons regarding the purchase of organic foods include altruistic motives such as environmental and ethics as-pects [2–7], and self-centered motives such as health, food safety, and sensory aspects [2, 4, 6, 8, 9]. Despite individual differences concerning these motivations, specific psychological traits which could lead to these motivations, and thus to an organic food consumption oriented behavior, have rarely been explored.
Consideration of Future Consequences (CFC) is a con-struct which measures “the extent to which individuals consider the potential distant outcomes of their current behaviors and the extent by which they are influenced by these potential outcomes [10].” Individuals with a low CFC are expected to act on their immediate needs and concerns whereas individuals with a high CFC are ex-pected to consider the future implication of their behav-ior and to use their distant goals as guides for their current actions. Higher CFC have been shown to be associated with healthy and environmentally friendly be-haviors [10]. In particular, several studies found that fu-ture oriented individuals were more likely to have a health oriented behavior, such as exercising more [11, 12], pre-senting healthy eating attitudes and intentions [13], being more sensitive to health communications to get tested for colorectal cancer [14], and participating in diabetes screening [15]. A meta-analysis measuring time per-spective with different constructs found that future time perspective influenced individual attitudes and be-haviors towards the environment [16], such as environ-mental preservation [17], recycling and waste reduction [18], and water conservation [19]. Finally, a study re-ported future oriented consumers to be more careful about organic labels, suggesting a higher interest in health related and sustainability issues [20]. However, to our knowledge no data are available on the relation-ship between time orientation and organic food intakes. The aim of this study was therefore to analyze the association between consideration of futures conse-quences and the consumption of 17 organic food groups in a sample of the general population partici-pating in the NutriNet-Santé cohort study by taking into account sociodemographic, lifestyle and dietary characteristics. Firstly, we wanted to assess whether or-ganic food consumers were more likely to be future ori-ented compared to nonorganic food consumers. Then, we quantitatively analyzed intakes of organic food ac-cording to the individual level of consideration of fu-ture consequences.
Methods
Population
This study was conducted as part of the NutriNet-Santé study, which is a large ongoing web-based prospective cohort started in France in May 2009.The rationale, design and methods of the study have been described elsewhere [21]. Its overall aim is to explore the relation-ships between nutrition and health and the deter-minants of eating behavior and nutritional status. Participants are adult volunteers (age≥ 18 years) of the general French population with a scheduled follow-up of at least 10 years. At inclusion, participants have to complete several self-reported web-based question-naires to assess their diet, their physical activity, anthropometric measures, lifestyle characteristics, so-cioeconomic conditions and health status. Participants complete this set of questionnaires every year after in-clusion. Finally, another set of optional questionnaires related to determinants of eating behaviors, nutritional status, and specific aspects related to health are sent to every participant each month. A flowchart of the par-ticipants included in this study is available as Additional file 1.
This study was conducted in accordance with the guidelines of the Declaration of Helsinki, and all proce-dures were approved by the International Research Board of the French Institute for Health and Medical Research (IRB Inserm n° 0000388FWA00005831) and the Commission Nationale Informatique et Libertés (CNIL n° 908450 and n° 909216). Electronic informed consent was obtained from all participants.
Data collection
Consideration of future consequences
Consideration of Future Consequences was assessed with the French version of the CFC-12 questionnaire [22] over a 6-month period from June to November 2014. The CFC-12 is a 12-item self-report ques-tionnaire [10] developed to measure the extent to which individuals consider distant versus immediate consequences of their behavior. Each item is measured on a 5-point Likert scale ranging from “extremely un-characteristic” to “extremely un-characteristic”. An ex-ample of the items of the CFC-12 is as followed: I consider how things might be in the future, and try to influence those things with my day to day behavior. The total score is obtained by summing each item ratings leading to a possible range from 12 to 60 (higher scores indicating greater consideration of future conse-quences). Participants were divided into 4 categories determined by quartiles of the total score (Q1, Q2, Q3, and Q4). A good internal consistency was obtained in our sample with a Cronbach’s α of 0.79.
Dietary intake
To assess their organic food consumption, participants completed a semi-quantitative organic food frequency questionnaire (Org-FFQ) by providing the frequency and portion sizes of consumed foods and beverages. The Org-FFQ was administered over a 5-month period from June to October 2014. This questionnaire was based on a validated food frequency questionnaire [23] supple-mented by a section pertaining to the frequency of or-ganic food consumption. More precisely, participants were asked to report their frequency of consumption and the quantity consumed over the past year for 264 items allowing to assess total food intakes (g/d). In addition, the frequency of organic food consumption for each item was assessed with a 5-point Likert scale ranging from never to always. Organic food intake (g/d) was ob-tained for each item by applying a weight of 0, 0.25, 0.5, 0.75 and 1 to the five respective categories of frequency (never, rarely, half the time, often and always). A full de-scription of the Org-FFQ as well as sensitivity analyses pertaining to weighting can be found elsewhere [24].
Beverage and food items were aggregated into 17 food groups: fruits and vegetables (including juices and soups); seafood; meat, poultry and processed meat; eggs; dairy products; starchy refined foods; whole-grain products; legumes; fats (oil, butter, and margarine); fatty sweets (in-cluding cake, chocolate, ice cream, and pancakes); non-fatty sweets (including honey, jelly, sugar, and candy); alcoholic beverages; non-alcoholic beverages; fast food; snacks (including chips and salted biscuits); dressings and sauces; and dairy products and meat substitutes (including soya-based products). For each food group, contribution of organic food consumed was estimated by computing the organic food intake of the food group (g/d) out of the total food intake of the food group (g/d) multiplied by 100. Total energy intake (kcal/day) was also calculated using a validated composition table [25]. Participants with unlikely estimates of energy intake were identified as under- and over-reporting participants against estimated energy requirement. Basal metabolic rate (BMR) was cal-culated according to age, gender, weight and height using Schofield’s equations [26]. The ratio between energy in-take and estimated energy requirement (physical activity level x BMR, with physical activity level set by default at 1.55) was calculated and individuals with ratios below the 1st percentile (0.35) or above the 99th percentile (1.93) were excluded. These cutoffs were calculated on the vali-dated FFQ for usual dietary intake used in the NutriNet-Santé cohort [23].
Socio-demographic, economic, anthropometric and lifestyle characteristics
Potential confounders of the relationship between CFC and organic food consumption were collected based on
information provided yearly by the participants after their inclusion: age (years), gender, education level (pri-mary, secondary, undergraduate, and postgraduate), oc-cupational status (unemployed, student, self-employed and farmer, employee and manual worker, managerial staff and intellectual profession, intermediate profession, and retired), monthly income per household unit, place of residence (rural community, urban unit with a popu-lation < 20,000 inhabitants, urban unit with a popupopu-lation between 20,000 and 200,000 inhabitants, and urban unit with a population > 200,000 inhabitants), and BMI (kg/m2). More precisely, monthly income per household unit was calculated with information about income and com-position. The number of people of the household was converted into a number of consumption units (CU) ac-cording to a weighting system: one CU is attributed for the first adult in the household, 0.5 for other persons aged 14 or older and 0.3 for children under 14 [27]. Categories of income were defined as followed: < 1200; 1200–1799; 1800–2299; 2300–2699; 2700–3699; and > 3700 euros per household unit as well as“unwilling to answer”.
The Programme National Nutrition Santé Guidelines Score (PNNS-GS), which is an a priori nutritional diet quality score reflecting the adherence to the French nu-tritional recommendations of the participants [28], was considered as a confounder in the analyses. The original score includes 13 components: eight refer to food serv-ing recommendations, four refer to moderation of nutri-ents or food, and one refers to physical activity. Points are deducted for overconsumption of salt and sweets. Points are also deducted from the total when energy in-take exceeds the energy needs by more than 5%. A modified version of the PNNS-GS (mPNNS-GS) that did not include the physical activity component was used in this study. The score has a range of 0 to 13.5 points, with a higher score indicating a better overall nu-tritional quality of the diet.
Statistical analysis
The characteristics of the sample across quartiles of the CFC-12 were compared with linear contrast tests for continuous variables, and with Mantel-Haenszel chi-square tests for categorical variables. Logistic regression models were performed between organic food consump-tion as a dependent variable (organic food consumer versus non-organic food consumer (reference)) for each of the 17 food groups) and the four categories (quartile, Q) of the CFC-12 as the main independent variable (Q1 as reference). The strength of the association was esti-mated by calculating odds ratios (ORs) and 95% confi-dence intervals (95% CI). Furthermore, adjusted means of proportions of the contribution of organic food to the total food intake by food group were compared across categories of the CFC-12 for the 17 food groups among
organic food consumers only. A percentage of the rela-tive difference between adjusted means of Q4 and Q1 was calculated to estimate the effect size of the differ-ences. For every analysis on each food group, partici-pants who did not report to consume at least one food item of the group (organic or non-organic food intakes) were excluded from the analysis of this food group. Since socio-economic positions are associated with CFC [29] and dietary intakes, all adjusted models included the following confounders: age, gender, education level, occupational status, monthly income per household unit, and place of residence. In addition, it has been suggested that time perspective can predict or be predicted by health behaviors [12]. Moreover, BMI, energy intake, mPNNS-GS (diet quality), and total food intake of the food group all predict the level of organic food con-sumption and were thus taken into account. No signifi-cant interaction terms were found between the CFC-12 and confounders. Missing data on confounding variables were handled with multiple imputation by chained eqs. (20 imputed datasets) [30].
All tests of statistical significance were 2-sided and significance was set at 5%. A Hochberg procedure was applied to correct for multiple testing. Statistical ana-lyses were performed using SAS software (SAS Institute Inc., version 9.4).
Results
Description of the sample
A total of 33,384 participants of the NutriNet-Santé co-hort study completed the Org-FFQ. Among these partic-ipants 2097 underreporters and overreporters were excluded, as well as 2320 individuals with missing covar-iates (which are required to assess inappropriate energy intake), and 722 participants residing in overseas terri-tories. From those 28,245 individuals, 27,843 completed the CFC-12. Then, 209 participants who presented an acquiescence bias (agreeing to all questions without con-sideration of reversed items) in answers of the CFC-12 were excluded, leaving 27,634 participants in the final analysis. A total of 51,394 participants from the NutriNet-Santé study completed the CFC-12 question-naires. Compared to excluded participants, the 27,634 participants in the final analysis were older (53.2 ± 14.1 years old for included participants vs 47.1 ± 14.5 years old for excluded participants, p < .0001), more often men (25.6% vs. 20.5%, p < .0001), had less often a university education (34.6% vs. 40.5%, p < .0001). In aver-age, included participants had a lower CFC score (40.5 ± 7.1 vs. 40.9 ± 6.9, p < .0001). This marginal difference was likely to be significant due to the large sample size.
Table 1 shows characteristics of the sample according to the 4 categories determined by quartiles of the
CFC-12. Overall, apart from energy intake, there was a signifi-cant linear trend between every variable analyzed and the categories of the CFC-12 (all P < .0001). Compared to Q1, participants in higher categories of CFC con-sumed more organic food (overall), were younger, were less often women, had more often a high level of educa-tion, were less often unemployed, employee, manual worker or retired and were more often student, self-employed, farmer, from managerial staff or intellectual professions, had more often a high monthly income per household, lived more often in large urban units, had a lower BMI, and had a higher mPNNS-GS.
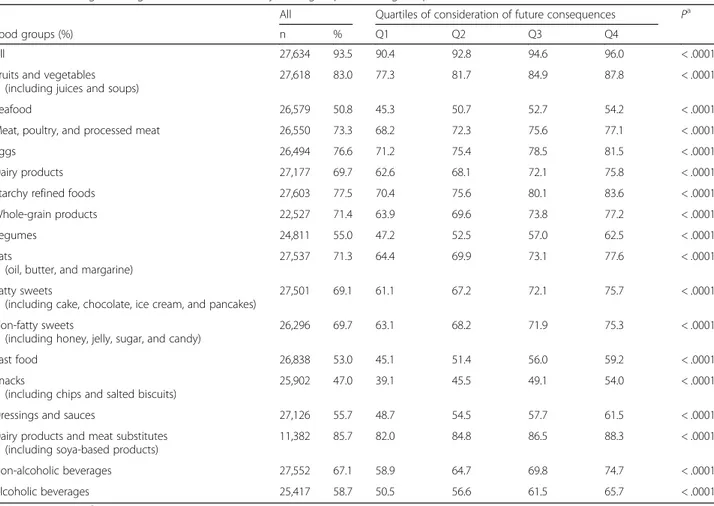
Table 2 shows the percentages of organic food con-sumers in the 17 food groups according to CFC-12 cat-egories. A significant linear trend was observed for every food group (all P < .0001).
Association between consideration of future consequences and organic food consumption
Table 3 presents the results of logistic regression models between categories of the CFC-12 and organic food con-sumption and shows significant linear trends for most food groups. Overall, future oriented participants were more likely to consume organic foods. In particular, compared to Q1, participants in higher categories of the CFC-12 were more likely to consume organic: fruits and vegetables, eggs, dairy products, starchy refined foods, whole-grain products, legumes, fats, fatty sweets, non-fatty sweets, alcoholic beverages, non-alcoholic bever-ages, fast food, snacks, and dressing and sauces. Three food groups did not present a significant linear trend: seafood, meat, poultry and processed meat, and dairy products and meat substitutes. Comparing Q4 vs. Q1, the strongest associations were found for starchy refined foods (OR = 1.78, 95% CI: 1.63, 1.94), fruits and vegeta-bles (OR = 1.74, 95% CI: 1.58, 1.92), and non-alcoholic beverages (OR = 1.72, 95% CI: 1.59, 1.85).
Table 4 focuses on organic consumers and shows the proportions of organic food consumed out of the total intake across categories of the CFC-12. The ratio of total organic food intakes out of total intakes significantly in-creased from 20.39% (Q1) to 27.12% (Q4) with a relative difference of 33%. There was a significant increase of the proportion of organic food consumed (on total intakes) for almost every group: fruits and vegetables, seafood, meat, poultry and processed meat, eggs, dairy products, starchy refined foods, whole-grain products, legumes, fats, fatty sweets, non-fatty sweets, alcoholic beverages, non-alcoholic beverages, fast food, snacks, dressings and sauces, and dairy products and meat substitutes. Seafood was the only food group without a statistical significant p-value for linear trend. The highest relative differences between Q4 and Q1 were observed for starchy refined foods (22%), and non-alcoholic beverages (21%); whereas
Table 1 Individuals characteristics of the participants of the according to categories of the CFC
All Quartiles of Consideration of Future Consequences Pa
Q1 Q2 Q3 Q4
< 36 36–40 41–46 > 46
n 27,634 6670 7107 6964 6893
% 100 24.1 25.7 25.2 24.9
CFC-12 (12–60) 40.5 ± 7.1 31.3 ± 3.7 38.0 ± 1.4 43.0 ± 1.4 49.4 ± 3.0
Total organic food intake (g/d) 760.3 ± 799.7 625.8 ± 738.5 717.3 ± 779.5 775.0 ± 789.4 920.1 ± 857.4 < .0001
Age (years)b 53.2 ± 14.1 55.9 ± 13.2 54.6 ± 13.8 51.6 ± 14.2 50.5 ± 14.5 < .0001 Gender (%) < .0001 Women 74.4 76.0 74.9 74.0 72.7 Men 25.6 24.0 25.1 26.0 27.3 Education level (%) < .0001 Primary 2.8 5.5 3.2 1.7 1.0 Secondary 32.9 46.6 38.2 27.2 20.1 Undergraduate 29.6 27.1 30.7 31.5 29.1 Postgraduate 34.6 20.8 27.8 39.7 49.8 Occupational status (%) < .0001 Unemployed 8.8 9.9 8.6 8.1 8.6 Student 1.2 0.6 0.9 1.3 2.0 Self-employed, farmer 1.7 1.5 1.6 1.7 2.2
Employee, manual worker 14.2 17.2 14.8 13.8 11.2
Intermediate professions 13.8 11.2 13.7 15.9 14.1
Managerial staff, intellectual profession 21.0 12.5 16.9 24.8 29.4
Retired 39.3 47.0 43.5 34.5 32.4 Monthly income (%)c < .0001 < 1200€ 10.1 12.2 10.1 8.8 9.3 1200–1799€ 20.9 23.0 21.3 20.6 18.7 1800–2299€ 15.3 16.2 16.3 14.8 13.9 2300–2699€ 10.3 10.1 10.3 10.6 10.2 2700–3699€ 17.7 14.3 17.1 18.6 20.9 > 3700€ 13.2 9.1 11.4 14.8 17.2 Unwilling to answer 12.3 14.9 13.4 11.5 9.5 Missing data 0.2 0.2 0.2 0.3 0.3 Place of residence (%) < .0001 Rural community 22.0 22.7 22.5 21.3 21.5
Urban unit with a population < 20,000 inhabitants 15.5 16.8 16.0 14.6 14.4
Urban unit with a population between 20,000 and 200,000 inhabitants
18.0 18.7 18.4 18.0 17.0
Urban unit with a population > 200,000 inhabitants 44.5 41.8 43.1 46.0 47.1
BMI (kg/m2)b 24.2 ± 4.5 25.0 ± 5.0 24.4 ± 4.6 24.0 ± 4.4 23.3 ± 4.0 < .0001
Energy intake (kcal/d)b 1994 ± 629 2017 ± 646 1982 ± 632 1975 ± 615 2002 ± 620 .32
mPNNS-GSb 8.5 ± 1.8 8.4 ± 1.8 8.5 ± 1.8 8.5 ± 1.7 8.6 ± 1.7 < .0001
mPNNS-GS, modified Programme National Nutrition Santé Guideline Score
ap-value based on linear trend for continuous variables or Mantel-Haenszel chi-square test for categorical variables (corrected for multiple testing with a
Hochberg procedure)
b
Mean ± SD
cMonthly income represents the household income per month calculated by consumption unit (CU). The number of people of the household was
converted into a number of CU according to a weighting system: one CU is attributed for the first adult in the household, 0.5 for other persons aged 14 or older and 0.3 for children under 14 [27]
the lowest relative differences were observed for dairy products and meat substitutes (6%), and eggs (7%).
Discussion
Overall, analyses performed in this study showed higher organic food consumption among future oriented indi-viduals compared to less future oriented participants in-dependently of socioeconomic, lifestyle and dietary characteristics. First, individuals with a high consider-ation of future consequences were found more likely to eat organic foods. Then, among organic food consumers, future oriented individuals were also found in average to have a higher contribution of organic foods in their diet.
Characteristics of future oriented individuals
Our results supported previous data of the literature in-dicating that future oriented individuals were younger [29], had more often a high education level [31], and had a lower BMI [12, 29], compared with less future ori-ented individuals.
Association between consideration of future consequences and organic food consumption
Overall, results of the association between consideration of future consequences and organic food consumption showed that future oriented individuals were more likely to consume organic food. Moreover, when considering consumers of organic food groups specifically, the more participants were future oriented, the higher was the average contribution of organic foods in their diet (for almost every food group considered). Therefore, these analyses, focusing either on the whole sample or on or-ganic food consumers specifically, both show a link be-tween CFC and organic food intake. No significant interaction was found between gender and CFC in our study, suggesting no moderation effect of gender on the relationship between CFC and organic food intakes. To our knowledge, our study is the first to take into account the CFC-12 or any other measure of time perspective to assess the likelihood of organic food consumption. One study showed evidence that preferences for food prod-ucts with an organic logo varied according to the level of future orientation [20].
Table 2 Percentages of organic food consumers by food group according to quartiles of the CFC
All Quartiles of consideration of future consequences Pa
Food groups (%) n % Q1 Q2 Q3 Q4
All 27,634 93.5 90.4 92.8 94.6 96.0 < .0001
Fruits and vegetables (including juices and soups)
27,618 83.0 77.3 81.7 84.9 87.8 < .0001
Seafood 26,579 50.8 45.3 50.7 52.7 54.2 < .0001
Meat, poultry, and processed meat 26,550 73.3 68.2 72.3 75.6 77.1 < .0001
Eggs 26,494 76.6 71.2 75.4 78.5 81.5 < .0001
Dairy products 27,177 69.7 62.6 68.1 72.1 75.8 < .0001
Starchy refined foods 27,603 77.5 70.4 75.6 80.1 83.6 < .0001
Whole-grain products 22,527 71.4 63.9 69.6 73.8 77.2 < .0001
Legumes 24,811 55.0 47.2 52.5 57.0 62.5 < .0001
Fats
(oil, butter, and margarine)
27,537 71.3 64.4 69.9 73.1 77.6 < .0001
Fatty sweets
(including cake, chocolate, ice cream, and pancakes)
27,501 69.1 61.1 67.2 72.1 75.7 < .0001
Non-fatty sweets
(including honey, jelly, sugar, and candy)
26,296 69.7 63.1 68.2 71.9 75.3 < .0001
Fast food 26,838 53.0 45.1 51.4 56.0 59.2 < .0001
Snacks
(including chips and salted biscuits)
25,902 47.0 39.1 45.5 49.1 54.0 < .0001
Dressings and sauces 27,126 55.7 48.7 54.5 57.7 61.5 < .0001
Dairy products and meat substitutes (including soya-based products)
11,382 85.7 82.0 84.8 86.5 88.3 < .0001
Non-alcoholic beverages 27,552 67.1 58.9 64.7 69.8 74.7 < .0001
Alcoholic beverages 25,417 58.7 50.5 56.6 61.5 65.7 < .0001
a
p-value is based on χ2
Although very little data is available on association be-tween psychological traits and organic consumption, many studies have investigated how psychological traits influence motives behind organic food choices. A large list of mo-tives has been found to predict organic food intake, such as environmental and ethics aspects [2–7, 32, 33], or health, food safety and sensory aspects [2, 4, 6, 8, 9, 32, 33]. Broadly, these motives could be divided into two cate-gories: environmental concerns (considered as altruistic motives), and individual concerns such as health (self-cen-tered motives) [34]. Future time perspective has been shown to lead to a pro-environmental behavior [16] and to more health oriented behaviors [11, 12, 14, 15]. Consi-deration of future consequences could therefore be a psy-chological construct predicting organic food consumption through altruistic or self-centered motives (or both), which could explain the higher proportion of organic food consumers among future oriented participants. Significant linear trends showing increases of proportions of organic food intakes among organic food consumers across cat-egories of the CFC strengthened this hypothesis.
Food group differences
Future oriented individuals were more likely to consume organic foods, but strengths of the association varied
depending on the food group. The strongest associations were found for starchy refined foods, fruits and vegeta-bles, and non-alcoholic beverages. No associations were found for seafood, meat, poultry and processed meat, and dairy products and meat substitutes. Specific factors could play an important role and weaken the relation-ship between time perspective and the consumption of these organic food groups. For example, constraints like price or origin of the product represent important fac-tors in food choices and purchases [35]. Organic prod-ucts with the highest differences in price between the organic and the conventional version such as meat, poultry and processed meat [36] could be consumed less because the price constraint would be too important [37]. Moreover, differences in the availability across products could also explain these different associations [38]. For example, less available products could be less purchased and less likely to be consumed. Some studies showed that fruits and vegetables intake in the diet was the most popular organic foods in proportion, whereas meat products and fishes were the least popular prod-ucts [5, 39]. Our results also suggest that the strongest associations were found in the food groups which show or which are thought to have the greatest benefits for the environment or health (or both) when consumed in
Table 3 Logistic regression models between CFC and the likelihood to consume organic foods
Quartiles of consideration of future consequencesa
Q1 Q2 Q3 Q4 Pb
Food groups n Ref. OR (95% CI) OR (95% CI) OR (95% CI)
All 27,634 1 1.24 (1.09, 1.40) 1.51 (1.32, 1.74) 1.88 (1.62, 2.20) .0043
Fruits and vegetables (including juices and soups) 27,618 1 1.22 (1.12, 1.33) 1.46 (1.33, 1.60) 1.74 (1.58, 1.92) < .0001
Seafood 26,579 1 1.20 (1.12, 1.29) 1.26 (1.18, 1.36) 1.30 (1.21, 1.39) .32
Meat, poultry, and processed meat 26,550 1 1.15 (1.07, 1.24) 1.31 (1.21, 1.42) 1.34 (1.23, 1.46) .08
Eggs 26,494 1 1.18 (1.09, 1.27) 1.34 (1.23, 1.46) 1.53 (1.40, 1.67) .0008
Dairy products 27,177 1 1.20 (1.11, 1.29) 1.36 (1.26, 1.47) 1.55 (1.43, 1.68) .0003
Starchy refined foods 27,603 1 1.22 (1.13, 1.32) 1.49 (1.38, 1.62) 1.78 (1.63, 1.94) < .0001
Whole-grain products 22,527 1 1.25 (1.15, 1.36) 1.49 (1.37, 1.62) 1.66 (1.52, 1.82) .0002
Legumes 24,811 1 1.18 (1.09, 1.27) 1.35 (1.25, 1.46) 1.55 (1.44, 1.68) < .0001
Fats (oil, butter, and margarine) 27,537 1 1.22 (1.13, 1.31) 1.38 (1.28, 1.49) 1.67 (1.54, 1.81) < .0001 Fatty sweets (including cake, chocolate, ice cream, and pancakes) 27,501 1 1.23 (1.15, 1.33) 1.48 (1.37, 1.60) 1.67 (1.55, 1.81) < .0001 Non-fatty sweets (including honey, jelly, sugar, and candy) 26,296 1 1.22 (1.13, 1.31) 1.42 (1.32, 1.54) 1.62 (1.49, 1.75) < .0001
Fast food 26,838 1 1.24 (1.16, 1.33) 1.44 (1.34, 1.55) 1.57 (1.46, 1.69) .0002
Snacks (including chips and salted biscuits) 25,902 1 1.26 (1.17, 1.36) 1.42 (1.32, 1.53) 1.63 (1.51, 1.76) < .0001
Dressings and sauces 27,126 1 1.23 (1.15, 1.32) 1.40 (1.30, 1.50) 1.58 (1.47, 1.70) < .0001
Dairy products and meat substitutes (including soya-based products) 11,382 1 1.19 (1.02, 1.38) 1.36 (1.17, 1.59) 1.51 (1.28, 1.77) .30
Non-alcoholic beverages 27,552 1 1.20 (1.12, 1.29) 1.44 (1.33, 1.55) 1.72 (1.59, 1.85) < .0001
Alcoholic beverages 25,417 1 1.21 (1.13, 1.30) 1.40 (1.30, 1.51) 1.59 (1.48, 1.72) < .0001
a
Model 2: model adjusted on age, gender, education level, occupational status, monthly income per household unit, place of residence, BMI, energy intake, mPNNS-GS (modified Programme National Nutrition Santé Guideline Score), and total food intake of the food group considered in the model
b
their organic version compared to their conventional versions, and inversely for some of the weakest associa-tions. Maximum residue level exceedances are higher in conventionally produced products compared to organic products [40].
In addition, among consumers of organic food products, the highest relative differences in proportions of organic intakes between Q4 and Q1 were found for starchy refined foods, non-alcoholic beverages, while the weakest vari-ation were found for dairy products and meat substitutes, and eggs. The strength of the associations found for this analysis was similar to previous results. Similarly, observed differences between food groups could be explained by constraints regarding price, access, and environment, even among organic food consumers [38].
Strengths and limitations
The main strength of this study is its large sample size with subjects of various socio-demographic characteris-tics which allows controlling for confounding factors
while keeping a reasonable statistical power. Yet, other potential confounders were not taken into account, such as environmental factors and the availability of organic food. The second strength of this study was the use of a semi-quantitative food frequency questionnaire of 264 items which allowed a reliable estimation of usual diet over the previous year for conventional and organic in-takes, despite a possibility of overestimation of intakes. The two complementary analyses, on the whole sample, and on organic food consumers specifically, bring more confidence on the relationship between consideration of future consequences and organic food intake. Questions concerning frequency of organic food consumption were not validated and could have led to misestimate the per-centages of organic food consumer or proportions of organic food consumption in the diet. However, the esti-mation of organic food consumers was not substantially modified in a sensitivity analysis assessing the robustness of the scale [24]. In addition, considering that the com-pletion of the Org-FFQ was optional and the long set of
Table 4 Adjusted proportions of organic food intake out of total food intake, by food group, among consumers of organic foods
Categories of consideration of future consequences Relative difference between Q4-Q1 (%)
Pa
n Q1 Q2 Q3 Q4
Food groups meanb SE meanb SE meanb SE meanb SE
All 25,828 20.39 0.26 22.40 0.25 23.89 0.25 27.12 0.25 33 < .0001
Fruits and vegetables (including juices and soups)
22,921 37.57 0.40 39.56 0.37 41.09 0.37 44.64 0.37 19 < .0001
Seafood 13,491 31.92 0.46 31.94 0.41 31.79 0.41 33.41 0.42 5 0.13
Meat, poultry, and processed meat 19,464 29.34 0.38 30.52 0.35 30.48 0.35 33.16 0.36 13 < .0001
Eggs 20,307 69.32 0.44 69.83 0.41 71.06 0.40 74.22 0.41 7 < .0001
Dairy products 18,936 36.50 0.47 38.16 0.43 40.24 0.43 43.59 0.43 19 < .0001
Starchy refined foods 21,385 34.05 0.42 35.86 0.39 37.47 0.38 41.41 0.38 22 < .0001
Whole-grain products 16,089 53.28 0.54 53.67 0.48 55.56 0.46 59.96 0.46 13 < .0001
Legumes 13,646 56.23 0.57 57.04 0.51 58.38 0.49 62.47 0.47 11 < .0001
Fats
(oil, butter, and margarine)
19,635 47.52 0.49 48.40 0.45 51.31 0.44 55.35 0.44 16 < .0001 Fatty sweets
(including cake, chocolate, ice cream, and pancakes)
19,000 29.06 0.41 30.56 0.37 31.88 0.36 34.72 0.36 19 < .0001 Non-fatty sweets
(including honey, jelly, sugar, and candy)
18,336 52.19 0.49 53.12 0.45 55.05 0.44 58.63 0.44 12 < .0001
Fast food 14,224 32.28 0.49 33.67 0.44 34.09 0.42 37.94 0.42 18 < .0001
Snacks
(including chips and salted biscuits)
12,183 41.84 0.57 41.64 0.50 43.74 0.49 47.81 0.47 14 < .0001
Dressings and sauces 15,099 38.79 0.54 40.06 0.49 41.64 0.48 46.18 0.47 19 < .0001
Dairy products and meat substitutes (including soya-based products)
9758 77.45 0.66 77.87 0.60 79.00 0.56 82.39 0.53 6 < .0001
Non-alcoholic beverages 18,487 17.74 0.29 19.21 0.26 19.53 0.26 21.40 0.25 21 < .0001
Alcoholic beverages 14,908 28.41 0.42 28.54 0.38 28.80 0.37 31.20 0.37 10 < .0001
SE standard error
a
adjustedp-value for trend (correction for multiple testing with a Hochberg procedure)
b
adjusted for age, gender, education level, occupational status, monthly income per household unit, place of residence, BMI, energy intake, mPNNS-GS (modified Programme National Nutrition Santé Guideline Score), and total food intake of the food group considered in the model
items of the questionnaire, participants with more sus-tainable food concerns could be more likely to complete it compared to other participants of the cohort. Finally, a high proportion of women and of individuals with a high level of education was included in our analysis, whom have been shown to have greater sustainable con-sumption [41, 42].
A selection bias could be present because of the method used to recruit participants, which is based on volunteering. The NutriNet-Santé being a cohort focus-ing on nutrition, its participants are more likely to be in-terested in nutrition-related issues. Consequently, our subjects may have high health awareness, and a high interest toward organic food and sustainability issues compared to the general population; meaning that per-centages of organic food consumers were probably not representative of the general population. Another limita-tion of this study is its design, which is a cross-seclimita-tional analysis within a cohort, and thus does not allow us to assess causality. Moreover, all collected data were self-reported which could have led to measurement errors. The CFC questionnaire has been widely used with health and environmental outcomes. Recent studies reported a two-factor structure of the CFC, distinguishing immedi-ate and future subscales [43]. Even though there is no consensus on the use of the CFC [44], a two-dimension analysis could have added another perspective in our in-terpretation of the results.
Conclusions
This study showed that consideration of future conse-quences could be considered as a construct associated with consumption of organic food. For the majority of the assessed food groups, participants with the highest future orientation were more often consumers of organic foods, and when consuming these foods consumed a higher quantity of them. More generally, time perspective could be a personality trait predicting environmental and health concerns, and could be a key psychological factor influen-cing dietary behaviors and in particular organic food in-take. These findings could explain the cognitive process underlying organic food choices and show the importance to take individual’s psychological factors into account re-garding overall food choices. Promoting the importance of future outcomes and long-term benefits could represent an approach of public health programs aiming at encour-aging intake of organic food or more generally health pro-motion and chronic disease prevention.
Additional file
Additional file 1: Participant flow chart from the NutriNet-Santé cohort study (2014) included in the current analysis. (DOCX 48 kb)
Abbreviations
CFC:Consideration of future consequences; CNIL: Commission Nationale Informatique et Libertés; CU: Consumption unit; IRB: International Research Board of the French Institute for Health and Medical Research; mPNNS-GS: Modified Programme National Nutrition Santé Guidelines Score; Org-FFQ: Organic food frequency questionnaire
Acknowledgements
We thank Younes Esseddik, Thi Duong Van, Frédéric Coffinieres, Mac Rakotondrazafy, Régis Gatibelza and Paul Flanzy (computer scientists); and Nathalie Arnault, Véronique Gourlet, Dr. Fabien Szabo, Julien Allegre, Anouar Nechba and Laurent Bourhis (data-manager/biostatisticians) for their technical contribution to the NutriNet-Santé study. We thank all the volunteers of the NutriNet-Santé cohort.
Availability of data and materials
In France, there is a very strict regulation concerning the protection of personal data and privacy making difficult the availability of raw data (even non-nominal data). The data may be subject to collaborations with other research team, in that case, please contact the authors.
Sources of support
This study was supported by the BioNutriNet project. The BioNutriNet-Santé project is a research supported by the French National Research Agency (ANR) in the context of the 2013 Programme de Recherche Systèmes Alimentaires Durables (ANR-13-ALID-0001). The NutriNet-Santé Study is supported by the French Ministry of Health (DGS), the Santé Publique France agency, the French National Institute for Health and Medical Research (INSERM), the French National Institute for Agricultural Research (INRA), the National Conservatory for Arts and Crafts (CNAM), the Medical Research Foundation (FRM), and the University of Paris 13.
This research was part of the FOODPOL project, which was supported by the French National Institute for Agricultural Research (Institut National de la Recherche Agronomique) in the context of the 2013–2017 Metaprogramme “Diet impacts and determinants: Interactions and Transitions”.
Authors’ contributions
MB conducted the literature review and drafted the manuscript. MB performed analyses. MB, JB, CM, DL, KVG, FE, GR, SH, EK-G, and SP were involved in interpreting results and critically reviewed the manuscript. CM, SH, EK-G, and SP were responsible for developing the design and protocol of the study. MB, JB, CM, DL, KVG, FE, GR, SH. All authors read and approved the final manuscript.
Ethics approval and consent to participate
This study was conducted in accordance with the guidelines of the Declaration of Helsinki, and all procedures were approved by the International Research Board of the French Institute for Health and Medical Research (IRB Inserm n° 0000388FWA00005831) and the Commission Nationale Informatique et Libertés (CNIL n° 908450 and n° 909216). Electronic informed consent was obtained from all participants.
Consent for publication Not applicable. Competing interests
The authors declare that they have no competing interests.
Publisher’s Note
Springer Nature remains neutral with regard to jurisdictional claims in published maps and institutional affiliations.
Author details
1
Equipe de Recherche en Epidémiologie Nutritionnelle, Centre de Recherche en Epidémiologie et Statistique Sorbonne Paris Cité, INSERM U1153, INRA U1125, Cnam, Université Paris 13, 74, rue Marcel Cachin, 93017 Bobigny, France.2INRA, UMR1110 MOISA, F-34000 Montpellier, France.3Aix Marseille
Université, Nutrition Obésité et Risque Thrombotique (NORT), INSERM UMR S 1062, INRA 1260, Marseille, France.4Paris School of Economics and INRA,
UMR1393 PjSE, 48 Boulevard Jourdan, 75014 Paris, France.5Service
Bobigny, France.6Unité de Surveillance en Epidémiologie Nutritionnelle,
Institut de Veille Sanitaire, Université Paris 13, Bobigny, France.7Département
de Santé Publique, Hôpital Avicenne, Bobigny, France. Received: 19 June 2017 Accepted: 19 December 2017
References
1. Willer H, Schaack D, Lernoud J. Organic Farming and Market Development in Europe and the European Union. World Org Agric-Stat Emerg Trends 2017 [Internet]. FiBL and IFOAM-Organics International; 2017. p. 206–243. Available from: http://orgprints.org/31187/. Accessed 8 Mar 2017. 2. Brown E, Dury S, Holdsworth M. Motivations of consumers that use local,
organic fruit and vegetable box schemes in Central England and southern France. Appetite. 2009;53:183–8.
3. Honkanen P, Verplanken B, Olsen SO. Ethical values and motives driving organic food choice. J Consum Behav. 2006;5:420–30.
4. Lea E, Worsley T. Australians’ organic food beliefs, demographics and values. Br Food J. 2005;107:855–69.
5. Oates L, Cohen M, Braun L. Characteristics and consumption patterns of Australian organic consumers. J Sci Food Agric. 2012;92:2782–7. 6. Pino G, Peluso AM, Guido G. Determinants of regular and occasional
consumers’ intentions to buy organic food. J Consum Aff. 2012;46:157–69. 7. Torjusen H, Lieblein G, Wandel M, Francis CA. Food system orientation and
quality perception among consumers and producers of organic food in Hedmark County, Norway. Food Qual Prefer. 2001;12:207–16. 8. de Magistris T, Gracia A. The decision to buy organic food products in
southern Italy. Br Food J. 2008;110:929–47.
9. Schifferstein HN, Ophuis PAO. Health-related determinants of organic food consumption in the Netherlands. Food Qual Prefer. 1998;9:119–33. 10. Strathman A, Gleicher F, Boninger DS, Edwards CS. The consideration of
future consequences: weighing immediate and distant outcomes of behavior. J Pers Soc Psychol. 1994;66:742–52.
11. Ouellette JA, Hessling R, Gibbons FX, Reis-Bergan M, Gerrard M. Using images to increase exercise behavior: prototypes versus possible selves. Personal Soc Psychol Bull. 2005;31:610–20.
12. Adams J, Nettle D. Time perspective, personality and smoking, body mass, and physical activity: an empirical study. Br J Health Psychol. 2009;14:83–105. 13. Joireman J, Shaffer MJ, Balliet D, Strathman A. Promotion orientation explains
why future-oriented people exercise and eat healthy evidence from the two-factor consideration of future consequences-14 scale. Personal Soc Psychol Bull. 2012;38:1272–87.
14. Orbell S, Perugini M, Rakow T. Individual differences in sensitivity to health communications: consideration of future consequences. Health Psychol. 2004;23:388.
15. Crockett RA, Weinman J, Hankins M, Marteau T. Time orientation and health-related behaviour: measurement in general population samples. Psychol Health. 2009;24:333–50.
16. Milfont TL, Wilson J, Diniz P. Time perspective and environmental engagement: a meta-analysis. Int J Psychol. 2012;47:325–34.
17. Milfont TL, Gouveia VV. Time perspective and values: an exploratory study of their relations to environmental attitudes. J Environ Psychol. 2006;26:72–82. 18. Ebreo A, Vining J. How similar are recycling and waste reduction? Future
orientation and reasons for reducing waste as predictors of self-reported behavior. Environ Behav. 2001;33:424–48.
19. Corral-Verdugo V, Fraijo-Sing B, Pinheiro JQ. Sustainable behavior and time perspective: present, past, and future orientations and their relationship with water conservation behavior. Int J Psychol. 2006;40:139–47. 20. De Marchi E, Caputo V, Nayga RM, Banterle A. Time preferences and food
choices: evidence from a choice experiment. Food Policy. 2016;62:99–109. 21. Hercberg S, Castetbon K, Czernichow S, Malon A, Mejean C, Kesse E, et al.
The Nutrinet-Santé study: a web-based prospective study on the relationship between nutrition and health and determinants of dietary patterns and nutritional status. BMC Public Health. 2010;10:242. 22. Demarque C, Apostolidis T, Chagnard A, Dany L. Adaptation et validation
française de l’échelle de perspective temporelle «Consideration of future consequences»(CFC). Bull Psychol. 2010;5:351–60.
23. Kesse-Guyot E, Castetbon K, Touvier M, Hercberg S, Galan P. Relative validity and reproducibility of a food frequency questionnaire designed for French adults. Ann Nutr Metab. 2010;57:153–62.
24. Baudry J, Méjean C, Allès B, Péneau S, Touvier M, Hercberg S, et al. Contribution of organic food to the diet in a large sample of French adults (the NutriNet-Santé cohort study). Nutrients. 2015;7:8615–32.
25. Nutrinet-Santé E. Table de composition des aliments de l’étude Nutrinet-Santé (Nutrinet-Nutrinet-Santé Study Food Composition Database). Economica. 2013. https://www.economica.fr/livre-table-de-composition-des-aliments-etude-nutrinet-sante,fr,4,9782717865370.cfm.
26. Schofield WN. Predicting basal metabolic rate, new standards and review of previous work. Hum Nutr Clin Nutr. 1984;39:5–41.
27. INSEE (Institut national de la statistique et des études économiques) [National Institute of Statistics and Economic Studies]. Unités de consommation [consumption units] [Internet]. Available from: http://www.insee.fr/en/ methodes/default.asp?page=definitions/unite-consommation.htm. Accessed 8 Mar 2017.
28. Estaquio C, Kesse-Guyot E, Deschamps V, Bertrais S, Dauchet L, Galan P, et al. Adherence to the French Programme National Nutrition Sante Guideline Score is associated with better nutrient intake and nutritional status. J Am Diet Assoc. 2009;109:1031–41.
29. Adams J, White M. Time perspective in socioeconomic inequalities in smoking and body mass index. Health Psychol. 2009;28:83–90.
30. Van Buuren S. Multiple imputation of discrete and continuous data by fully conditional specification. Stat Methods Med Res. 2007;16:219–42. 31. Peters BR, Joireman J, Ridgway RL. Individual differences in the
consideration of future consequences scale correlate with sleep habits, sleep quality, and GPA in university students. Psychol Rep. 2005;96:817–24. 32. Baudry J, Péneau S, Allès B, Touvier M, Hercberg S, Galan P, et al. Food
choice motives when purchasing in organic and conventional consumer clusters: focus on sustainable concerns (the NutriNet-Santé cohort study). Nutrients. 2017;9:88.
33. Michaelidou N, Hassan LM. The role of health consciousness, food safety concern and ethical identity on attitudes and intentions towards organic food. Int J Consum Stud. 2008;32:163–70.
34. McEachern M, Seaman C, Padel S, Foster C. Exploring the gap between attitudes and behaviour: understanding why consumers buy or do not buy organic food. Br Food J. 2005;107:606–25.
35. Hughner RS, McDonagh P, Prothero A, Shultz CJ, Stanton J. Who are organic food consumers? A compilation and review of why people purchase organic food. J Consum Behav. 2007;6:94–110.
36. Hamm U, Gronefeld F, others. The European market for organic food: revised and updated analysis. Eur Mark Org Food Revis Updat Anal [Internet]. 2004; Available from: https://www.cabdirect.org/cabdirect/ abstract/20043156600. Accessed 27 Mar 2017.
37. Marian L, Chrysochou P, Krystallis A, Thøgersen J. The role of price as a product attribute in the organic food context: an exploration based on actual purchase data. Food Qual Prefer. 2014;37:52–60.
38. Buder F, Feldmann C, Hamm U. Why regular buyers of organic food still buy many conventional products: product-specific purchase barriers for organic food consumers. Br Food J. 2014;116:390–404.
39. Baudry J, Touvier M, Allès B, Péneau S, Méjean C, Galan P, et al. Typology of eaters based on conventional and organic food consumption: results from the NutriNet-Santé cohort study. Br J Nutr. 2016;116:700–9.
40. European Food Safety Authority. The 2014 European Union report on pesticide residues in food. EFSA J. 2016;14:n/a-n/a.
41. Panzone L, Hilton D, Sale L, Cohen D. Socio-demographics, implicit attitudes, explicit attitudes, and sustainable consumption in supermarket shopping. J Econ Psychol. 2016;55:77–95.
42. Gilg A, Barr S, Ford N. Green consumption or sustainable lifestyles? Identifying the sustainable consumer. Futures. 2005;37:481–504. 43. Joireman J, Balliet D, Sprott D, Spangenberg E, Schultz J. Consideration of
future consequences, ego-depletion, and self-control: support for distinguishing between CFC-immediate and CFC-future sub-scales. Personal Individ Differ. 2008;45:15–21.
44. Joireman J, King S. Individual differences in the consideration of future and (more) immediate consequences: a review and directions for future research. Soc Personal Psychol Compass. 2016;10:313–26.