HAL Id: hal-00434425
https://hal.archives-ouvertes.fr/hal-00434425
Submitted on 11 Feb 2010
HAL is a multi-disciplinary open access
archive for the deposit and dissemination of sci-entific research documents, whether they are pub-lished or not. The documents may come from teaching and research institutions in France or abroad, or from public or private research centers.
L’archive ouverte pluridisciplinaire HAL, est destinée au dépôt et à la diffusion de documents scientifiques de niveau recherche, publiés ou non, émanant des établissements d’enseignement et de recherche français ou étrangers, des laboratoires publics ou privés.
Optical absorption in ZrO2–x-C nanocomposite films on
polymer substrates: application of an effective medium
theory
Pierre Cheyssac, N. Laidani, M. Anderle
To cite this version:
Pierre Cheyssac, N. Laidani, M. Anderle. Optical absorption in ZrO2–x-C nanocomposite films on polymer substrates: application of an effective medium theory. physica status solidi (c), Wiley, 2008, 5 (10), pp.3376-3382. �10.1002/pssc.200778899�. �hal-00434425�
Optical absorption in ZrO
2-x-C nanocomposite films on polymer substrates :
application of an effective medium theory
P. Cheyssac1, N. Laidani2∗∗∗∗, M. Anderle2,
1
Laboratoire de Physique de la Matière Condensée, UMR 6622 CNRS, Faculté des Sciences, Parc Valrose, 06108 Nice Cedex 2 (France);
2
Fondazione Bruno Kessler – Istituto per la Ricerca Scientifica e Tecnologica, Via Sommarive 18, 38050 Povo (Trento), Italy.
PACS: 78.20.-e, 78.20.Ci, 78.30.Ly, 78.66.Sq
Films consisting of amorphous carbon dispersed in tetragonal nanocrystalline zirconia were characterized for their optical properties by reflectance measurements. The optical constants of each component of the composite have been extracted; the experimental reflectance spectra have been fitted to Maxwell-Garnett effective medium theory, leading to the effective dielectric constants of the film. Absorption is characterized by the band gap, the energy and lifetime of the optical transition of the absorbing carbon phase. These parameters are deduced from the imaginary part of the dielectric function using Tauc-Lorentz model (TL) and from the extinction coefficient using Forouhi-Bloomer model (FB) in which an energy dependence of the matrix element of the transition has been introduced. Furthermore, the energies of the peak transition and the maximum of the extinction coefficient are so similar that they prove the self-consistency of the modified-FB model applied to the amorphous carbon phase of the composite films.
∗
Corresponding author: E-mail: laidani@itc.it, Phone: +39-0461 314453, Fax: +39-0461 810851
1- Introduction
Transparent conductive oxides have received considerable attention since the increasing demand for materials of low electrical resistance and high transparency in the UV-visible-near IR range. Few
studies concern the potentiality of ZrO2 - based materials as conductor oxydes; they deal essentially
with doping [1-3]. On another hand, carbon has been widely used as additive in insulator matrices in order to increase the conductivity of the composite via percolation or percolation-tunneling
mechanisms [4-7]. In this work, the optical properties of composite films of ZrO2-x and carbon
deposited onto polycarbonate substrates, have been determined by means of reflectance measurements over the visible range. Parametrization models for optical absorption in semi-conductors, such as Tauc-Lorentz's (TL) [8] and Forouhi-Bloomer's (FB) [9] were applied to the optical constants of the carbon phase. Validity of the models is checked, introducing a figure-of-merit based on equalities of peak transition and maximum absorption energies derived from the models. The electron transitions in the transparent matrix are described by the loss features which accompany the core level spectra measured by x-ray photoelectron spectroscopy (XPS).
2- Experimental
Zirconia–carbon films are deposited on polycarbonate (PC) substrates by a r. f. sputtering of two
power chamber and a 0.5 Pa argon pressure. The samples are mounted on a rotating holder, without any external heating.
The film thickness is measured with a stylus Dektak profilometer.
XPS is performed with a Scienta ESCA 200 spectrometer, with monochromatized AlKα ray. C1s, Zr3d and O1s core level peaks and the valence band are measured on the film surface. A Shirley background subtraction is applied to the spectra. Scienta sensitivity factors is used for element quantification. The electron energy losses (EEL) associated with the excitation of the Zr3d and O1s core levels have been also studied in order to determine the electronic properties of zirconia : band gap, optical transitions and plasmons of zirconia.
Optical reflectance at normal incidence is measured with a Jasco V-550 spectrophotometer, provided with a Czerny-Turner single monochromator and a photomultiplier, in the 400-800 nm range.
3- Results and discussion
3.1- Description of the film composition and fill factor determination:
Earlier XPS and x-ray diffraction [10] analyses of films deposited with similar plasma conditions as the present ones have led to chemical and structural characterization. The C1s spectrum
lineshape and energy (284.5 eV) corresponded to amorphous carbon, essentially in sp2
hybridisation state (i. e. graphite-like). X-ray diffraction patterns were typical of a tetragonal phase with grain size 46 nm. Current films contain 10 at.% of carbon and a O/Zr atomic ratio of 1.44, so
they will be referred to as ZrO2-x -C.
The mass density of zirconia matrix and carbon phase were taken respectively as 5.76 g/cm3 [11]
and 1.9 g/cm3 [12]. The volume fraction or filling factor of carbon in the composite structure is then
deduced to be 0.09.
3.2- Optical transitions of zirconia matrix from EEL spectra:
The upper valence band (VB) of zirconia consists of filled O 2p states. The Zr4+ ion has empty 4d
states and, higher up, empty 5s states. The lower VB consists of Zr 4p states and in between lies O 2s ones. Fig. 1(a) shows a typical VB spectrum of our films. An electric charge appears on the surface of the film during measurements and causes a shift of the spectrum towards higher binding
energy. Taking the Fermi level as oririgin, a correction was introduced with reference to Zr 3d5/2
binding energy set at 181.8 eV [10]. Extrapolating linearly to zero the highest part of the spectrum due to the O2p band yields a VB maximum at 2.3 eV.
Zirconia is a material with a wide band gap located in the UV. The EEL occur in inelastic processes of band-to-band excitations and plasmons; X-rays measurements of EEL lead to the gap of such dielectrics. In zirconia, some interband transitions with single electron occur at energies lower than collective ones (plasma oscillations). Bulk plasmon excitation occurs at ∼26 eV [13] although they can also be observed at ∼14 eV, [14, 15]. Loss features due to interband transitions below the plasmon energy are mainly due to: i) O 2p – Zr 4d, at 6-8 eV according to [16], and at 7-11 eV [14]; ii) O 2p – Zr 5s given at 9.5 eV [13], and to: iii) O 2p – O 3s at 13.5 eV [13]. These transitions are visible in the EEL spectrum associated with Zr 3d, as shown in Fig. 1(b). After background subtraction, the curve deconvolution gives three peaks: A at 9.3 eV, B at 12.9 eV and C at 15.2 eV
from the Zr 3d5/2 elastic peak. Peak A can be attributed to one of the two interband transitions that
involve Zr 4d or 5s final states. C may be due to bulk plasmon excitation while B may be assigned at either an O 2p – O 3s transition or a surface plasmon.
The band gap Eg is the onset of the O2p - Zr4d transition, i.e. the onset of the lowest excitation in an
EEL spectrum. Eg is estimated by a linear extrapolation to a minimum of intensity of the low energy
More accurately, it was also determined as the zero energy in the derivative spectra. This is shown in Fig. 2 (a-b) where both spectra are displayed.
One obtains Eg as 5.30 ± 0.3 eV and 4.97 ± 0.3 eV on the O1s and Zr3d loss spectrum respectively,
showing a good consistency between each other. They are comparable to the direct band-gap energy of ZrO2 [15 – 17].
These results confirm that for our films, although the zirconia phase is under-stoichiometric, it remains transparent in the visible. This is taken into account for the interpretation of the reflectance measurements leading to the optical constants of the composite film as discussed in the following section.
3.3- Optical constants calculations from a Maxwell-Garnett model of reflectance spectra
Optical measurements were made on a 398 nm thick ZrO2-x-C film deposited on a 1.02 mm thick
PC substrate, a structure sketched in Fig. 3(a).
Both substrate and film are transparent in the visible range of wavelengths λ. During reflectance measurements, the response of the spectrophotometer to energy reflected by the rear face of the samples has been minimized with a light absorbent deposited onto it.
Fig. 3(b) gives the experimental and calculated reflectance spectra of the composite film deposited onto PC as well as that of PC. The film spectrum shows the characteristic interference pattern of transparent layered structures, as it will be demonstrated below.
Polycarbonate exhibits a rather flat spectrum except in a close vicinity of 400 nm.
The real part νp of its index np = νp + i κp is given by
νp = a + bλ+
c
λ2 (1)
in which a = 1.532, b = 2.585 10-4 nm -1 and c = 26.750 103 nm 2. This flat spectrum is in good
agreement with already published data [18].
However, one cannot be sure that the film deposition process leaves the PC index identical to that of a bare and non-treated substrate. Actually, this has been taken into account introducing an imaginary part κp = a' +b'λ 2 + c' λ2 (2) where a' = 9.37 10-3, b' = -710-9 nm-2 and c' = 847.88 nm2
The amplitude of the electric field reflected by the sample is described according to the classical principles of propagation of electromagnetic waves, discussed by Born and Wolf [19]: namely we consider a plane and parallel layer of composite film deposited on a semi-infinite substrate of polycarbonate whose indices are given above. Since the rear face of polycarbonate is coated and absorbing, no wave is back reflected; the combination of interfaces becomes rather straightforward although complex values of indices have to be handled with care.
Let ni be the index of the i-th layer. The reflectance coefficients ρ i j of the various interfaces are
ρ
ij=
n
i− n
jn
i+ n
j(3)
with ρ12 for the vacuum-film interface, and ρ23 for film-polycarbonate interface. Then, the
theoretical expression of Fresnel reflectance is R Fresnel = ρρ* with
ρ
=
ρ
12+
ρ
23e
2 ik2d2
1 +
ρ
12ρ
23e
2 ik2d2 (4)
where ki is the wave vector and d2 the thickness of the composite layer [20].
The effective dielectric constant of the composite film, ε, can be found applying Maxwell-Garnett equation [21]
A q A q m m ε ε ε ε 3 1 3 1 + − + − = (5)
where q is the volume fraction occupied by carbon and ε its dielectric constant. εm stands for the
matrix constant i.e. zirconia, and A = q/ ε + 2 εm .
The effective refractive index of the film n = √ε is the unknown parameter to be determined by
fitting the experimental reflectance spectrum. The fit is based on calculating RFresnel as above, by (i)
introducing εp, ε and εm for polycarbonate, C and zirconia phases of the film respectively, (ii)
calculating ε using Maxwell-Garnett model and (iii) applying equation (4) to calculate the reflectance coefficient and its conjugate, both entering in the reflectance determination.
Inputs in the calculations are indices of polycarbonate given above, optical indices n = ν + i κ of
carbon and nm = νm + i κm of zirconia, and the measured film thickness d2 = 398 nm.
As starting point of the calculations, the indices of diamond and zirconia replace those of the carbon and zirconia phases of the composite film.
The real part ν of the index is described by a dispersion relation such as
ν2 = a + bλ 2 λ2 − d + c λ2 λ2 − e (6)
in which the coefficients are given below for λ expressed in nm [22], corresponding units being not written.
For diamond : a = 2.309828, b = 3.356515, c = 17300, d = 3.356515 and e = 2.5 109 .
For zirconia: a = 2.051223, b = 2.414018, c = 26482.75, d = 11.25 and e = 7x10⁸
Moreover, evaporated or sputtered carbons are known to be absorbing; such absorption has been taken into account introducing an imaginary part in its index
κ= a'c+
b'c
λ (7)
where a'c = -0.169 and b'c = 143.8. Let us remind that zirconia remains without absorption.
The calculated reflectance is fitted to the experimental spectrum by a least square procedure. As a
result, the best fit is obtained with the following coefficients: the calculated thickness d2 = 405 nm,
is very close to the measured one; for carbon, b = 2.084 and c = 9400 alone are modified. For
zirconia, a = 1.920, b = 2.360, c = 20982, d = 11.25 and e = 8x10⁸.
As it can be seen in Fig.3 (b), the fit can be considered as satisfying over most of the energy range. The optical properties of carbon in the visible range are then described by the real and imaginary
parts of either its index n = ν + i κor its dielectric function ε = ε1 + i ε2 which realize the best fit to
the experimental reflectance spectrum. The same can be said for zirconia: nm = νm + i κm and εm =
εm1 + i εm2 .
The obtained optical constants are displayed in Fig. 4 (a-b). They were used to study the absorption properties, i.e. electronic transition parameters of the carbon phase of the film.
3.4- Transition lifetime τ, energy gap Eg and peak transition energy E0 deduced from optical
measurements
Several models have been developed and describe the electronic transition parameters such as the
band gap, the peak transition energy E0 and the transition lifetime. Models from Tauc-Lorentz (TL)
[8] and Forouhi-Bloomer (FB) [9] are widely used. In this work, they have been applied to the
optical constants of the carbon phase of the composite film. In Tauc-Lorentz model ε2 (E) is given
as ε2(E) = 1 E AE0Γ(E − Eg) 2 (E2 − E0 2 )2 + Γ2E2
[
]
for E > Eg (8)and ε2( E ) = 0 for E ≤ Eg. (9)
where A is the amplitude factor and Γ the broadening parameter.
In FB formalism as in TL’s, τ, Eg and E0 can be derived. This is achieved by fitting κ(E) as
follows
κ(E) = A' (E − Eg)
2
E2
− BE + C (10)
where A’ is proportional to the matrix element of the dipolar transition, B = 2 ( Ef − Ei) and C =
(Ef -Ei)2 - 2/ 4τ2 . Subscripts i and f refer to initial and final state respectively. Hence (Ef -Ei) = B/2
corresponds to the peak transition energy (as in the case of E0 in the TL model ). Contrasting with
Tauc-Lorentz model, FB ones considers that the square of the dipolar matrix element is a constant. In the case of dispersed carbon in our composite film, the validity of the model is checked by introducing a figure-of-merit based on equalities of peak transition and maximum absorption
energies derived from the models. ε2(E) and κ(E) were fitted to TL and FB models through
numerical simulations and are shown in Fig.5 (a) and ( b) respectively.
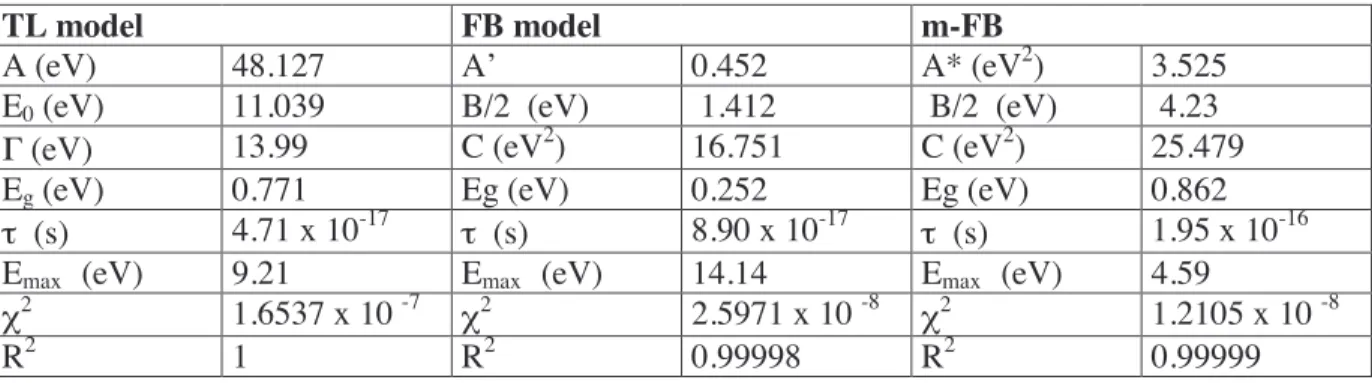
From the fit parameters, we derived the transition lifetime τ and the peak transition energy (B/2 for
FB fit, E0 for TL fit). All these values are summarised in Table 1.
3.5- Modification of FB model:
Results of TL and FB models given above yield lifetimes of the same order, though giving different energy gap values. Both models use different assumptions about the energy dependence of the matrix element of the transition (momentum versus dipole taken as a constant matrix element); as a
consequence, this may explain the great difference between E0 given by TL and B/2 given by FB.
Furthermore, the values within both models are unrealistic, too high for TL and too low for FB. The optical properties of the amorphous C films are known to be dominated by the π−π* and σ−σ* electron transitions, along with the π−σ∗ and σ−π∗ transitions [23, 24]. The π−π* contribution
originates exclusively from sp2 carbon. The σ−σ * transitions occurs at ~14 eV in graphite and at
~11 eV in diamond, while the π−π* transition is located at ~ 4 eV. All these values of energy correspond to the maximum absorption for a specific interband transition. Consequently, no transition other than the π−π* can contribute to optical absorption in the visible range.
Further, the self-consistency of the simulation data for a given model should be checked within the
frame of its own formulation. If Emax is the energy of maximum absorption (maximum κ for FB and
maximum ε2 for TL) according to the model formulation, it should be very close to E0 for TL and
B/2 for FB as they have the same physical significance. It is clear from Table 1 that this self-consistency is not verified for any model when applied to the present films. The discrepancy between the two parameters from FB formulation is the largest. In order to make FB model
applicable to our films, an energy dependence in the squared matrix element R2(E) of the transition
dipole has been introduced in it. This energy dependence R2(E) ∝ E-2 is then introduced in κ(E) as
follows: κ( E ) = 1 E2 A* ( E − Eg) 2 E2 − BE + C (11)
Our choice of this dependence of R2(E) is based on earlier indications of a E-2 energy scaling of
matrix elementsin disordered materials [25].
The best fit of κ(E) with this formulation is shown in Fig. 5 (c), fit values being given in Table 1.
The figure-of-merit B/2 = Emax is now fairly achieved. Furthermore, the energy gap Eg from our
the original FB. However, the modified FB model appears superior to TL in that it gives a much more realistic peak transition energy (4.23 versus 11.04 eV).
4- Conclusion
Fitting the experimental reflectance spectra to a Maxwell-Garnett effective medium theory leads to the optical constants of each component of the composite film as well as its effective dielectric constants. The parameters of absorption of the carbon phase i.e. band gap energy, peak transition energy and lifetime of optical transition could thus be determined using Tauc-Lorentz (TL) and Forouhi-Bloomer (FB) models. The latter have been applied to the optical constants, with the introduction of a figure-of-merit based on equalities of peak transition and maximum absorption energies derived from the models. The results show the adequacy of FB model to describe the interband transitions of the amorphous carbon phase of the composite films, provided an energy dependence of the dipole matrix element of the transition is introduced. Band-gap energy and electron transitions in the transparent zirconia phase of the films were determined by examining the energy loss features along the excitation of O1s and Zr3d core levels..
Acknowledgments
This work was supported by Autonomous Province of Trento (Fondo Progetti Ricerca) under MicroCombi project.
References
[1] M. Hirano, S. Watanabe, E. Kato, Y. Mizutami, M. Kawai, Y. Nakamura, Solid State Ionics 111 (1998) 161
[2] M. Zevin, R. Reisfeld, Opt. Mater. 8 (1997) 37 [3] X. Guo, R. Waser, Progr. Mater. Sci. 51 (2006) 151 [4] I. Balberg, Carbon 40 (2002) 139
[5] D. Fink, R. Klett, L. T. Chadderton, J. Cardoso, R. Montiel, H. Vazquez, A. A. Karanovich, Nucl. Intr. Meth. B 111 (1996) 303
[6] R. Dominko, M. Gaberscek, J. Drofenik, M. Bele, J. Jamnik, Electrochim. Acta, 48 (2003) 3709 [7] S.-L. Shi, J. Liang, J. Appl. Phys. 101 (2) (2007) 023708
[8] G. E. Jellison, Jr and F. A. Modine, Appl. Phys. Lett. 69 (3) (1996) 371 [9] A. R. Forouhi and I. Bloomer, Phys. Rev. B 34 (10) (1986) 7018 [10] N. Laidani, V. Micheli, M. Anderle, Thin Solid Films 382 (2001) 23 [11] H. Holleck, J. Vac. Sci. Technol. A, 4 (6) (1986) 2661
[12] L. Calliari, M. Filippi, N. Laidani, M. Anderle, J. Electron Spectrosc. 150 ( 2006) 40
[13] G. R. Corallo, D. A. Asbury, R. E. Gilbert, G. B. Hoflund, Phys. Rev. B 35 (18) (1987) 9451 [14] F. Yubero, J. P. Espinòs, A. R. Gonzàlez-Elipe, J. Vac. Sci. Technol. A 16 (4) (1998) 2287 [15] D. W. McComb, Phys. Rev. B 54 (10) (1996) 7094
[16] R. H. French, S. J. Glass, F. S. Ohuchi, Y.-N Xu, W. Y. Ching, Phys. Rev. B 49 (8) (1994) 5133
[17] H. Nohira, W. Tsai, W. Besling, E. Young, J. Petry, T. Coanrd, W. Vandervorst, S. De Gendt, M. Heyns, J. Maes, M. Tuominen, J. Non-Cryst. Solids 303 (2002) 83
[18] Y. Wang, Y. Abe, Y. Matsuura, M. Miyagi, and H. Uyama, Appl. Opt. 37 (1998) 7091
[19] M. Born, E. Wolf, " Principles of Optics", ( 7 th ed., Cambridge University Press, Cambridge,
MA, 1999)
[20] P. Cheyssac, Opt. Commun. 268 (2006) 273
[21] J. C. Maxwell-Garnett, Phil. Trans. Roy. Soc. 205 (1906) 237; J. C. Maxwell-Garnett, Phil. Trans. Roy. Soc. 203 (1904) 385
(Academic Press, 1998) pp. 5-110
[23] J. Daniels, C. V. Festenberg, H. Raether and K. Zeppenfeld, “Optical Constants of Solids by Electron Spectroscopy”, Springer Tracts in Modern Physics, Vol. 54 (G. Hohler, ed., Springer-Verlag Berlin, 1970), pp. 77-135
[24] S. Logothetidis, Diam. Relat. Mater. 12 (2003) 141
[25] G. A. N. Connel, “Optical properties in amorphous semiconductors”, Springer Topics in Applied Physics, Amorphous Semiconductors, vol 36 (Ed. M. H. Brosky, Berlin: Springer, 1979) pp 73-111.
Table 1: Fit parameters of Tauc-Lorentz (TL) and both un-modified (FB) and modified Forouhi and
Bloomer (m-FB) models for, respectively, ε2 (E) and κ(E) constants of the C phase of the films.
TL model FB model m-FB
A (eV) 48.127 A’ 0.452 A* (eV2) 3.525
E0 (eV) 11.039 B/2 (eV) 1.412 B/2 (eV) 4.23
Γ (eV) 13.99 C (eV2) 16.751 C (eV2) 25.479
Eg (eV) 0.771 Eg (eV) 0.252 Eg (eV) 0.862
τ (s) 4.71 x 10⁻¹⁷ τ (s) 8.90 x 10⁻¹⁷ τ (s) 1.95 x 10⁻¹⁶
Emax (eV) 9.21 Emax (eV) 14.14 Emax (eV) 4.59
χ2 1.6537 x 10 -7 χ2 2.5971 x 10 -8 χ2 1.2105 x 10 -8
Figure captions
Figure 1: XPS spectra of
(a) valence band
(b) loss spectrum associated with Zr3d core level spectrum, with curve fitting.
Figure 2: Basic principle of band-gap determination shown on (a) O1s and (b) Zr3d XP spectra and their derivatives. This energy corresponds to the onset of the electron transition excitations, evidenced on the derivative spectra.
Figure 3: (a) Schematic multilayered structure of the film / PC system (numbers indicate the i-th layers).
(b) measured reflectance of a bare PC (curve 1, continuous line) and of ZrO2-x-C film on
PC (curve 2), calculated reflectance of PC (curve 3, full symbols) and of ZrO2-x-C film
on PC (curve 4).
Figure 4: (a) Real part of dielectric constant of the carbon phase ε1, the matrix εm1 and the
composite ε1 and imaginary part of dielectric constant of the composite ε2,
(b) Real part of the index of the carbon phase, ν, and the matrix, νm and imaginary part
κ of the index of the carbon phase, versus photon energy E for ZrO2-x-C film.
Figure 5: (a) ε2(E) fitted to TL model
(b) κ(E) fitted to FB model
(c) κ(E) fitted to modified FB model
50
40
30
20
10
0
-10
0
2000
4000
6000
8000
(a)
2.3 eV O 2p O 2s Zr 4p VBM Fermi levelC
o
u
n
ts
Binding energy (eV)
4
6
8
10
12
14
16
18
20
0,0
0,5
1,0
1,5
2,0
2,5
3,0
(b)
C B AC
o
u
n
ts
N
(E
)
Electron energy loss (eV)
Figure 1
10
20
30
40
50
-15 -10 -5 0 5 10 15 20(b)
Zr 3d3/2 Zr 3d5/2N
(E
)
Eg = 4.97 eVd
N
(E
)/
d
E
Electron energy loss (eV)
-10
-5
0
5
10
15
20
25
-15
-10
-5
0
5
10
15
20
Eg = 5.30 eV d N (E ) / d EElectron energy loss (eV)
(a)
O 1s N (E )Figure 2
400
500
600
700
800
900
0,04
0,08
0,12
0,16
0,20
(b)
(4) (3) (2) (1)R
e
fl
e
c
ta
n
c
e
λ(nm)
(a)
1 2 3 AIR FILM POLYCARBONATE AIR d3 d2 4Figure 3
1,0 1,5 2,0 2,5 3,0 3,5 4,0 2,10 2,15 2,20 2,25 2,30 2,35 2,40 2,45 νm ν κ
Photon energy (eV)
ν
ν
ν
ν
,
ν
ν
ν
ν
m 0,04 0,08 0,12 0,16 0,20(b)
κ
κ
κ
κ
1 , 0 1 , 5 2 , 0 2 , 5 3 , 0 3 , 5 4 , 0 4 , 4 4 , 5 4 , 6 4 , 7 P h o t o n e n e r g y ( e V ) D ie le c tr ic c o n s ta n ts 0 , 0 4 0 , 0 5 0 , 0 6 0 , 0 7 ( a )ε
1ε
2ε
m1ε
1Figure 4
Figure 5
1,4 1,6 1,8 2,0 2,2 2,4 2,6 2,8 3,0 3,2 0,00 0,05 0,10 0,15 0,20 0,25 κκκκ(c)
Photon energy (eV)
1,4 1,6 1,8 2,0 2,2 2,4 2,6 2,8 3,0 3,2 0,00 0,05 0,10 0,15 0,20 0,25
κ
κ
κ
κ
(b)
Photon energy (eV)
1 , 4 1 ,6 1 , 8 2 , 0 2 , 2 2 , 4 2 , 6 2 , 8 3 ,0 3 , 2 0 , 1 0 , 2 0 , 3 0 , 4 0 , 5 0 , 6 0 , 7 0 , 8 0 , 9 1 , 0 1 , 1 1 , 2