HAL Id: hal-00546799
https://hal.archives-ouvertes.fr/hal-00546799
Submitted on 14 Dec 2010
HAL is a multi-disciplinary open access
archive for the deposit and dissemination of
sci-entific research documents, whether they are
pub-lished or not. The documents may come from
teaching and research institutions in France or
abroad, or from public or private research centers.
L’archive ouverte pluridisciplinaire HAL, est
destinée au dépôt et à la diffusion de documents
scientifiques de niveau recherche, publiés ou non,
émanant des établissements d’enseignement et de
recherche français ou étrangers, des laboratoires
publics ou privés.
Calibration of topological development in the procedure
of parametric identification: application to the stochastic
GreenLab model for Pinus Sylvestris var. Mongolica
Feng Wang, Meng Zhen Kang, Hui Han, Qi Lu, Véronique Letort, Yan Guo,
P. de Reffye, Baoguo Li
To cite this version:
Feng Wang, Meng Zhen Kang, Hui Han, Qi Lu, Véronique Letort, et al.. Calibration of topological
development in the procedure of parametric identification: application to the stochastic GreenLab
model for Pinus Sylvestris var. Mongolica. 2009 Plant Growth Modeling And Applications, Nov 2009,
Beijing, China. pp.26-33. �hal-00546799�
Calibration of topological development in the procedure of parametric
identification: application to the stochastic GreenLab model for Pinus
Sylvestris var. Mongolica
Feng Wang
1Mengzhen Kang
2Hui Han
3Qi Lu
4Veronique Letort
5Yan Guo
1Philippe de Reffye
6,7Baoguo Li
1*
1
Key Laboratory of Plant-Soil Interactions, Ministry of Education, College of Resources and
Environment, China Agricultural University, Beijing 100193, China,
2
LIAMA&NLPR, Institute of Automation, Chinese Academy of Sciences, Beijing, 100080, China,
3
Liaoning Sand-Fixation and Afforestation Institute, Fuxin 123000, China,
4
Chinese Academy of Forestry, Beijing 100091, China,
5
Ecole Centrale of Paris, Laboratory of Applied mathematics, 92290 Chatenay-Malabry, France,
6
Cirad-amis, TA 40/01 Ave Agropolis, 34398 Montpellier Cedex 5, France and
7
INRIA-Rocquencourt, BP 105, 78153 Le Chesnay Cedex, France
*For correspondence. Email: libg@cau.edu.cn
Abstract
Arid climate, biophysical conditions and human activities all contribute to the occurrences of ecosystem and environment problems, i.e. water scarcity, desertification, salinization, in arid and semiarid zone of North China. Mongolian Scots pine tree (Pinus sylvestris var. mongolica) is one of the principal species of the windbreak and sand-fixing forest in this area. In this paper, we present the calibration process of stochastic GreenLab model based on experiment data. Specific plant topology and sink–source parameters were estimated for Mongolian Scots pine trees through optimizing procedure. The fitting results showed that the calibration was reasonable and acceptable. The model produces several three-dimensional visual representations of Mongolian Scots pine trees with different topological structures simulated by Monte Carlo methods. This model can be used to describe the plant development and growth in a stand level, taking into accounts the variations in plant topology and biomass.
1. Introduction
The ecosystem in the arid and semiarid region of North China is very fragile because of hostile climate and sterile soil. Moreover, human-induced vegetation destruction and soil degradation further intensify the problem. Vegetation protection and optimal water
and soil management are an important pathway to improving the function of local ecosystem services. The selection of appropriate species for restoring vegetation is a key point to preventing desertification. Mongolian Scots pine tree (Pinus sylvestris var.
mongolica) is one of the principal species of the
windbreak and sand-fixing forest in the arid and semiarid area. It possesses many desirable properties, such as trunk straightness, valuable wood material and especially high tolerance to environmental stresses (e.g. coldness, drought, infertility, salinity) [1], which make it fit to grow in sandy land. Therefore, it is widely planted in North China to combat desertification. However, some degenerating phenomena such as top withering, slow growth and stems death have occurred in the early Mongolian pine plantations since the later 1980s [2]. Model-assisted analysis on the canopy architecture development and function of Mongolian Scots pine tree are valuable for better understanding its role and behavior.
Functional-structural plant models (FSPMs) are effective tools to simulate the growth and development of plants by integrating three-dimensional (3D) plant architecture with eco-physiological processes [3]. Plant architecture in this type of models is usually represented as a collection of interconnected elementary units [4]. FSPM simulates physiological and geometrical variation of every elementary unit during plant growth and development [5]. Early FSPMs focused more on the
dynamic changes of plant function in fixed tree architecture than on architectural development, e.g., ECOPHYS [6], EMILION [7] and SIMWAL [8]. One of representative FSPMs is the LIGNUM model [9], which initially applied to Scot pines [10], then to Jack Pine [11] and Sugar Maple [12]. LIGNUM simulates the relationships between plant architecture and biomass with a time scale of one year. It integrates the pipe model theory [13] with a simplified representation of tree architecture [14]. Another FSPM appeared recently was L-PEACH [15, 16], which describes plant architecture using L-systems [17], and the assimilate movements was driven by concentration gradients across resistive pathways based on the “transport - resistance” model.
Derived from the powerful plant architecture model AMAP, GreenLab is a generic plant growth model that integrates various morphological features with biomass production and allocation at organ scale [18], called GL1. The plant architecture is built based on an automaton which is analogous to writing L-system rules, and the biomass acquisition and allocation are based on source-sink relationship. GreenLab model is able to simulate plant's phenotypic plasticity that results from feedbacks among growth (biomass acquisition), differentiation (phenology, morphogenesis) and the physiological condition of the organism (e.g. stresses) [19]. At present, GreenLab has been applied to crops, e.g., cotton [20], maize [21], wheat [22], tomato [23], and trees, e.g., Chinese pine saplings [24] and beech trees [25]. However, these calibration processes were performed with deterministic architecture that represents an average topological structure from several samples. No appropriate method was developed to include topological information in the set of target data used for the procedure of parametric identification. Moreover a deterministic topological development is not realistic with regards to the high variability of branching patterns observed in tree stands. To get realistic simulations of tree growth, it is important to consider the randomness of topological development. This motivated the development of a stochastic version of GreenLab, called GL2 [26]. Beside simulation of stochastic plant sample, the theoretical mean and variance of numbers of organs at any growth stage can be calculated.
The aim of this study is to describe the plant development and growth of Mongolian Scots pine tree, taking into account the variations in plant topology and biomass. The benefits of these mathematical properties were taken to fit the parameters driving the topological development, as
well as functional processes. We present the calibration process of GL2 based on experiment data of Mongolian Scots pine trees. The stochastic 3D plant architectures were simulated and visualized.
2. Materials and methods
2.1 Model description
GL2 model is a stochastic functional-structural model, in which bud probability is introduced in plant architecture development, including survival probabilities of buds, branching probabilities of buds, growth probability of apical buds and appearance probability of metamers. Theoretical mean and variance of organ number can be calculated in an analytical way [26]. Another component of the model is on biomass production and allocation, the same principle as in [18]. General description of this sub-model can be found in [18], [21] and [25].
Wang et al. [27] defined the topological parameters of the dual-scale automaton [28] specifically for Mongolian Scots pine tree. The plant architecture description is hierarchically organized using botanical notion of physiological age (PA) [29]. Each bud of Mongolian Scots pine tree develops to a growth unit (GU) (includes one metamer only) each year. In that case, PA is equivalent to branching order: one for trunk, two for 1st order branches, three for 2nd order branches, and four for 3rd order branches, which is the maximum PA for the Mongolian Scots pine trees in this study. The death or dormant probability of apical bud is negligible for young trees according to observation. Therefore the growth probability is set to one and death probability is set to zero. The variability of Mongolian Scots pine trees architecture is mainly represented by the number of branches at different order. Thus in following study, only the branching probability is taken into consideration.
Let pk be the probability that an axillary bud of
PA k can develop to a branch, called branching probability of PA k. Suppose that there are potentially nk axillary buds at a node. The model
assumed that buds of the same PA have the same branch probability, regardless their position inside plant structure. The number of appeared branches on a node then follows a binomial law (nk, pk), the mean
MB and standard deviation VB of branches on such a
GU is:
(1
)
B k k B k k kM
n p
V
n p
p
(1)Total number of GUs in a plant is a function of branching probability of each order. Using compound law, their mean and variance can be computed recurrently from highest PA in an analytical way:
'
'
'
p p S G B S G B G B GM
M
M
V
V M
M V M
(2) In Eqn. (2),M
S pand p SV
are mean and variance of numbers of GUs in a substructure of PA p. Whenp = 1, it is the plant structure. MG and VG are mean
vector and covariance matrix of number of branches along the axis of substructure p, their element computed from Eqn. (1). For VG, their diagonal
elements are zeros supposing the numbers of branches per node are independent. MB and VB are
mean vector and covariance matrix of number of GUs in branches along the axis. Started from the simplest branch of maximum PA, Eqn (2) gives recursively the mean and variance of number of GUs. It follows also a binomial distribution as it is a compound law of binomial ones.
Based on the mean of organ number, an average plant can be calculated using sink-source parameters as in GL1 model [18].
2.2 Model calibration
The model parameters were estimated by model inversion with an adequate set of experimental data with the simulation output. In GL2, the calibration was done in two steps. The first step is on the automaton, aiming at quantifying the branching probability for branches of each order that the organogenesis model produces the closest number of organs to the observations. In observations, the numbers of branches were counted, from which numbers of GUs were calculated. By fitting the observed and calculated number of GUs, the branching probabilities were estimated. Notice that the aim of fitting is to find bud probabilities that give closest organ number with real data, and it is not guaranteed that the probability is the same as the actual ones observed from a certain node.
The second step is to resolve sink-source parameters by fitting the organ biomass of the average plant. As number of internodes and needles (consider all needles in one metamer as whole) are equal to that of GUs, the number of sink and source organs of an average plant is known. Following the same fitting process as for GL1 [21] , the sink-source
parameters were identified. GreenScilab toolbox (http://www.scilab.org) for GL2 was used for model calibration and simulation. Based on the calibration, the architecture and biomass of Mongolian Scots pine trees was stochastically simulated with Monte Carlo methods.
2.3 Experiments
The experimental site is located at the plantations station affiliated with Liaoning Sand Fixation and Afforestation Institute (122º22’E, 42º43’N), in Zhanggutai, Liaoning of China. This region is adjacent to Kerqin sandy land, which is one of the four biggest sandy lands in China. The average annual precipitation, potential evaporation, temperature and wind speed are 505.9 mm, 1755.3 mm, 6.0°C and 4.2 m s–1 respectively. Soil type is aeolian sandy soil.
Two experiments for plant topological structure and organ biomass were carried out in November, 2006 and August, 2007. Two observations on number of branches were done in the field on 100 Mongolian Scots pine trees of 4, 5 and 6 years old. The numbers of different order branches at each node of trees were recorded. For organ biomass, samples were taken from 1, 2, 3, 5, 6-year-old young trees with four replications for each tree age. To prevent water loss during measurements, plants were dug out with roots and soil and transported to the laboratory for measurement (length, diameter and fresh biomass of every internodes and needles fresh biomass).
3. Results
3.1 Model parameters from direct observations
The 2nd order branches were not observed for 4-year-old trees. A maximum branching order of three was observed on the 6-year-old trees. The maximal numbers of branch per node was 15 for 1st order branch (n2=15), six for 2nd order branch (n2=6) and
fourfor 3rd order branch (n3=4). There is a decrease
with higher branching order.
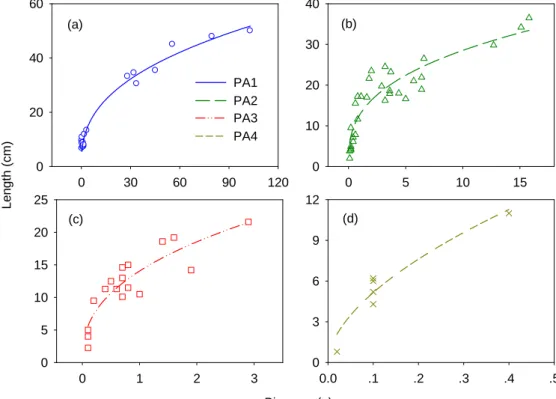
Average specific leaf weight (SLW) and internode allometry scales ratio were estimated directly from experiment data (Table 1). The high correlation coefficient showed the close relationship between internode mass and length for each order branch (Fig.1). These allometric parameters were used to calculate organ size from their biomass.
3.2 Fitting results
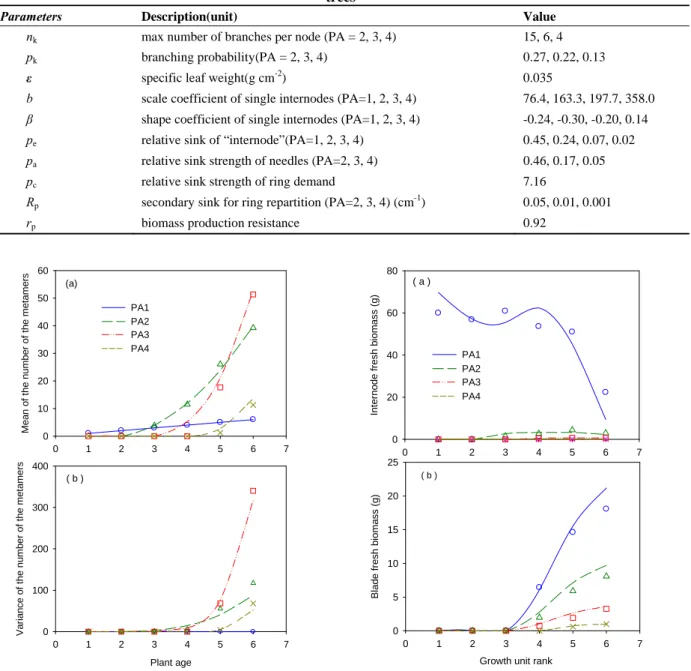
Fig. 2 shows the mean and variance of number of the GUs of trunk and branches of different order. Both the mean and variance were well fit simultaneously by the model, verifying the hypothesis that the number of GU follows a binomial distribution. Trunk grows one GU every year, thus the mean number of GUs of trunk increased linearly with tree age, and the variance is zero. The mean number of GUs in 2nd order branch (PA3) increased most rapidly with tree age, so do its variance. This is reasonable as both n2 and p2 are higher for PA 2. The
identified bud probabilities are shown in Table 1. It can be seen that they decrease with higher branching order. The average numbers of branches per node for 1st, 2nd, 3rd order branch were 3.98, 1.33 and 0.52 respectively from equation (2). Using the calibrated automaton, the next step is to calibrate the sink-source parameters by fitting biomass and size of organs.
Fig.3 shows the fitting results on fresh biomass of internodes and needles for trunk and branches of all orders in the 6-year-old Mongolian Scots pine tree. Sink-source parameters are shown in Table 1. It can be seen that the fresh biomass of trunk internode was much more than those of branches. Take a 6-year-old Mongolian Scots pine tree for example, average internode fresh biomass of PA1, PA2, PA3, PA4 were 50.7, 1.9, 0.3 and 0.04 g respectively. Actually, the sink strength of trunk internode is significantly higher than that of the branches (Table 1). Moreover, the secondary sink strength for branches are very low, which means the most of biomass for ring growth was allocated to the trunk. The fresh biomass of needles in each GU decreased also with increasing branch order, being 6.5, 2.7, 1.0, and 0.27 g from PA1 to PA 4. Naturally, the relative sink strength of branch needles are lower compared to those in trunk. It can be seen from Fig.3 (b), leaf functioning time was three years, and leaves older than 3-year-old fell down. (a) 0 30 60 90 120 0 20 40 60 (b) 0 5 10 15 0 10 20 30 40 (c) Biomass (g) 0 1 2 3 L eng th ( c m ) 0 5 10 15 20 25 (d) 0.0 .1 .2 .3 .4 .5 0 3 6 9 12 PA1 PA2 PA3 PA4
Fig. 1 The allometric relationship of GU of trunk and different order branches for Mongolian Scots pine tree (a) Trunk, y = 8.74x0.38(R2 = 0.98, n = 19, p < 0.0001); (b) 1st-order branch, y = 12.78x0.35(R2 = 0.84, n = 31, p < 0.0001); (c) PA3: 2nd-order branch, y = 14.06x0.40(R2 = 0.81, n = 17, p < 0.0001); (d) PA4: 3rd-order branch, y = 18.92x0.57(R2 = 0.84, n = 6, p = 0.0023). Measured data (symbols) and regression line (lines)
Table 1 The description and values of the main parameters used in GL2 model for Mongolian Scots pine trees
Parameters Description(unit) Value
nk max number of branches per node (PA = 2, 3, 4) 15, 6, 4
pk branching probability(PA = 2, 3, 4) 0.27, 0.22, 0.13
ε specific leaf weight(g cm-2) 0.035
b scale coefficient of single internodes (PA=1, 2, 3, 4) 76.4, 163.3, 197.7, 358.0 β shape coefficient of single internodes (PA=1, 2, 3, 4) -0.24, -0.30, -0.20, 0.14 pe relative sink of “internode”(PA=1, 2, 3, 4) 0.45, 0.24, 0.07, 0.02
pa relative sink strength of needles (PA=2, 3, 4) 0.46, 0.17, 0.05
pc relative sink strength of ring demand 7.16
Rp secondary sink for ring repartition (PA=2, 3, 4) (cm-1) 0.05, 0.01, 0.001
rp biomass production resistance 0.92
(a) 0 1 2 3 4 5 6 7 Mea n o f t he numbe r of th e metamers 0 10 20 30 40 50 60 PA1 PA2 PA3 PA4 ( b ) Plant age 0 1 2 3 4 5 6 7 Va ri an ce o f th e nu m b er of the m e ta mers 0 100 200 300 400
Fig.2 Mean and variance of number of GUs in trunk and branches of different order
PA1: Trunk; PA2: 1st-order branch; PA3: 2nd-order branch; PA4: 3rd-order branch, from measured data (symbols) and model output (lines)
( a ) 0 1 2 3 4 5 6 7 In te rn o de f resh b iom ass ( g ) 0 20 40 60 80 ( b )
Growth unit rank
0 1 2 3 4 5 6 7 Bl ad e f resh bioma ss ( g ) 0 5 10 15 20 25 PA1 PA2 PA3 PA4
Fig.3 Fitting results of single internodes and needles fresh biomass of trunk and different order branches of a 6-year-old Mongolian Scots pine tree
PA1: Trunk; PA2: 1st-order branch; PA3: 2nd-order branch; PA4: 3rd-order branch, from measured data (symbols) and
model output (lines)
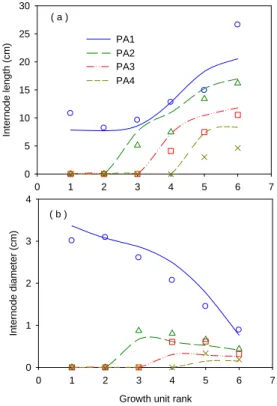
Fig.4 shows the fitting results on length and diameter of each GU in the 6-year-old Mongolian Scots pine tree. Tree height and ground diameter were 82.9 cm and 3.1 cm respectively. Good
estimation of trunk size is useful to predict precisely tree height and wood volume. Compared with the fitting on GU fresh biomass of branches as in Fig. 2(a) , that of internode length and diameter were less
good. This may be due to the ongoing growth of internodes when the measurements were done in August. This result showed that it is important to set the date of measurment for obtaining good allometric rules.
Fig. 5 shows the simulated and measured organ compartment weight and total fresh biomass. They are the sum of the weights of individual organs they are composed of. The fresh biomass of internodes compartments decreased from trunk to higher order branch. However, 1st order branch bore the highest fresh biomass of needles compartment, because of its high number of organs (Fig.1a) and relatively more biomass compared with the internodes (Fig.2). The fresh biomass of internodes and needles compartment of 3rd order branch was lowest because the number of branches was very small.
The simulations of a 6-year-old Mongolian Scots pine tree were conducted after model calibration. The visualization of five simulated Mongolian Scots pine trees with stochastic features is shown (Fig.6).
Rank vs Target_Bld_PA1 Rank vs Model_Bld_PA1 Rank vs Target_Bld_PA2 Rank vs Model_Bld_PA2 Rank vs Target_Bld_PA3 Rank vs Model_Bld_PA3 Rank vs Target_Bld_PA4 Rank vs Model_Bld_PA4 ( a ) 0 1 2 3 4 5 6 7 In te rn ode len g th ( c m) 0 5 10 15 20 25 30 ( b )
Growth unit rank
0 1 2 3 4 5 6 7 In te rnod e diame ter ( c m) 0 1 2 3 4 PA1 PA2 PA3 PA4
Fig. 4 Fitting results of single internodes length and diameter of trunk and different order branches of a 6-year-old Mongolian Scots pine tree
PA1: Trunk; PA2: 1st-order branch; PA3: 2nd-order branch; PA4: 3rd-order branch, from measured data (symbols) and model output (lines)
4 Discussions
This study presents the calibration process of the GL2 model for Mongolian Scots pine trees. It was the first calibration of the GL2 model based on experimental data. The 3D architecture of a 6-year-old Mongolian Scots pine tree was simulated after model calibration, which represented fairly well the stochastic characters of tree stands. The decreasing
( b ) 0 1 2 3 4 5 6 7 Need les f resh bi oma ss (g) 0 50 100 150 200 250 300 ( a ) 0 1 2 3 4 5 6 7 In te rnode f resh biomass ( g ) 0 100 200 300 400 ( c ) Plant age 0 1 2 3 4 5 6 7 T o ta l biomass ( g ) 0 200 400 600 800 1000 1200 PA1 PA2 PA3 PA4
Fig.5 Fitting results of internodes, needles and total fresh biomass of trunk and different order branches
PA1: Trunk; PA2: 1st-order branch; PA3: 2nd-order branch; PA4: 3rd-order branch, from measured data (symbols) and model output (lines)
Fig.6 Simulated stochastic architecture of 6-year-old Mongolian Scots pine tree using fitted branching probability (Table 1)
branching probability reflects that higher order branches are more vulnerable to environmental stress, reflecting the adaption of plant architecture to drought condition [30] . On the other hand, losing the 2nd or 3rd order branches will not significantly decrease plant growth, as their contribution on leaf area is small (Fig. 5b). As most of wood biomass is reserved in trunk and primary branches (Fig. 5b), the production is kept.
Due to high topological complexity and tremendous number of organs in trees, most functional-structural tree models only used less experimental data to indicate the functional nature of plant growth and development, and lacked full calibration and validation [15] [31] .The fitting results of this paper show that considering mean and variance of number of organs to calibrate the GL2 model of topological development was reasonable and acceptable for Mongolian Scots pine trees. The GL2 model can simulate plant morphological plasticity and organ biomass change fairly well based on stochastic dual-scale automaton and source-sink relationships.
By introducing branching probabilities into the GreenLab model, the GL2 version allows reproducing the variability of branching structures that can be observed within plant communities.
The functional and structure tree models by Sterck et al. [32] and Renton et al. [33] also accounted for stochastic phenomena of plant growth. However, the parameter values driving apical and axillary buds breaks in their models are set intuitively. The branch probabilities in GL2 were estimated from experimental data of mean and variance of numbers of organs, which reflected the observed stochastic characters of Mongolian Scots pine trees stand in this region of North China. In the stochastic architecture model presented here, the resulting plant architecture is not influenced by biomass production. In nature,
the plant architecture is the result of both genotype and environment influence. The numbers of branches are strongly influenced by plant physiological activities [34]. It can be expected that the branching probability is dependent on the water content of the soil. The biomass is allocated into determined number and type of sinks in GL2, which omits the effects of source variations on sink numbers and types [35]. In the experiments, we found the number of 2nd and 3rd order branch increased with plant age. Thus plant buds behavior might be highly related to plant biomass production. A new perspective is to integrate these observations into the new version of GreenLab model based on the previous work [36]. Thus the variation of topological structure depending on dynamic sink–source relationships of trees can be simulated.
Acknowledgements
This study was supported by Hi-Tech Research and Development (863) Program of China (2006AA10Z229 and 2008AA10Z218) and the National Program for Key Science and Technology Projects of China (No. 2005BA517A, 2006BAD26B01). We are grateful to Bin Wang, Xuefeng Bai and Lu Feng for assisting in the experiments. We greatly appreciate Rui Qi for help on GreenSciLab.
References
[1] Kang, H.Z., Zhu, J.J., Li, Z.H. and Xu, M.L, Natural distribution of Pinus sylvestris var. mongolica on sandy land and its cultivation as an exotic species. Chinese Journal of Ecology, 2004, 23, pp. 134-139
[2] Zhu, J.J., Fan, Z.P., Zeng, D.H., Jiang, F.Q., and Takeshi, M., Comparison of stand structure and growth between artificial and natural forests of Pinus sylvestiris
var. mongolica on sandy land, Journal of Forestry Research, 2003, 14, pp. 103-111
[3] Vos, J., Marcelis, L.F.M., de Visser, P.H.B., Struik, P.C., and Evers, J.B., Functional-Structural Plant Modelling in Crop Production (Springer, 2007. 2007) [4] Godin, C., and Sinoquet, H., Functional-structural plant modelling, New Phytologist, 2005, 166, pp. 705-708 [5] Sievänen, R., Nikinmaa, E., Nygren, P., Ozier-Lafontaine, H., Perttunen, J., and Hakula, H., Components of functional-structural tree models, Annals Of Forest Science, 2000, 57, pp. 399-412
[6] Rauscher, H.M., Isebrands, J.G., Host, G.E., Dickson, R.E., Dickmann, D.I., Crow, T.R., and Michael, D.A., ECOPHYS: An ecophysiological growth process model for juvenile poplar, Tree Physiology, 1990, 7, pp. 255-281 [7] Bosc, A., EMILION, a tree functional-structural model: presentation and first application to the analysis of branch carbon balance, Annals Of Forest Science, 2000, 57, pp. 555-569
[8] Balandier, P., Lacointe, A., Le Roux, X., Sinoquet, H., Cruiziat, P., and Le Dizes, S., SIMWAL: a structural-functional model simulating single walnut tree growth in response to climate and pruning, Annals Of Forest Science, 2000, 57, pp. 571-585
[9] Perttunen, J., Sievanen, R., Nikinmaa, E., Salminen, H., Saarenmaa, H., and Vakeva, J., LIGNUM - A Tree Model Based on Simple Structural Units, Ecological Modelling, 1996, 77, pp. 87-98
[10] Perttunen, J., Sievanen, R., and Nikinmaa, E., LIGNUM: a model combining the structure and the functioning of trees, Ecological Modelling, 1998, 108, pp. 189-198
[11] Lo, E., Wang, Z.M., Lechowicz, M., Messier, C., Nikinmaa, E., Perttunen, J., and Sievanen, R., Adaptation of the LIGNUM model for simulations of growth and light response in Jack pine, Forest Ecology And Management, 2001, 150, pp. 279-291
[12] Perttunen, J., Nikinmaa, E., Lechowicz, M.J., Sievanen, R., and Messier, C., Application of the Functional-Structural Tree Model LIGNUM to Sugar Maple Saplings (Acer saccharum Marsh) Growing in Forest Gaps, Annals Of Botany, 2001, 88, pp. 471-481 [13] Shinozaki, K., Yoda, K., Hozumi, K., and Kira, T., A Quantitative Analysis of Plant Form -- The Pipe Model Theory I. Basic Analyses, Japanese Journal of Ecology, 1964, 14, pp. 97-105
[14] Perttunen, J., and Sievanen, R., Incorporating Lindenmayer systems for architectural development in a functional-structural tree model, Ecological Modelling, 2005, 181, pp. 479-491
[15] Lopez, G., Favreau, R.R., Smith, C., Costes, E., Prusinkiewicz, P., and DeJong, T.M., Integrating simulation of architectural development and source–sink behaviour of peach trees by incorporating Markov chains and physiological organ function submodels into L-PEACH, Functional Plant Biology, 2008, 35, pp. 761-771 [16] Allen, M.T., Prusinkiewicz, P., and DeJong, T.M., Using L-systems for modeling source-sink interactions, architecture and physiology of growing trees: the
L-PEACH model, New Phytologist, 2005, 166, pp. 869-880 [17] Prusinkiewicz, P., and Lindenmayer, A., The algorithmic beauty of plants (Springer-Verlag New York, Inc., 1990. 1990)
[18] Yan, H.P., Kang, M.Z., de Reffye, P., and Dingkuhn, M., A Dynamic, Architectural Plant Model Simulating Resource-dependent Growth, Annals Of Botany, 2004, 93, pp. 591-602
[19] Mathieu, A., Cournede, P.H., Letort, V., Barthelemy, D., and de Reffye, P., A dynamic model of plant growth with interactions between development and functional mechanisms to study plant structural plasticity related to trophic competition, Annals Of Botany, 2009, pp. 54 [20] de Reffye, P., Blaise, F., Chemouny, S., Jaffuel, S., Fourcaud, T., and Houllier, F., Calibration of a hydraulic architecture-based growth model of cotton plants, Agromomie, 1999, 19, pp. 265-280
[21] Guo, Y., Ma, Y.T., Zhan, Z.G., Li, B.G., Dingkuhn, M., Luquet, D., and de Reffye, P., Parameter Optimization and Field Validation of the Functional-Structural Model GREENLAB for Maize, Annals Of Botany, 2006, 97, pp. 217-230
[22] Kang, M.Z., Evers, J.B., Vos, J., and de Reffye, P., The Derivation of Sink Functions of Wheat Organs using the GREENLAB Model, Annals Of Botany, 2008, 101, pp. 1099-1108
[23] Dong, Q.X., Louarn, G., Wang, Y.M., Barczi, J.F., and de Reffye, P., Does the Structure-Function Model GREENLAB deal with crop phenotypic plasticity induced by plant spacing? A case study on tomato, Annals Of Botany, 2008, 101, pp. 1195-1206
[24] Guo, H., Letort, V., Hong, L.X., Fourcaud, T., Cournede, P.H., Lu, Y.C., and de Reffye, P., Adapation of the GreenLab Model for Analyzing Sink-Source Relationships in Chinese Pine Saplings, Second International Symposium on Plant Growth Modeling, Simulation, Visualization and their Applications – PMA’06, Beijing, China, 2006, pp. 236-243
[25] Letort, V., Cournede, P., Mathieu, A., De Reffye, P., and Constant, T., Parametric identification of a functional-structural tree growth model and application to beech trees (Fagus sylvatica), Functional Plant Biology, 2008, 35, pp. 951-963
[26] Kang, M.Z., Cournede, P.H., De Reffye, P., Auclair, D., and Hu, B.G., Analytical study of a stochastic plant growth model: Application to the GreenLab model, Mathematics And Computers In Simulation, 2008, 78, pp. 57-75
[27] Wang, F., Guo, Y., Lu, Q., Bai, X.F., Han, H., and Li, B.G., Modelling three-dimensional architecture of pine tree (Pinus sylvestris Linn. var. mongolica Litv.) in a semiarid area, New Zealand Journal Of Agricultural Research, 2007, 50, pp. 903-909
[28] Zhao, X., de Reffye, P., Xiong, F.L., Hu, B.G., and Zhan, Z.G., Dual scale automaton model for virtual plant, Chinese Journal of Computers, 2001, 06, pp. 49-56
[29] Barthelemy, D., and Caraglio, Y., Plant Architecture: A Dynamic, Multilevel and Comprehensive Approach to Plant Form, Structure and Ontogeny, Annals Of Botany, 2007, 99, pp. 375-407
[30] Maillette, L., Structural Dynamics of Silver Birch. I. The Fates of Buds, Journal Of Applied Ecology, 1982, 19, pp. 203-218
[31] Eschenbach, C., Emergent properties modelled with the functional structural tree growth model ALMIS: Computer experiments on resource gain and use, Ecological Modelling, 2005, 186, pp. 470-488
[32] Sterck, F.J., Schieving, F., Lemmens, A., and Pons, T.L., Performance of trees in forest canopies: explorations with a bottom-up functional-structural plant growth model, New Phytologist, 2005, 166, pp. 827-843
[33] Renton, M., Kaitaniemi, P., and Hanan, J., Functional-structural plant modelling using a combination of architectural analysis, L-systems and a canonical model of function, Ecological Modelling, 2005, 184, pp. 277-298
[34] Buck-Sorlin, G.H., and Bell, A.D., Models of crown architecture in Quercus petraea and Q. robur: Shoot lengths and bud numbers, Forestry, 2000, 73, pp. 1-19
[35] Dingkuhn, M., Luquet, D., Quilot, B., and de Reffye, P., Environmental and genetic control of morphogenesis in crops: towards models simulating phenotypic plasticity, Australian Journal Of Agricultural Research, 2005, 56, pp. 1289-1302
[36] Mathieu, A., Cournede, P.H., Barthelemy, D., and de Reffye, P., Rhythms and Alternating Patterns in Plants as Emergent Properties of a Model of Interaction between Development and Functioning, Annals Of Botany, 2008, 101, pp. 1233-1242