HAL Id: hal-02414563
https://hal.archives-ouvertes.fr/hal-02414563
Submitted on 27 Oct 2020
HAL is a multi-disciplinary open access
archive for the deposit and dissemination of
sci-entific research documents, whether they are
pub-lished or not. The documents may come from
teaching and research institutions in France or
abroad, or from public or private research centers.
L’archive ouverte pluridisciplinaire HAL, est
destinée au dépôt et à la diffusion de documents
scientifiques de niveau recherche, publiés ou non,
émanant des établissements d’enseignement et de
recherche français ou étrangers, des laboratoires
publics ou privés.
CH 4 model biases
Zhiting Wang, Thorsten Warneke, Nicholas Deutscher, Justus Notholt, Ute
Karstens, Marielle Saunois, Matthias Schneider, Ralf Sussmann, Harjinder
Sembhi, David Griffith, et al.
To cite this version:
Zhiting Wang, Thorsten Warneke, Nicholas Deutscher, Justus Notholt, Ute Karstens, et al..
Con-tributions of the troposphere and stratosphere to CH 4 model biases. Atmospheric Chemistry and
Physics, European Geosciences Union, 2017, 17 (21), pp.13283-13295. �10.5194/acp-17-13283-2017�.
�hal-02414563�
Atmos. Chem. Phys., 17, 13283–13295, 2017 https://doi.org/10.5194/acp-17-13283-2017 © Author(s) 2017. This work is distributed under the Creative Commons Attribution 3.0 License.
Contributions of the troposphere and
stratosphere to CH
4
model biases
Zhiting Wang1, Thorsten Warneke1, Nicholas M. Deutscher1,2, Justus Notholt1, Ute Karstens3, Marielle Saunois4, Matthias Schneider5, Ralf Sussmann6, Harjinder Sembhi7, David W. T. Griffith2, Dave F. Pollard8, Rigel Kivi9, Christof Petri1, Voltaire A. Velazco2, Michel Ramonet4, and Huilin Chen10,11
1Institute of Environmental Physics, University of Bremen, Bremen, Germany 2Centre for Atmospheric Chemistry, School of Chemistry, University of Wollongong,
Wollongong, New South Wales, Australia
3Max Planck Institute for Biogeochemistry, Jena, Germany
4Laboratoire des Sciences du Climat et de l’Environnement, LSCE-IPSL (CEA-CNRSUVSQ),
Université Paris-Saclay, 91 191 Gif Sur Yvette, France
5Karlsruhe Institute of Technology, IMK-ASF, Karlsruhe, Germany
6Karlsruhe Institute of Technology, IMK-IFU, Garmisch-Partenkirchen, Germany
7Earth Observation Science, Department of physics and Astronomy, University of Leicester, Leicester, UK 8National Institute of Water and Atmospheric Research (NIWA), Wellington, New Zealand
9Finnish Meteorological Institute Arctic Research Center, FMI-ARC, Sodankylä, Finland 10Center for Isotope Research (CIO), University of Groningen, Groningen, the Netherlands
11Cooperative Institute for Research in Environmental Sciences (CIRES), University of Colorado, Boulder, CO, USA
Correspondence to:Zhiting Wang (zhiting@iup.physik.uni-bremen.de) Received: 22 November 2016 – Discussion started: 23 December 2016
Revised: 12 September 2017 – Accepted: 3 October 2017 – Published: 9 November 2017
Abstract. Inverse modelling is a useful tool for retriev-ing CH4 fluxes; however, evaluation of the applied
chem-ical transport model is an important step before using the inverted emissions. For inversions using column data one concern is how well the model represents stratospheric and tropospheric CH4when assimilating total column
measure-ments. In this study atmospheric CH4 from three inverse
models is compared to FTS (Fourier transform spectrome-try), satellite and in situ measurements. Using the FTS mea-surements the model biases are separated into stratospheric and tropospheric contributions. When averaged over all FTS sites the model bias amplitudes (absolute model to FTS dif-ferences) are 7.4 ± 5.1, 6.7 ± 4.8, and 8.1 ± 5.5 ppb in the tropospheric partial column (the column from the surface to the tropopause) for the models TM3, TM5-4DVAR, and LMDz-PYVAR, respectively, and 4.3 ± 9.9, 4.7 ± 9.9, and 6.2 ± 11.2 ppb in the stratospheric partial column (the col-umn from the tropopause to the top of the atmosphere). The model biases in the tropospheric partial column show
a latitudinal gradient for all models; however there are no clear latitudinal dependencies for the model biases in the stratospheric partial column visible except with the LMDz-PYVAR model. Comparing modelled and FTS-measured tro-pospheric column-averaged mole fractions reveals a similar latitudinal gradient in the model biases but comparison with in situ measured mole fractions in the troposphere does not show a latitudinal gradient, which is attributed to the differ-ent longitudinal coverage of FTS and in situ measuremdiffer-ents. Similarly, a latitudinal pattern exists in model biases in ver-tical CH4gradients in the troposphere, which indicates that
vertical transport of tropospheric CH4is not represented
1 Introduction
Atmospheric methane (CH4)is the second most important
anthropogenic greenhouse gas. Atmospheric CH4
concen-trations began to rise again in 2007 after a decade of near-zero growth (Rigby et al., 2008). Possible explanations for the stability of CH4 concentrations during 1999–2006
in-clude an increase in anthropogenic emissions and coinci-dent decrease in wetland emissions (Bousquet et al., 2006), decreased Northern Hemisphere microbial sources (Kai et al., 2011), and a combination of decreasing-to-stable fossil fuel emissions and stable-to-increasing microbial emissions (Kirschke et al., 2013). Several possible reasons for the re-newed growth of CH4concentrations after 2006 have been
proposed, including the increase of wetland emissions dur-ing 2007 and 2008 in either the tropics, owdur-ing to greater than average precipitation, and/or in the Arctic, owing to high temperatures (Dlugokencky et al., 2009); the anthropogenic contribution at the tropics and midlatitudes in the Northern Hemisphere during the period 2007–2010 (Bergamaschi et al., 2013); an increase of emissions from oil and gas produc-tion and use during 2007–2014 (Hausmann et al., 2016); and from agriculture (Schaefer et al., 2016).
Prediction of the evolution of CH4in the atmosphere
re-quires knowledge of the sources and sinks. Inverse mod-elling is usually used to retrieve fluxes from observations of atmospheric concentrations. The commonly used measure-ments include surface measuremeasure-ments from global networks, such as the NOAA/ESRL (Earth System Research Labo-ratory of the National Oceanic and Atmospheric Adminis-tration), and total column data from satellites, such as the SCIAMACHY (SCanning Imaging Absorption spectroMe-ter for Atmospheric CHartographY) or GOSAT (Greenhouse gases Observing Satellite). However, compared to total col-umn data the surface measurements characterise the bound-ary layer only and CH4concentrations in the boundary layer
are sensitive to boundary layer height, which is difficult to accurately simulate in a global transport model. The total col-umn measurements are less sensitive to model errors in the vertical distributions of CH4. However, they are also only
sensitive to broader-scale signatures. Compared to satellite measurements, surface in situ measurements have poor spa-tial coverage but are more precise and less subject to bi-ases. Total column measurements of CH4 include a
contri-bution from the stratosphere where the concentrations are in-fluenced by dynamical processes like meridional transport, tropopause variations, and subsidence associated with the polar vortex, and chemistry. If a transport model does not accurately simulate these processes, the retrieved sources and sinks using total column measurements will not be cor-rect (Locatelli et al., 2015a, b). Especially in the polar re-gion, the tropopause height varies strongly and the dynam-ical processes are complex. Turner et al. (2015) compared GOSAT CH4with GEOS-Chem simulations, and found large
differences at high latitudes. They proposed that the model
bias in total column CH4 at high latitudes comes from the
stratosphere since the validation with TCCON (Total Car-bon Column Observing Network), NOAA surface and air-craft measurements, and HIPPO shows good performances of the model in the troposphere. Ostler et al. (2016) assessed accuracies of models in the stratosphere by replacing mod-elled stratospheric CH4 with satellite measurements. They
found that modelled stratospheric CH4 shows large scatter
and the corrected total columns of CH4 show improved or
degraded agreements with TCCON measurements depend-ing on the used satellites and models. These results imply that satellite-based stratospheric CH4is not accurate enough
to resolve a possible stratospheric contribution to model bi-ases in total column CH4as uncovered by TCCON.
TCCON-based measurements could fulfil such a role, as presented in Saad et al. (2016) and this study. Using HF as a proxy, Saad et al. (2016) derived tropospheric CH4products and
investi-gated the impact of stratospheric and tropospheric model bi-ases in GEOS-Chem on inversions. They found an increasing stratospheric mismatch with decreasing tropopause altitudes and a phase lag in modelled tropospheric seasonality. A small bias in the modelled CH4 column could come from
coun-teracting stratospheric and tropospheric model errors. They noted that the tropospheric time lag can produce large errors in posterior wetland emissions at high northern latitudes.
In this study the model biases in the stratosphere and tro-posphere are assessed with respect to the latitudinal pattern. In order to investigate the accuracy of the models several measurements are used: (i) total, tropospheric, and strato-spheric column-averaged CH4 mole fractions measured at
the TCCON (Wunch et al., 2011; Wang et al., 2014), which are used to separate stratospheric and tropospheric contri-butions to model bias in total columns; (ii) total column-averaged CH4mole fraction measured by GOSAT (Parker et
al., 2011) and CH4profiles measured by TES (Tropospheric
Emission Spectrometer) (Worden et al., 2012); (iii) surface CH4 measured within the NOAA network (Dlugokencky et
al., 1994); and (iv) in situ CH4 profiles from aircraft
cam-paign HIPPO (HIAPER Pole-to-Pole Observations) (Wofsy et al., 2012). In the following, Sect. 2 presents the measure-ments, models, and analysis approach, while Sect. 3 presents the results and discussions. Conclusions are drawn in Sect. 4.
2 Measurements and models
We work here with near-infrared spectra of TCCON, from which the tropospheric CH4 is derived using an a
poste-riori correction method in contrast to the direct profile re-trieval (Sepúlveda et al., 2014) being applied to mid-infrared spectra. The tropospheric CH4is derived through removing
stratospheric contributions in total column CH4. The
strato-spheric contributions are estimated from stratostrato-spheric N2O
columns derived from total N2O columns. A calibration of
agree-Z. Wang et al.: Contributions of the troposphere and stratosphere to CH4model biases 13285
Figure 1. Calibration results of FTS-derived tropospheric column-averaged CH4mole fractions against in situ measurements. The in situ profiles are smoothed using GFIT CH4averaging kernels in the troposphere as described in Wang et al. (2014). The FTS data are averaged for the in situ measurement periods. The IMECC is an aircraft campaign over Europe (Geibel et al., 2012). The Lamont-AirCore measurements are from Greenhouse Gas Group Aircraft Program (http://www.esrl.noaa.gov/gmd/ccgg/aircraft/). The AirCore data at Sodankylä is from the FTS group there.
Table 1. Overview of TCCON sites used.
TCCON site Latitude Longitude Altitude Citation (◦N) (◦E) (m a.s.l.)
Ny-Ålesund 78.9 11.9 20 Messerschmidt et al. (2010) Sodankylä 67.3668 26.6310 188
Bialystok 53.23 23.025 183 Messerschmidt et al. (2012) Bremen 53.10 8.85 27 Messerschmidt et al. (2010) Orléans 47.97 2.113 130 Messerschmidt et al. (2010) Garmisch 47.476 11.063 740 Sussmann et al. (2013),
Sussmann and Rettinger (2014) Park Falls 45.945 −90.273 440 Washenfelder et al. (2006) Lamont 36.604 −97.486 320 Wunch et al. (2009) Izaña 28.3 −16.483 2370 Blumenstock et al. (2014) Darwin −12.424 130.891 30 Deutscher et al. (2010) Wollongong −34.406 150.879 30 Deutscher et al. (2010) Lauder −45.038 169.684 370 Sherlock et al. (2014)
ment within 3.0 ± 2.0 ppb (see Fig. 1). Given the total and tropospheric CH4 columns, stratospheric column-averaged
CH4is derived using knowledge of the tropopause pressure.
The TCCON sites used in this study are listed in Table 1, the products are all using the GGG2014 version (Wunch et al., 2015), except for at Ny-Ålesund.
The CO2proxy retrieval method (Frankenberg et al., 2011)
is applied in GOSAT data, which infers dry air columns from the CO2columns retrieved from the same spectra as used in
the CH4retrieval. This method assumes the CO2
concentra-tions are known and provided by model simulaconcentra-tions (the Car-bonTracker model). The GOSAT total column-averaged dry-air CH4mole fractions used here are version UoL-OCPRv7
and only spectra measured in clear-sky conditions are used (Parker et al., 2011). GOSAT has a ground footprint diam-eter of about 10.5 km and 4 s exposure duration. The TES instrument measures atmospheric radiances from which at-mospheric profiles are inferred using an optimal estimation algorithm subject to a priori constraints. The CH4retrieval of
Table 2. Information on the models and set-up details.
Model Institute Resolution No. of vertical Output time Meteorology (lat × lon) levels step (h)
TM3 Max Plank Institute 4◦×5◦ 26 3.0 ERA-Interim for Biogeochemistry
TM5-4DVAR European Joint 1◦×1◦for Europe, 25 1.5 ECMWF-IFS Reseach Centre 6◦×4◦for the rest
of the world
LMDz-PYVAR Laboratoire des 1.875◦×3.75◦ 39 3.0 Prediction by LMDz
Sciences du Climatet with nudging to
de l’Environment ECMWF reanalysis
Table 3. FTS and in situ sites used for comparison to FTS tropospheric column-averaged CH4and surface/tower CH4.
FTS site In situ site
Name Lat (◦N) Lon (◦E) Alt (m a.s.l.) Name Lat (◦N) Lon (◦E) Alt (m a.s.l.) Ny-Ålesund 78.923 11.923 24 Zep/NOAA 78.907 11.889 479 Sodankylä 67.367 26.631 188 Pal/NOAA 67.970 24.120 565 Orléans 47.965 2.113 132 Trainou tower 47.965 2.113 311 Park Falls 45.945 −90.273 440 Lef/NOAA 45.930 −90.270 868 Lamont 36.604 −97.486 320 Sgp/NOAA 36.620 −97.480 374 Izaña 28.300 −16.483 2370 Izo/NOAA 28.300 −16.480 2378 Lauder −45.038 169.684 370 Bhd/NOAA −41.408 174.871 90
2.3, which peaks in the tropics and decreases toward high latitudes. The version F07_10 data are applied and measure-ments with less than 1.4 DOFS are filtered out. Validation of F07_10 data against HIPPO measurements shows a bias of −8–5 ppb with standard deviations of 25–50 ppb below 100 hPa (Herman et al., 2014).
Vertical gradients of tropospheric CH4can be qualitatively
calculated by using the comparative tropospheric column-averaged CH4and surface CH4. Only long-term timescales
are used here, and variations with scales longer than 1.4 years are extracted from the time series of tropospheric and sur-face CH4. TCCON and in situ sites are selected to be located
close to one another so that both instruments measure similar air masses. The sites and measurements are listed in Table 3. The CH4 measurements during HIPPO 1–5 are those
made with a quantum cascade laser spectrometer (QCLS). Calibrations derived through comparisons with NOAA Pro-grammable Flask Package measurements are applied.
The models used in this study are TM3, TM5-4DVAR, LMDz-PYVAR; details are given in Table 2. All the three models are optimised against in situ measurements at the sur-face through inversions of CH4 surface emissions. The first
two models used a common emission a priori for their inver-sion runs. Detailed information on the inverinver-sion methodol-ogy is discussed in Bergamaschi et al. (2015). The LMDz-PYVAR uses different a prior and background stations as constraints, the BG–SP (background network – transport parameterisation scheme) set-up described in Locatelli et
al. (2015b). The chemical reactions considered in the models are the oxidation by OH in the troposphere and by Cl, OH, and O(1D) in the stratosphere. The fields of the radicals are prescribed monthly with no interannual changes.
Details on the global atmospheric tracer model TM3 can be found in Heimann and Körner (2003) and the inver-sion method of the Jena CarboScope is described in Röden-beck (2005). TM5-4DVAR is a four-dimensional data assim-ilation system for inverse modelling of atmospheric methane emission (Meirink et al., 2008). The system is based on the TM5 atmosphere transport model (Krol et al., 2005). LMDz-PYVAR is a framework that combines the inversion system PYVAR (Chevallier et al., 2005; Pison et al., 2009) with the transport model LMDz (Hourdin et al., 2006).
For evaluation of the models, we interpolate the simu-lations in time, latitude, longitude, and pressure to match the measurements. For the total and tropospheric column-averaged CH4the model profile is integrated taking the a
pri-ori and averaging kernel into account according to Rodgers and Connor (2003) using Eqs. (9) and (14) from Wang et al. (2014). In contrast to FTS and GOSAT the transforma-tion of model CH4profiles to the counterpart of TES is done
in logarithms of a prior and model quantities. The thermal tropopause calculated using the ERA-Interim reanalysis data is used in all calculations, and would not be so accurate for the TM5 and LMDz models, especially for LMDz, which predicts its own meteorology fields through nudging to re-analysis data.
Z. Wang et al.: Contributions of the troposphere and stratosphere to CH4model biases 13287
Figure 2. Yearly and seasonal mean model bias of total column-averaged CH4mole fractions plotted as a function of latitude. Panel (a) is the results using FTS data while panel (b) is for GOSAT. The difference for the models is given in yellow (TM3), blue (TM5-4DVAR), and magenta (LMDz-PYVAR). The average of FTS results is for the period 2007–2011 where FTS measurements are available, and for GOSAT in the period 2009–2011.
3 Comparison between measurements and models The CH4column meridional distribution is sensitive to the
latitudinal distribution of CH4sources and sinks, tropopause
altitudes, inter-hemisphere transport in the troposphere, and the residual circulation in the stratosphere. Assessing latitu-dinal variabilities of biases of a model could reveal how well these processes are represented in the model. Another impor-tant concern of this study is to determine which of the tropo-spheric or stratotropo-spheric components contributes more to the model biases in the total column. The model to FTS compar-ison covers the period 2007–2011 when FTS measurements are available and the comparison to GOSAT is for the period 2009–2011.
The latitudinal behaviour of the model bias in total column-averaged CH4 mole fractions is revealed by
com-parisons to FTS and GOSAT measurements as presented in Fig. 2, similarly to previous work (Monteil et al., 2013). CH4 is emitted mainly in the Northern Hemisphere,
de-stroyed mainly in the tropics by OH, and has a slow inter-hemisphere transport with a temporal scale of approximately 1 year. CH4is transported into the stratosphere mostly in the
tropics and back to the troposphere in the extratropics by the residual circulation. In the troposphere, CH4concentrations
are higher in the Northern Hemisphere than in the Southern Hemisphere with a gradient throughout the tropics. In the stratosphere, CH4 has a more or less symmetrical
distribu-tion between the two hemispheres. In Fig. 2 the model biases
present a clear latitudinal dependence, similar to results re-vealed by other studies (e.g. Turner et al., 2015 and Alexe et al., 2015). The latitudinal dependence is similar between FTS and GOSAT northward of 50◦S where FTS measure-ments are available. The model to measuremeasure-ments difference shows a north–south gradient with positive values at northern high-latitudes, northward of 50◦S for all the models.
With FTS-derived tropospheric and stratospheric column-averaged CH4(Wang et al., 2014), it is possible to examine
how the tropospheric and stratospheric partial columns con-tribute to the model bias in the total column-averaged CH4.
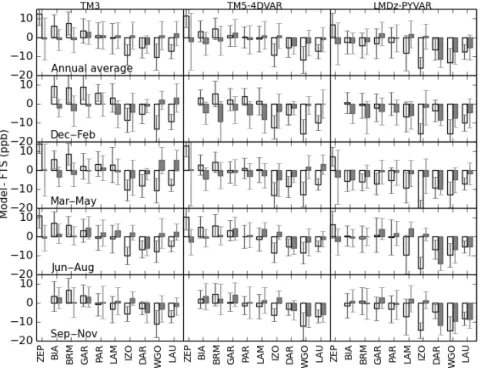
The partial columns are represented as the tropospheric and stratospheric column-averaged mole fractions scaled by the fraction of the partial air column. Figure 3 shows yearly and seasonal median model biases in the troposphere and strato-spheric partial columns. It is clear that model biases in the tropospheric partial column exhibit a north–south gradient with positive values at northern high latitudes during all sea-sons for all models. The model biases in the stratospheric partial column do not present any clear latitudinal pattern that persists throughout the whole year and shows signifi-cant seasonal variabilities for TM3 and TM5-4DVAR. This is consistent with the fact that stratospheric CH4
distribu-tions cycle between summer and winter hemispheric states. In the case of LMDz-PYVAR there is a permanent pattern in the stratospheric partial column biases that is more negative in the south. This pattern is consistent with the north–south gradient in the total column biases. Compared to Fig. 2 one
Figure 3. Yearly and seasonal medians of the scaled stratospheric and tropospheric contributions in modelled total column biases at TCCON sites. The sites from left to right are from north to south. The white bar denotes the tropospheric bias, the grey bar the stratospheric bias. The scale factors for the model bias are the air column fractions Pt/1000 (stratosphere) and (1 − Pt/1000) (troposphere), where Pt is the tropopause pressure. The error bars are the standard deviations of the model biases. The results are averaged for 2007–2011 when FTS measurements are available.
can see that the latitudinal pattern of model biases in total column-averaged CH4results from both the stratosphere and
troposphere for LMDz-PYVAR, but arises from the tropo-sphere for TM3 and TM5. The model biases change signs yearly and seasonally; therefore it is more appropriate to use the amplitudes (absolute model to FTS differences) to eval-uate the contributions of the troposphere and stratosphere. The medians of model bias amplitudes over all FTS sites and years are 7.4 ± 5.1 ppb in the tropospheric partial column and 4.3 ± 9.9 ppb in the stratospheric partial column for TM3, 6.7 ± 4.8 and 4.7 ± 9.9 ppb for TM5-4DVAR, and 8.1 ± 5.5 and 6.2 ± 11.2 ppb for LMDz-PYVAR.
Evaluations of the models at the surface using in situ measurements, which are assimilated into the models, show smaller biases than the tropospheric column-averaged CH4.
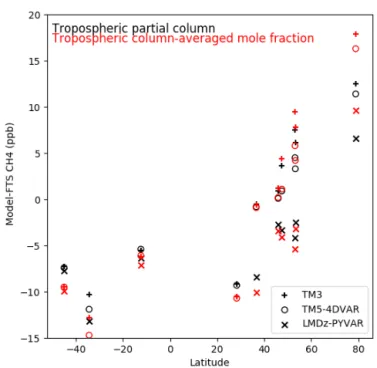
The amplitudes are mostly below 10 ppb in the Northern Hemisphere except for a few outliers and below 5 ppb in the Southern Hemisphere (not shown). The model biases at the surface do not show any significant latitudinal dependence that is present in the model biases of both the tropospheric partial column and column-averaged CH4(see Fig. A1). It is
not clear how the model biases at the surface appear in the regions where no measurements are assimilated. However, it could be true that the overestimation of the tropospheric column-averaged CH4meridional gradient is due to model
biases in the middle and upper troposphere. That would mean
that vertical distributions of CH4in the troposphere are not
represented correctly in the models.
Figure 4 presents a comparison of modelled and measured vertical gradients of tropospheric CH4, as qualitatively
rep-resented by the difference between the tropospheric column-averaged CH4and the surface CH4. The vertical gradient is
influenced by surface emissions, transport, and OH fields. Generally there are negative vertical gradients in the North-ern Hemisphere and positive vertical gradients in the South-ern Hemisphere (except for over the southSouth-ern continents in locations with strong emissions). Here we refer to decreasing CH4 mole fractions with altitude as a negative vertical
gra-dient, while increasing CH4with altitude is a positive
ver-tical gradient. This occurs because most CH4 is emitted in
the Northern Hemisphere and mixed into the southern hemi-spheric Hadley cell, the southward branch of which prevails in the middle and upper troposphere. In the troposphere, sur-face emissions cause decreasing CH4with altitude, while OH
oxidation causes a negative vertical gradient. The model bi-ases in the tropospheric vertical gradient are mostly positive at middle and high northern latitudes, and negative at other latitudes. So the overestimated tropospheric CH4 at middle
and high northern latitudes could not originate from overes-timated emissions, which should result in a more negative vertical gradient in the troposphere.
Figure 5 shows a comparison between model simulations and HIPPO measurements. The results are longitudinally
av-Z. Wang et al.: Contributions of the troposphere and stratosphere to CH4model biases 13289
Figure 4. Measured (black) and simulated (yellow: TM3, blue: TM5-4DVAR, magenta: LMDz-PYVAR) vertical gradients of CH4 in the troposphere (a) and differences between the measurement and simulations (b) against latitude. The results are averaged for 2007– 2011 when FTS measurements are available.
eraged for all five HIPPO missions within grids of 4◦latitude and pressure increments of 10 hPa. A significant feature is an overestimation of CH4in the lowermost stratosphere over
latitudes higher than 30◦S/N, much larger than the biases in the troposphere. It is not clear whether the overestimation arises from the residual transport in the stratosphere, which appears to be too strong, a too high tropopause, an incorrect vertical CH4 gradient across the tropopause or a
misrepre-sentation of stratospheric chemistry. Underestimations dom-inate in the upper southern troposphere, consistent with the results in Fig. 4 that modelled gradients of tropospheric CH4
are negatively biased as revealed by FTS and surface mea-surements. There are no significant patterns for the vertical gradient bias in the northern troposphere.
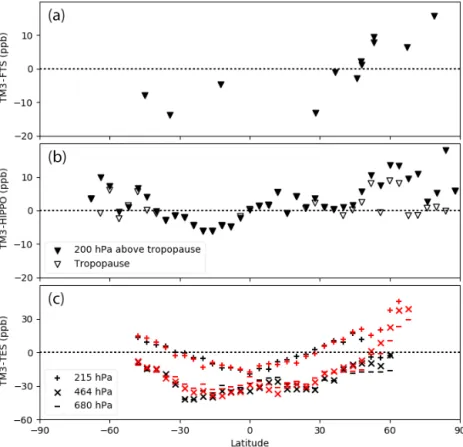
Unlike for the FTS, the model biases in the tropospheric column-averaged CH4 revealed by HIPPO do not show a
significant latitudinal trend (Fig. 6, only TM3 are shown there since other models gives similar behaviour). This could be because the FTS-measured tropospheric column-averaged CH4is defined differently to the mean mole fraction between
the surface and thermal tropopause. In deriving the FTS tro-pospheric CH4, the stratospheric CH4is removed via its
lin-ear correlation with N2O. The tropopause in the FTS data
therefore has a chemical definition. It is not clear how dif-ferent from each other the two kinds of tropopause are dur-ing this period. A sensitivity test was conducted by shiftdur-ing the thermal tropopause 200 hPa upward to include the lower stratosphere where CH4is overestimated by the models. The
Figure 5. HIPPO-measured CH4and differences with models in the stratosphere (a) and troposphere (b). The result is an average for five HIPPO missions, averaged for latitudinal bins of 4◦ and vertical increments of 10 hPa.
model biases compared against HIPPO then become closer to those against FTS. However, this difference of 200 hPa be-tween the chemical and thermal tropopause is unrealistically large. In addition, the FTS-measured tropospheric column-averaged CH4agrees well with in situ measurements in Fig. 1
where the thermal tropopause is applied.
Another possible explanation is that HIPPO sampled the atmosphere mostly in the region 150◦E–110◦W, over the Pa-cific Ocean. Apart from Izaña and Ny-Ålesund, the northern FTS sites are located inland. The longitudinal dependence of model biases is investigated with TES-measured CH4mole
fractions at 215, 464, and 680 hPa (the lower panel in Fig. 6). Because the TES profiles have limited vertical resolution, the concentrations at the three levels are not independent. The weighting function of CH4at 215 hPa peaks around 200 hPa
in the tropics and around 300 hPa higher than 50◦N/S. The
measurements at 464 hPa show the largest sensitivity around 500–600 hPa, and those at 680 hPa have similar vertical sen-sitivity but fewer weights above 400 hPa. The comparisons are separated into a region representing HIPPO sampling (re-ferred as region I) and the remaining longitudes (re(re-ferred as region II). Differences between the model biases in the two regions occur northward of 45◦N most significantly at the
Figure 6. Comparisons of CH4with TM3 and (a) FTS, (b) HIPPO and (c) TES. In the case of HIPPO and FTS the tropospheric column-averaged CH4is compared, which is obtained from integration between surface and the tropopause (empty characters) or 200 hPa above the tropopause shifted (solid characters, only in the HIPPO case). For TES CH4mole fractions at 215, 464, and 680 hPa are compared with TM3 simulations in a region 110◦W–150◦E (black) and the region beyond it (red) separately. Both TM3 and the measurements are averaged during the HIPPO 1–5 period.
level 215 hPa. Increases in the model biases continue in re-gion II but decrease in rere-gion I, which is more or less similar to the differences between model biases revealed by FTS and HIPPO at these latitudes. Consistent with FTS the model– TES difference also shows a north–south gradient northward of 50◦S. However, it is not clear whether the latitudinal pat-tern comes from the TES retrieval or model errors. Valida-tion of TES tropospheric CH4with HIPPO gives near-zeros
biases except for latitudes 40–60◦N where the TES biases vary within −10 to −20 ppb (Herman et al., 2014).
4 Conclusions
In this study, three inverse models for CH4 are evaluated
using different observations that cover different scales. The aim is to determine whether most of the model biases are from the stratosphere or troposphere. With FTS stratospheric and tropospheric column-averaged CH4 derived from the
FTS total column measurements, it is shown that model bias amplitudes are 7.4 ± 5.1, 6.7 ± 4.8, and 8.1 ± 5.4 ppb in the tropospheric partial column for TM3, TM5-4DVAR, and LMDz39-PYVAR. The corresponding stratospheric partial
column biases are 4.3 ± 9.9, 4.7 ± 9.9, and 6.1 ± 11.2 ppb. The tropospheric partial column model bias exhibits a north– south gradient northward of 50◦S with an overestimation at
northern high latitudes for all models. There is no persistent latitudinal pattern with season in the stratospheric partial col-umn model bias for TM3 and TM5-4DVAR.
The evaluation of the models at the surface shows a smaller bias compared to the tropospheric column-averaged CH4. We assume that the tropospheric model biases are
mainly located in the middle and upper troposphere, although comparisons at the surface are only limited to sites where the measurements have been assimilated into the models. A comparison with HIPPO in the troposphere does not show the same latitudinal pattern in model biases as in the comparison with FTS. Two possible reasons are suggested: (i) the dif-ference between the thermal tropopause and that in the FTS tropospheric CH4 product, and (ii) the latitude patterns of
model biases are dependent on longitude. Using an assess-ment of model biases relative to TES satellite measureassess-ments, we propose that the longitudinal dependence of the model performance contributes to the difference between HIPPO and FTS. However, the tropopause altitude could cause dif-ferences during short temporal scale processes, e.g.
strato-Z. Wang et al.: Contributions of the troposphere and stratosphere to CH4model biases 13291
spheric intrusions where the stratospheric air can sink be-low the thermal tropopause. Stratospheric air can also detach from the stratosphere completely and enter the troposphere. If the detached air parcels still have stratospheric proper-ties, e.g. CH4correlates with N2O as in the stratosphere, the
FTS-measured tropospheric CH4excludes these air parcels;
however, direct integration from the surface to the thermal tropopause, such as that used for the models and in situ pro-files, will include these in the tropospheric CH4. More
con-fusing situations could occur where there is strong mixing across the UTLS (the upper troposphere and lower strato-sphere) and both thermal and chemical tropopause are not well defined. Future work will be devoted to clarifying the realistic content in FTS tropospheric column-averaged CH4
and to defining a reasonable approach when comparing it with in situ and model products in these situations.
Data availability. The TCCON data can be obtained from the TC-CON Data Archive (http://tccondata.org/). The model outputs are from Marille Saunois (Laboratoire des Sciences du Climat et de l’Environnement, France) for LMDz-PYVAR, Ute Karstens (the Max Plank Institute for Biogeochemistry, Jena, Germany) for TM3, and Peter Bergamaschi (European Commission Joint Research Cen-tre) for TM5-4DVAR. One should contact these authors directly considering the availability the model output. The GOSAT data UoL-OCPRv7, TES data F07_10 and HIPPO data are public avail-able. Surface CH4 measurements from NOAA are publicly avail-able. The in situ CH4profile measurements by AirCore will be-come available via the EU project RINGO. Lamont-AirCore mea-surements have been provided by the Colm Sweeney at the NOAA Carbon Cycle and Greenhouse Gas Group Aircraft Program (http: //www.esrl.noaa.gov/gmd/ccgg/aircraft/). The AirCore data at So-dankylä are from the FTS group there.
Appendix A
Figure A1. Latitudinal dependences of yearly averaged model bi-ases in the tropospheric partial column (black) and the tropospheric column-averaged mole fraction (red). The three models are rep-resented by plus (TM3), circle (TM5-4DVAR) and multiplication (LMDz-PYVAR) signs.
Z. Wang et al.: Contributions of the troposphere and stratosphere to CH4model biases 13293
Competing interests. The authors declare that they have no conflict of interest.
Acknowledgements. This research is funded by EU project InGOS. We acknowledge funding from the European Union’s Horizon 2020 research and innovation programme for the project RINGO (grant agreement no. 730944) as well. Nicholas Deutscher is sup-ported by an ARC-DECRA fellowship, DE140100178. TCCON measurements at Park Falls and Lamont are possible thanks to NASA grants NNX14AI60G, NNX11AG01G, NAG5-12247, and NNG05-GD07G, and the NASA Orbiting Carbon Observatory Pro-gram, as well as technical support from the DOE ARM programme (Lamont) and Jeff Ayers (Park Falls). Darwin and Wollongong TCCON support is funded by NASA grants NAG5-12247 and NNG05-GD07G and the Australian Research Council grants DP140101552, DP110103118, DP0879468 and LP0562346, as well as support from the GOSAT project and DOE ARM technical support in Darwin. The EU projects InGOS and ICOS-INWIRE and the Senate of Bremen provide financial support for TCCON measurements at Bremen, Orleans, Bialystok and Ny-Ålesund, and Orleans is also support by the RAMCES team at LSCE. The Lauder TCCON programme is core-funded by NIWA through New Zealand’s Ministry of Business, Innovation and Employment. The article processing charges for this open-access
publication were covered by the University of Bremen. Edited by: Ilse Aben
Reviewed by: two anonymous referees
References
Alexe, M., Bergamaschi, P., Segers, A., Detmers, R., Butz, A., Hasekamp, O., Guerlet, S., Parker, R., Boesch, H., Frankenberg, C., Scheepmaker, R. A., Dlugokencky, E., Sweeney, C., Wofsy, S. C., and Kort, E. A.: Inverse modelling of CH4 emissions for 2010–2011 using different satellite retrieval products from GOSAT and SCIAMACHY, Atmos. Chem. Phys., 15, 113–133, https://doi.org/10.5194/acp-15-113-2015, 2015.
Bergamaschi, P., Houweling, S., Segers, A., Krol, M., Frankenberg, C., Scheepmaker, R. A., Dlugokencky, E., Wofsy, S. C., Kort, E. A., Sweeney, C., Schuck, T., Brenninkmeijer, C., Chen, H., Beck, V., and Gerbig, C.: Atmospheric CH4in the first decade of the 21st century: Inverse modeling analysis using SCIAMACHY satellite retrievals and NOAA surface measurements, J. Geophys. Res., 118, 7350–7369, https://doi.org/10.1002/jgrd.50480, 2013. Bergamaschi, P., Corazza, M., Karstens, U., Athanassiadou, M., Thompson, R. L., Pison, I., Manning, A. J., Bousquet, P., Segers, A., Vermeulen, A. T., Janssens-Maenhout, G., Schmidt, M., Ramonet, M., Meinhardt, F., Aalto, T., Haszpra, L., Mon-crieff, J., Popa, M. E., Lowry, D., Steinbacher, M., Jordan, A., O’Doherty, S., Piacentino, S., and Dlugokencky, E.: Top-down estimates of European CH4 and N2O emissions based on four different inverse models, Atmos. Chem. Phys., 15, 715–736, https://doi.org/10.5194/acp-15-715-2015, 2015.
Blumenstock, T., Hase, F., Schneider, M., García, O. E., and Sepúlveda, E.: TCCON data from Izana, Tenerife, Spain,
Release GGG2014R0. TCCON data archive, hosted by the Carbon Dioxide Information Analysis Center, Oak Ridge Naional Laboratory, Oak Ridge, Tennessee, USA, https://doi.org/10.14291/tccon.ggg2014.izana01.R0/1149295, 2014.
Bousquet, P., Ciais, P., Miller, J. B., Dlugokencky, E. J., Hauglus-taine, D. A., Prigent, C., Van der Werf, G. R., Peylin, P., Brunke, E. G., Carouge, C., Langenfelds, R. L., Lathiere, J., Papa, F., Ra-monet, M., Schmidt, M., Steele, L. P., Tyler, S. C., and White, J.: Contribution of anthropogenic and natural sources to atmo-spheric methane variability, Nature, 443, 439–443, 2006. Chevallier, F., Fisher, P., Serrar, S., Bousquet, P., Breon,
F.-M., Chedin, A., and Ciais, P.: Inferring CO sources and sinks from satellite observations: Method and appli-cation to TOVS data, J. Geophys. Res., 110, D24309, https://doi.org/10.1029/2005JD006390, 2005.
Deutscher, N. M., Griffith, D. W. T., Bryant, G. W., Wennberg, P. O., Toon, G. C., Washenfelder, R. A., Keppel-Aleks, G., Wunch, D., Yavin, Y., Allen, N. T., Blavier, J.-F., Jiménez, R., Daube, B. C., Bright, A. V., Matross, D. M., Wofsy, S. C., and Park, S.: Total column CO2measurements at Darwin, Australia – site description and calibration against in situ aircraft profiles, At-mos. Meas. Tech., 3, 947–958, https://doi.org/10.5194/amt-3-947-2010, 2010.
Dlugokencky, E., Bruhwiler, L., White, J., Emmons, L., Nov-elli, P., Montzka, S., Masarie, K., Crotwell, A., Miller, J., and Gatti, L.: Observational constraints on recent increases in the atmospheric CH4 burden, Geophys. Res. Lett., 36, L18803, https://doi.org/10.1029/2009GL039780, 2009.
Dlugokencky, E. J., Steele, L. P., Lang, P. M., and Masarie, K. A.: The growth rate and distribution of atmospheric methane, J. Geo-phys. Res., 99, 17021–17043, 1994.
Frankenberg, C., Aben, I., Bergamaschi, P., Dlugokencky, E. J., Hees, R. V., Houweling, S., Meer, P. V. D., Snel, R., and Tol, P.: Global column-averaged methane mixing ra-tios from 2003 to 2009 as derived from SCIAMACHY: Trends and variability, J. Geophys. Res., 116, D04302, https://doi.org/10.1029/2010JD014849, 2011.
Geibel, M. C., Messerschmidt, J., Gerbig, C., Blumenstock, T., Chen, H., Hase, F., Kolle, O., Lavric, J. V., Notholt, J., Palm, M., Rettinger, M., Schmidt, M., Sussmann, R., Warneke, T., and Feist, D. G.: Calibration of column-averaged CH4 over Euro-pean TCCON FTS sites with airborne in situ measurements, At-mos. Chem. Phys., 12, 8763–8775, https://doi.org/10.5194/acp-12-8763-2012, 2012.
Hausmann, P., Sussmann, R., and Smale, D.: Contribution of oil and natural gas production to renewed increase in atmo-spheric methane (2007–2014): top–down estimate from ethane and methane column observations, Atmos. Chem. Phys., 16, 3227–3244, https://doi.org/10.5194/acp-16-3227-2016, 2016. Heimann, M. and S. Körner: The Global Atmospheric Tracer Model
TM3: Model description and users manual release 3.8a, Tech. Rep. 5, Max Planck Inst. for Biogeochem., Jena, Germany, 2003. Herman, R., Osterman, G. (Eds.), Alvarado, M., Boxe, C., Bow-man, K., Cady-Pereira, K., Clough, T., Eldering, A., Fisher, B., Fu, D., Herman R., Jacob, D., Jourdain, L., Kulawik, S., Lam-pel, M., Li, Q., Logan, J., Luo, M., Megretskaia, I., Nassar, R., Osterman, G., Paradise, S., Payne, V., Revercomb, H., Richards, N., Shephard, M., Tobin, D., Turquety, S., Vilnrotter, F., Wecht,
K., Worden, H., Worden, J., and Zhang, L.: Earth Observing System (EOS) Tropospheric Emission Spectrometer (TES) Data Validation Report (version F07_10 data), JPL Internal Report D-33192, available at: https://eosweb.larc.nasa.gov/sites/default/ files/project/tes/readme/TES_Validation_Report_v6.pdf (last ac-cess: 6 November 2017), 2014.
Hourdin, F., Musat, I., Bony, S., Braconnot, P., Codron, F., Dufresne, J. L., Fairhead, L., Filiberti, M. A., Friedlingstein, P., Grandpeix, J. Y., Krinner, G., Li, Z. X., and Lott, F.: The LMDz4 general circulation model: climate performance and sensitivity to parametrized physics with emphasis on tropical convection, Clim. Dynam., 27, 787–813, 2006.
Kai, F. M., Tyler, S. C., Randerson, J. T., and Blake, D. R.: Reduced methane growth rate explained by decreased Northern Hemi-sphere microbial sources, Nature, 476, 194–197, 2011.
Kirschke, S., Bousquet, P., Ciais, P., Saunois, M., Canadell, J. G., Dlugokencky, E. J., Bergamaschi, P., Bergmann, D., Blake, D. R., Bruhwiler, L., Cameron-Smith, P., Castaldi, S., Chevallier, F., Feng, L., Fraser, A., Heimann, M., Hodson, E. L., Houwel-ing, S., Josse, B., Fraser, P. J., Krummel, P. B., Lamarque, J.-F., Langenfelds, R. L., Quéré, C. L., Naik, V., O’doherty, S., Palmer, P. I., Pison, I., Plummer, D., Poulter, B., Prinn, R. G., Rigby, M., Ringeval, B., Santini, M., Schmidt, M., Shindell, D. T., Simpson, I. J., Spahni, R., Steele, L. P., Strode, S. A., Sudo, K., Szopa, S., Werf, G. R. V. D., Voulgarakis, A., Weele, M. V., Weiss, R. F., Williams, J. E., and Zeng, G.: Three decades of global methane sources and sinks, Nat. Geosci., 6, 813–823, https://doi.org/10.1038/ngeo1955, 2013.
Krol, M., Houweling, S., Bregman, B., van den Broek, M., Segers, A., van Velthoven, P., Peters, W., Dentener, F., and Bergamaschi, P.: The two-way nested global chemistry-transport zoom model TM5: algorithm and applications, Atmos. Chem. Phys., 5, 417– 432, https://doi.org/10.5194/acp-5-417-2005, 2005.
Locatelli, R., Bousquet, P., Hourdin, F., Saunois, M., Cozic, A., Couvreux, F., Grandpeix, J.-Y., Lefebvre, M.-P., Rio, C., Berga-maschi, P., Chambers, S. D., Karstens, U., Kazan, V., van der Laan, S., Meijer, H. A. J., Moncrieff, J., Ramonet, M., Scheeren, H. A., Schlosser, C., Schmidt, M., Vermeulen, A., and Williams, A. G.: Atmospheric transport and chemistry of trace gases in LMDz5B: evaluation and implications for inverse modelling, Geosci. Model Dev., 8, 129–150, https://doi.org/10.5194/gmd-8-129-2015, 2015a.
Locatelli, R., Bousquet, P., Saunois, M., Chevallier, F., and Cres-sot, C.: Sensitivity of the recent methane budget to LMDz sub-grid-scale physical parameterizations, Atmos. Chem. Phys., 15, 9765–9780, https://doi.org/10.5194/acp-15-9765-2015, 2015b. Meirink, J. F., Bergamaschi, P., and Krol, M. C.:
Four-dimensional variational data assimilation for inverse modelling of atmospheric methane emissions: method and comparison with synthesis inversion, Atmos. Chem. Phys., 8, 6341–6353, https://doi.org/10.5194/acp-8-6341-2008, 2008.
Messerschmidt, J., Macatangay, R., Notholt, J., Petri, C., Warneke, T., and Weinzierl, C.: Side by side measurements of CO2 by ground-based Fourier transform spectrometry (FTS), Tellus B, 62, 749– 758, https://doi.org/10.1111/j.1600-0889.2010.00491.x, 2010.
Messerschmidt, J., Chen, H., Deutscher, N. M., Gerbig, C., Grupe, P., Katrynski, K., Koch, F.-T., Lavriˇc, J. V., Notholt, J., Röden-beck, C., Ruhe, W., Warneke, T., and Weinzierl, C.: Automated
ground-based remote sensing measurements of greenhouse gases at the Bialystok site in comparison with collocated in situ mea-surements and model data, Atmos. Chem. Phys., 12, 6741–6755, https://doi.org/10.5194/acp-12-6741-2012, 2012.
Monteil, G., Houweling, S., Butz, A., Guerlet, S., Schep-ers, D., Hasekamp, O., Frankenberg, C., Scheepmaker, R., Aben, I., and Röckmann, T.: Comparison of CH4 in-versions based on 15 months of GOSAT and SCIA-MACHY observations, J. Geophys. Res., 118, 11807–11823, https://doi.org/10.1002/2013JD019760, 2013.
Ostler, A., Sussmann, R., Patra, P. K., Houweling, S., De Bruine, M., Stiller, G. P., Haenel, F. J., Plieninger, J., Bousquet, P., Yin, Y., Saunois, M., Walker, K. A., Deutscher, N. M., Griffith, D. W. T., Blumenstock, T., Hase, F., Warneke, T., Wang, Z., Kivi, R., and Robinson, J.: Evaluation of column-averaged methane in models and TCCON with a focus on the stratosphere, Atmos. Meas. Tech., 9, 4843–4859, https://doi.org/10.5194/amt-9-4843-2016, 2016.
Parker, R., Boesch, H., Cogan, A., Fraser, A., Feng, L., Palmer, P. I., Messerschmidt, J., Deutscher, N., Griffith, D. W. T., Notholt, J., Wennberg, P. O., and Wunch, D.: Methane observations from the Greenhouse Gases Observing SATellite: Comparison to ground-based TCCON data and model calculations, Geophys. Res. Lett., 38, L15807, https://doi.org/10.1029/2011gl047871, 2011. Pison, I., Bousquet, P., Chevallier, F., Szopa, S., and
Hauglus-taine, D.: Multi-species inversion of CH4, CO and H2emissions from surface measurements, Atmos. Chem. Phys., 9, 5281–5297, https://doi.org/10.5194/acp-9-5281-2009, 2009.
Rigby, M., Prinn, R. G., Fraser, P. J., Simmonds, P. G., Lan-genfelds, R. L., Huang, J., Cunnold, D. M., Steele, L. P., Krummel, P. B., Weiss, R. F., O’Doherty, S., Salameh, P. K., Wang, H. J., Harth, C. M., Muhle, J., and Porter, L. W.: Re-newed growth of atmospheric methane, Geophys. Res. Lett., 35, L22805, https://doi.org/10.1029/2008gl036037, 2008.
Rödenbeck, C.: Estimating CO2 sources and sinks from atmo-spheric mixing ratio measurements using a global inversion of atmospheric transport, Technical Report 6, Max Planck Institute for Biogeochemistry, Jena, Germany, 2005.
Rodgers, C. D. and Connor, B. J.: Intercomparison of remote sounding instruments, J. Geophys. Res.-Atmos., 108, 4116, https://doi.org/10.1029/2002JD002299, 2003.
Saad, K. M., Wunch, D., Deutscher, N. M., Griffith, D. W. T., Hase, F., De Mazière, M., Notholt, J., Pollard, D. F., Roehl, C. M., Schneider, M., Sussmann, R., Warneke, T., and Wennberg, P. O.: Seasonal variability of stratospheric methane: implica-tions for constraining tropospheric methane budgets using total column observations, Atmos. Chem. Phys., 16, 14003–14024, https://doi.org/10.5194/acp-16-14003-2016, 2016.
Schaefer, H., Fletcher, S. E. M., Veidt, C., Lassey, K. R., Brails-ford, G. W., Bromley, T. M., Dlugokencky, E. J., Michel, S. E., Miller, J. B., Levin, I., Lowe, D. C., Martin, R. J., Vaughn, B. H., and White, J. W. C.: A 21st-century shift from fossil-fuel to biogenic methane emissions indicated by13CH4, Science, 352, 80–84, 2016.
Sepúlveda, E., Schneider, M., Hase, F., Barthlott, S., Dubravica, D., García, O. E., Gomez-Pelaez, A., González, Y., Guerra, J. C., Gisi, M., Kohlhepp, R., Dohe, S., Blumenstock, T., Strong, K., Weaver, D., Palm, M., Sadeghi, A., Deutscher, N. M., Warneke, T., Notholt, J., Jones, N., Griffith, D. W. T., Smale, D.,
Brails-Z. Wang et al.: Contributions of the troposphere and stratosphere to CH4model biases 13295
ford, G. W., Robinson, J., Meinhardt, F., Steinbacher, M., Aalto, T., and Worthy, D.: Tropospheric CH4 signals as observed by NDACC FTIR at globally distributed sites and comparison to GAW surface in situ measurements, Atmos. Meas. Tech., 7, 2337–2360, https://doi.org/10.5194/amt-7-2337-2014, 2014. Sherlock, V., Connor, B., Robinson, J., Shiona, H.,
Smale, D., and Pollard, D.: TCCON data from Lauder, New Zealand, 125HR, Release GGG2014R0, https://doi.org/10.14291/tccon.ggg2014.lauder02.R0/1149298, 2014.
Sussmann, R. and Rettinger, M.: TCCON data from Garmisch, Germany, Release GGG2014R0, TCCON data archive, hosted by the Carbon Dioxide Information Analysis Center, Oak Ridge National Laboratory, Oak Ridge, Tennessee, USA, https://doi.org/10.14291/tccon.ggg2014.garmisch01.R0/1149299, 2014.
Sussmann, R., Ostler, A., Forster, F., Rettinger, M., Deutscher, N. M., Griffith, D. W. T., Hannigan, J. W., Jones, N., and Pa-tra, P. K.: First intercalibration of column-averaged methane from the Total Carbon Column Observing Network and the Net-work for the Detection of Atmospheric Composition Change, Atmos. Meas. Tech., 6, 397–418, https://doi.org/10.5194/amt-6-397-2013, 2013.
Turner, A. J., Jacob, D. J., Wecht, K. J., Maasakkers, J. D., Lund-gren, E., Andrews, A. E., Biraud, S. C., Boesch, H., Bowman, K. W., Deutscher, N. M., Dubey, M. K., Griffith, D. W. T., Hase, F., Kuze, A., Notholt, J., Ohyama, H., Parker, R., Payne, V. H., Sussmann, R., Sweeney, C., Velazco, V. A., Warneke, T., Wennberg, P. O., and Wunch, D.: Estimating global and North American methane emissions with high spatial resolution us-ing GOSAT satellite data, Atmos. Chem. Phys., 15, 7049–7069, https://doi.org/10.5194/acp-15-7049-2015, 2015.
Wang, Z., Deutscher, N. M., Warneke, T., Notholt, J., Dils, B., Grif-fith, D. W. T., Schmidt, M., Ramonet, M., and Gerbig, C.: Re-trieval of tropospheric column-averaged CH4mole fraction by solar absorption FTIR-spectrometry using N2O as a proxy, At-mos. Meas. Tech., 7, 3295–3305, https://doi.org/10.5194/amt-7-3295-2014, 2014.
Washenfelder, R. A., Toon, G. C., Blavier, J.-F., Yang, Z., Allen, N. T., Wennberg, P. O., Vay, S. A., Matross, D. M., and Daube, B. C.: Carbon dioxide column abundances at the Wisconsin Tall Tower site, J. Geophys. Res., 111, D22305, https://doi.org/10.1029/2006jd007154, 2006.
Wofsy, S. C., Daube, B. C., Jimenez, R., Kort, E., Pittman, J. V., Park, S., Commane, R., Xiang, B., Santoni, G., Jacob, D., Fisher, J., Pickett-Heaps, C., Wang, H., Wecht, K., Wang, Q.-Q., Stephens, B. B., Shertz, S., Watt, A. S., Romashkin, P., Cam-pos, T., Haggerty, J., Cooper, W. A., Rogers, D., Beaton, S., Hen-dershot, R., Elkins, J. W., Fahey, D. W., Gao, R. S., Moore, F., Montzka, S. A., Schwarz, J. P., A. Perring, E., Hurst, D., Miller, B. R., Sweeney, C., Oltmans, S., Nance, D., Hintsa, E., Dut-ton, G., Watts, L. A., Spackman, J. R., Rosenlof, K. H., Ray, E. A., Hall, B., Zondlo, M. A., Diao, M., Keeling, R., Bent, J., Atlas, E. L., Lueb, R., and Mahoney, M. J.: HIPPO Merged 10-second Meteorology, Atmospheric Chemistry, Aerosol Data (R_20121129). Carbon Dioxide Information Analysis Center, Oak Ridge National Laboratory, Oak Ridge, Tennessee, USA, Release 20121129, https://doi.org/10.3334/CDIAC/hippo_010, 2012.
Worden, J., Kulawik, S., Frankenberg, C., Payne, V., Bowman, K., Cady-Peirara, K., Wecht, K., Lee, J.-E., and Noone, D.: Profiles of CH4, HDO, H2O, and N2O with improved lower tropospheric vertical resolution from Aura TES radiances, At-mos. Meas. Tech., 5, 397–411, https://doi.org/10.5194/amt-5-397-2012, 2012.
Wunch, D., Wennberg, P. O., Toon, G. C., Keppel-Aleks, G., and Yavin, Y. G.: Emissions of greenhouse gases from a Noth American megacity, Geophys. Res. Lett., 36, L15810, https://doi.org/10.1029/2009GL039825, 2009.
Wunch, D., Toon, G. C., Blavier, J.-F. L., Washenfelder, R., Notholt, J., Connor, B. J., Griffith, D. W. T., Sherlock, V., and Wennberg, P. O.: The Total Carbon Column Observing Network (TCCON), Philos. T. R. Soc. A, 369, 2087–2112, https://doi.org/10.1098/rsta.2010.0240, 2011.
Wunch, D., Toon, G. C., Sherlock, V., Deutscher, N. M., Liu, X., Feist, D. G., and Wennberg, P. O.: The Total Carbon Column Observing Network’s GGG2014 Data Version, https://doi.org/ 10.14291/tccon.ggg2014.documentation.R0/1221662, 2015.