HAL Id: hal-02630233
https://hal.inrae.fr/hal-02630233
Submitted on 27 May 2020
HAL is a multi-disciplinary open access
archive for the deposit and dissemination of
sci-entific research documents, whether they are
pub-lished or not. The documents may come from
teaching and research institutions in France or
abroad, or from public or private research centers.
L’archive ouverte pluridisciplinaire HAL, est
destinée au dépôt et à la diffusion de documents
scientifiques de niveau recherche, publiés ou non,
émanant des établissements d’enseignement et de
recherche français ou étrangers, des laboratoires
publics ou privés.
Helping farmers to reduce herbicide environmental
impacts
F. Le Bellec, A. Velu, P. Fournier, Sandrine Le Squin, S. Michels, D. Tendero,
Christian Bockstaller
To cite this version:
F. Le Bellec, A. Velu, P. Fournier, Sandrine Le Squin, S. Michels, et al..
Helping farmers to
reduce herbicide environmental impacts.
Ecological Indicators, Elsevier, 2015, 54, pp.207-216.
EcologicalIndicators54(2015)207–216
ContentslistsavailableatScienceDirect
Ecological
Indicators
jou rn al h om ep a g e :w w w . e l s e v i e r . c o m / l o c a t e / e c o l i n d
Helping
farmers
to
reduce
herbicide
environmental
impacts
F.
Le
Bellec
a,∗,
A.
Vélu
a,
P.
Fournier
b,
S.
Le
Squin
c,
T.
Michels
a,
A.
Tendero
d,
C.
Bockstaller
e aCIRAD,UPRHortSys,F-97455Saint-Pierre,FrancebCIRAD,UPR26,F-97455Saint-Pierre,France cCIRAD,UMRPVBMT,F-97410Saint-Pierre,France dCIRAD,UPRAIDA,F-97410Saint-Pierre,France
eINRA,UMR1121INPL/ENSAIA/INRA,F-68021Colmar,France
a
r
t
i
c
l
e
i
n
f
o
Articlehistory: Received21March2014
Receivedinrevisedform10February2015 Accepted12February2015 Keywords: Herbicides Environmentalindicator Decision–supportTool Field
Bestmanagementpractice Tropicalclimate CART
a
b
s
t
r
a
c
t
Whilepesticideshelptoeffectivelycontrolcroppests,theircollateraleffectsoftenharmtheenvironment. OntheFrenchislandofReunionintheIndianOcean,over75%ofthepesticidesusedareherbicides andtheyareregularlydetectedinwater.Agri-environmentalmodelsandpesticideriskindicatorscan beusedtopredictandtohelppesticideuserstoreduceenvironmentalimpacts.However,whilethe complexityofmodelsoftenlimitstheirusetothefieldofresearch,pesticideriskindicators,whichare easiertoimplement,donotexplicitlyidentifythetechnicalleversthatfarmerscanactupontolimit suchtransfersontheirscaleofaction(thefield).Theaimofthisarticleistocontributetodeveloping adecisionsupporttooltoguidefarmersinimplementingrelevantpracticesregardingthereductionof pesticidetransfers.Inthisarticle,weproposeamethodologybasedonclassificationandregressiontrees. Weappliedourmethodologytoapesticideriskindicator(I-PHYindicator)foridentifyingtheimportance ofthevariables,theirinteractionsandrelativeweightincontributingtothescoreoftheindicator.We appliedourmethodologytotheassessmentoftransferriskslinkedtotheuseof20herbicidesapplied toallsoilsinReunionandaccordingtodifferentclimate,plotmanagementandproductapplication scenarios(4096scenariostested).Weconstructedregressiontreeswhichidentified,foreachherbicide oneachsoiltype,thecontributionmadebyeachinputvariabletotheconstructionoftheindicatorscore. Thetreeisrepresentedgraphically,andthisaidsexplorationandunderstanding.The20herbicideswere dividedinto3groupsthatdifferedthroughthemaincontributingvariabletotheindicatorscore.These variableswerealltechnicalleversavailabletofarmerstolimittransferrisks.Thesetreesthenbecome decisionsupporttoolsspecifictoeachpesticideuser,enablingthemtotakeappropriatedecisionswith aviewtoreducingpesticideenvironmentalimpacts.
©2015ElsevierLtd.Allrightsreserved.
1. Introduction
Whilepesticideshelpineffectivelycontrollingthemaincrop pests(includingweeds),theircollateraleffectsareoftenharmful tohumanhealth(Pedlowskietal.,2012)andmoregenerallyto biodiversity(Pedlowskietal.,2012;Reichenbergeretal.,2007). AccordingtotheFAO (FoodandAgricultureOrganizationofthe United Nations), based on statistics from 58 countries, almost 43% of thepesticidevolumes appliedworldwide in 2010were herbicides (FAOSTAT, 2013). On the French island of Reunion in the western Indian Ocean (located at 21◦06S, 55◦36E),the predominanceofherbicidesisevenmoremarked.In2011,75%of thepesticidevolumessoldwereherbicides(Maillary,2012).The
∗ Correspondingauthor.Tel.:+262262969587. E-mailaddress:[email protected](F.LeBellec).
sustainabledevelopmentobjectivesoftheislandarespearheaded bytheParcNationaldelaRéunion(70%oftheisland’sareabelongs totheUNESCOWorldHeritageList)andencompassthereduction ofsurfacewaterandgroundwatercontamination.Indeed,in2010, outof21 activeingredientsfoundin thewatersof Reunion,17 wereherbicidesortheirdegradationproducts(Badat,2011).Such contaminationcanbelinkedtopooragriculturalpractices(wrong choiceofherbicide,equipmentorapplicationconditions,etc.)but alsotolocalpedoclimaticandtopographicalconditions(Oliverand Kookana,2006;Davisetal.,2011;Mottesetal.,2013),whichcan varysubstantiallyintheTropics.Forexample,inReunion,rainfall variesfrom600to7000mmyear−1andslopesfrom0to45%.Inthe circumstances,replacingoneherbicidebyanotherand/or appro-priateapplicationconditionswouldhelptolimitenvironmental impacts(Reichenbergeret al.,2007).Decision–supporttoolsare neededtohelpfarmersidentifyrelevanttechnicalleverstodeal withthisissueofreducingwatercontaminationbyherbicides.
http://dx.doi.org/10.1016/j.ecolind.2015.02.020
Thedegreeofherbicidetransportintheenvironmentdepends onseveralfactors,suchastheapplicationrate,herbicide persis-tenceand mobility,rainfall,topography, andclimate(Lin etal., 1999).Pesticidesinsoilaresubjecttosorptionaswellasseveral biologicalandchemical degradationmechanisms.Theseinvolve chemical, microbial, and photodecomposition, which lead to a decreaseinpesticideconcentrationsinthesoil.Pesticidesmaybe transportedtodifferentpartsoftheenvironmentbyvolatilization, runofferosion,andleaching.Transportbyrunoffandleachingmay causethecontaminationofsurfacewaterandgroundwater.Many modelscanbeusedtosimulatethesedifferentpollutionprocesses (Mottesetal.,2013)buttheircomplexityoftenlimitstheiruseto thefieldofresearchandtospecificassessmentsituations(Voltz etal.,2005).Manypesticideenvironmentalriskindicatorsbasedon operationalmodelsthatareeasiertoimplementhavebeen devel-opedforpredictingorassessingtheenvironmentalriskslinkedto pesticideuse(Bockstalleretal.,2009;Payraudeauand Gregoire, 2012).Thesepesticideriskindicatorscanbeusedtoassessthese risks,whichareoftendifficulttoperceiveasawhole(Payraudeau andGregoire,2012;Reusetal.,2002).However,astheseindicators arelessaccuratethanmodels,Voltzetal.(2005)recommended usingthemasadecision–supporttooltoprioritizerisksituations ratherthanasatooltopredictpesticideflows.
Thesepesticiderisk indicatorscombinea moreor lesslarge numberofvariablesandconsideragriculturalpracticesand appli-cationconditionstovaryingdegrees(Devilliersetal.,2005).All indicatorsproduceascoretoreflectenvironmentalriskor perfor-mance;thisoutcomeisgenerallytheonlyresult.Indeed,indicators donotexplicitlyprovideinformationontheleversforactiontobe acteduponinordertoimprovepractices.Thelargenumberof vari-ablesusedandtheirinteractions,butalsotheaggregationmethods andtheoftenincompletesensitivityanalysesoftheseindicators (Devillersetal.,2005),makethesearchforleversacomplex busi-ness.Thisfindingcontributestothe“blackbox”imagethatsuch toolsareoftencriticizedfor;thisisalsowhytheseindicatorsare rarelydecision–supporttoolsforfarmers(Reusetal.,2002).
Inthisarticle,weproposesomesolutionsforanalysingthese leverswhich,toourknowledge,haveyettobeexplored.Weapplied ourmethodology,basedonclassificationandregressiontrees,to theI-PHYindicatoroftheassessmentmethodINDIGO(Bockstaller etal.,2009).Wetestedthisindicatorandourmethodtoassessthe environmentalrisksassociatedwiththeapplicationof20herbicide activeingredientsusedin Reunion.We thendiscussourresults andourmethod toidentifyandprioritize importancevariables forthisindicatorinordertomakeitadecision–supporttoolfor farmers.
2. Materialsandmethods
2.1. I-PHYindicator
ThepesticideriskindicatorI-PHYwasdevelopedinparallelto otherenvironmentalindicatorsfortheassessmentmethodINDIGO (Bockstalleretal.,2009).Thescoreoftheindicatorwaspublishedby
VanderWerfandZimmer(1998)andenhanced,adaptedandtested forarablefarming(Bockstalleretal.,2008).Sincethen,I-PHYhas beenadaptedtootherfarmingsystemssuchaswinegrowing,fruit production,fieldvegetableproduction,palmtrees,etc.Inthelast 5years,theI-PHYindicatorhasbeenusedinmorethan100cases inFrancebyadvisersmainlyworkingontheassessmentofrisks atfield/farmlevelorworkingonthedevelopmentofinnovative croppingsystems(Bockstalleretal.,2008).
Calculationoftheindicatorisbasedonfourcomponents respec-tivelyassessingtherisklinkedtotheamountofactiveingredient (a.i.)appliedandtheriskforgroundwater,surfacewaterandair.
Inasecondstep,anoverallindicatoriscalculated.Threetypesof inputvariablesareused(Table1):
1.Pesticidepropertiesrelatedtoenvironmentalfateortothe eco-toxicologyeffect,
2.Site-specificconditions(e.g.runoffsensitivity),
3.Characteristicsofpesticideapplication(e.g.rateofapplication). Afuzzyexpertsystemis usedtoaggregateallthese hetero-geneous variables into indicator modules and to subsequently aggregate these modules into a synthetic indicator. By using fuzzy subsets the effect of a knife-edge limit of a given class can be avoided. Output values for each module, as well as for the overall indicator, are expressed on a qualitative scale used in the INDIGO method: between 0 (maximum risk) and 10 (no risk)with a referencevalue of 7 (maximumacceptable risk).
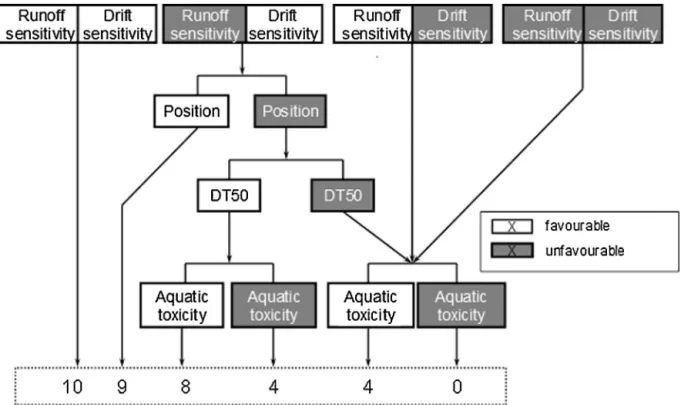
Fig.1showsanexampleforgroundwaterriskwherethemain weightis given toa pesticide propertyvariable (ground water ubiquityscore–GUS)(Gustafson,1989),withlessweightgiven toposition(cropinterceptionhere)andsoilsensitivityto leach-ing.Aggregationrulesaredefinedaccordingtoknowledgeabout theprocessesforeachmodule.Itshouldbenotedthatforsurface water(Fig.2),thesensitivityofthefieldtorunoffanddriftplaysa majorroleincomparisonwiththepesticideproperty(half-lifeof a.i.(DT50)variable).Thisaggregationmethodenablestocopewith casesofcompensationbetweeninputvariablesaswellascasesof non-compensation(Sadoketal.,2008).Forthegroundwater sur-facewaterandaircomponentofI-PHY,aggregationrulesintegrate knowledgeontheprocesses.Compensationbetweenvariablesmay occuronlywhenavariablebelongingtothe‘favourable’class lim-itspesticide transfer.For instance,this is the case of ‘position’ variable that indicatesthat pesticidemay be in a position out ofreachforleachingorrunoff byinterceptionbycropcoveror incorporationinto soil(seeFigs. 1and 2).For theenvironment componentofI-PHY(Fig.3),weassumedthatlowsprayingrate compensatesa hightransfer risk.Thisis based onsome litera-turedata(e.g.Battaglinet al.,2000;De Lafontaineet al.,2014) andpesticideregistrationdata(Tomlin,2006).Conversely,wedo notacceptahighlevelofcompensationbetweenthethreerisk components,groundwatersurfacewaterandair.Weconsidered thatwhenoneisunfavourableandtherateishigh,thesituation isunacceptableforstakeholders.Thisisgivenbyalowscoreof 2out10fortheenvironmentcomponentofI-PHY(Fig.3), show-ingahighrisk.Finally,inallcomponentsofI-PHY,thetoxicityor ecotoxicityvariablecanincreasebutnotdecreasetherisk.In con-clusion,innocase cantotal compensationoccurbetweeninput variables.
In order to carry out our study, we constructed some use scenarios for20 activeingredientsfor thewholearableareaof Reunion.Thesescenarioswereconstructedfromtheknown val-uesrelatedtothepesticidepropertiesandthecharacteristicsof thesoil(Table1,variables1–12)andfromvaluesrelatedtothe useofthepesticide,consideredbythescenarios(Table1,variables 13–27).
2.2. Choiceofactiveingredientsstudiedandtheircharacteristics We studied 20 herbicide active ingredients (Table 2). Six-teen active ingredients were herbicides marketed in Reunion between 2009 and 2011, three of which (glyphosate, 2,4-D and S-metolachlor) alone amounted to 80% of herbicide sales (Maillary,2012).Threeotheractiveingredients(isoxaflutole, thien-carbazone and nicosulfuron), earmarked to eventually replace some active ingredients, were also studied. Lastly, atrazine
F.LeBellecetal./EcologicalIndicators54(2015)207–216 209
Table1
VariablesneededforI-PHYcalculation,theirshortnameusedforthispaper.
Nr. Variables Valuestested
Shortname Fixed Favourable Unfavourable 1 Henry’slawconstantat25◦C(Pam3mol−1) KH Pesticide – –
2 Half-lifeofactiveingredient(day−1) DT50 Pesticide – –
3 Acceptabledailyintake(mgkg−1j−1) ADI Pesticide – –
4 Aquatox(EC50,mgL−1) Aquatox Pesticide – –
5 Leachingpotentialindex GUS Pesticide – –
6 Organiccarbonsorption(mL−1) Koc Pesticide – –
7 Soiltype(sandy,loamy,clayey) Soiltype Soil – –
8 Soildepth(<30,30–60,60–90,>90)(cm) Soildepth Soil – –
9 pH(<5,5–5.5,5.5–6,6–6.5,>6.5) pH Soil – –
10 Organiccarboncontent(<2,2–5,>5)(%) OC Soil – –
11 Absence/existenceofswellingclay Clay Soil – –
12 Slop(0,<5,5–10,>10)(%) Slop Soil – –
13 Drift-reducingnozzle? Reducingnozzle Yes – –
14 Maintenanceofnozzle? Maintenance Yes – –
15 Isthesoilisdraining? Draining No – –
16 Isthesoilfiltering? Filtering – No Yes
17 Distancebetweenthewaterwayandtheplot Water-dist – >15m <5m
18 Stateofthewaterway Water-state – Dry Fullofwater
19 Dryorhumidweather Weather – Humid Dry
20 Numberofdayswithoutrainfall(>5mm) Rainfall – >DT50a.i. 0
21 Plotcovercropstate Cover-state – Total Withoutplants
22 Covercropoccupation(%) Cover-occup. – 100 0
23 Numberof10-dayperiodsbetweenthetreatmentand thelastmower
Mower – >4 <1
24 Non-cultivatedplantstripsdownslope(m) Plantstrip – <12m >6m 25 Applicationpositionoftheproduct Position – Intothesoil Onbaresoil
26 Typeofspray Spray – Hose Pressureandairblast
withaxialfanspray
27 Typeofspraynozzle Nozzle – Othertypesofnozzle Classicslit
Valuestested:variables1–12fixedbypesticideandsoilproperties;13–15fixedbyReunionIslandconditions;16–27testedattheirfavourableandunfavourablesubsetsin thescenarios.ThesubsetsweredeterminedduringI-PHYconstruction.DT50:half-lifeofactiveingredient(a.i.).GUS:groundwaterubiquityscore(Gustafson,1989)where GUS=log10(DT50)×[4−log10(Koc)],thisindexindicatestheriskofpesticidetransferstogroundwaters.TheKocvalueisameasureofhowtightlypesticideisretainedby theorganicfractioninsoils.
Fig.1.DecisiontreeofthegroundwatercomponentofI-PHY,GUS:groundwaterubiquityscore(Gustafson,1989)whereGUS=log10(DT50)×[4−log10(Koc)]whereDT50 isthehalf-lifeoftheactiveingredient,Koc:soilsorptioncoefficient,position;functionofcropcover,leachingsensitivityfunctionofsoilproperties.ADI:acceptabledaily intakeoftheactiveingredient.
was added to our study as a control for past phytosanitary uses.
Pesticidepropertiesrelatedtoenvironmentalfateortothe eco-toxicologyeffectforI-PHYscorecalculationwere(Table1): -Henry’slawconstant(KH)which characterizestheabilityofa
substanceinasolutiontovolatilize.
-Thehalf-life(DT50)ofanactiveingredientprovidesinformation onthetimetakentobreakdownhalfthequantityoftheactive ingredientused.
-Acceptabledailyintake(ADI)indicatestoxicityforhumans. -Aquatox,thisvariableresultsfromthetoxicityoftheactive
ingre-dientforaninvertebrateaquaticorganism(Daphniamagna)after 48h.
Fig.2.DecisiontreeofthesurfacewatercomponentofI-PHY,runoffsensitivityasafunctionofslope,soilproperties,driftsensitivityasafunctionofdistancetosurface water,position;asafunctionofcropcover,DT50:half-lifeoftheactiveingredient,aquatictoxicityofactiveingredientforDaphniamagna.
-Groundwater ubiquity score (GUS). GUS is an index used to estimatethepotentialofpesticidestocontaminate groundwa-ter(Gustafson,1989).GUS=log10(DT50)×[4−log10(Koc)];the higher theGUS value,the higher the potential for pesticides tomovetowardsgroundwater.GUSis aprettysimple indica-torbutothervariablesmayexplainthistransferofpesticidesto groundwater(e.g.soiltype,pH,mattercontent...);theyarealso consideredbyI-PHYwhentheGUSvalueisunfavourable(Fig.1).
Thecharacteristicsoftheactiveingredientscomefromthe Pes-ticidePropertiesDatabase(UniversityofHertfordshire,2013)and aregiven inTable 2.Theactive ingredientswerestudied sepa-ratelywithoutconsideringanypossiblecombinations(e.g.such as in commercial specialities) at the approved rate for weed-ing(activeingredientrateha−1)(Ministèredel’agricultureetde l’agroalimentaire,2013).Finally,wedidnotstudythemetabolites oftheactiveingredientsbecauseI-PHYdoesnotallowit.
Fig.3. DecisiontreeoftheenvironmentcomponentofI-PHY,Rgw,Rsw,Rair:respectivelygroundwater,surfacewaterandaircomponent,rate:activeingredientrateper ha.
F.LeBellecetal./EcologicalIndicators54(2015)207–216 211
Table2
Characteristicsofthe20activeingredientsstudied.ThecharacteristicscomefromthePesticidePropertiesDatabase(UniversityofHertfordshire,2013).
Activeingredient Herbicides
KH(25◦C)
(Pam3mol−1) DT50(days) ADI(mgkg −1
day−1)
Aquatox (mgl−1)
GUS Registeredrate (gha−1)
Quantitiessold 2009–2011(kg)
2,4-D 1.30E−05 10 5.00E−02 1.00E+02 1.62 960 50,531
Aclonifen 3.03E−03 117 7.00E−02 1.20E+00 0.30 2700 447
Asulam 1.31E−10 3.2 3.60E−01 5.79E+01 1.36 3600 5539
Atrazine 1.20E−07 75 2.00E−02 8.50E+01 3.30 1500 Removed
Bentazone 7.20E−05 13 1.00E−01 6.40E+01 2.30 1218 92
Diquat 5.00E−12 1000 2.00E−03 2.20E+00 −2.68 800 1900
Fluazifop-P 4.90E−02 1 1.00E−02 6.20E-01 0.00 250 126
fluroxypyr 1.69E−10 13.5 8.00E−01 1.00E+02 2.42 200 659
Glufosinate 8.96E−09 7.4 2.10E−02 6.68E+02 1.06 750 2105
Glyphosate 4.20E−07 12 3.00E−01 4.00E+01 0.91 2160 52,361
Isoxaflutole 1.87E−05 2 2.00E−02 1.50E+00 0.59 99.75 New
Linuron 2.50E−06 48 3.00E−03 3.10E-01 2.03 750 169
Mesotrione 5.10E−07 32 1.00E−02 6.22E+02 3.43 150 2141
Metribuzin 2.00E−05 11.5 1.30E−02 4.90E+01 2.57 875 7678
Nicosulfuron 1.48E−11 26 2.00E+00 9.00E+01 3.79 22,5 New
Oxadiazon 3.80E−02 502 3.60E−03 2.40E+00 2.40 2400 98
Pendimethalin 2.73E−03 90 1.25E−01 2.80E-01 -0.39 1200 4245
S-metolachlor 2.40E−03 45 1.00E−01 2.35E+01 2.72 1920 21,228
Thiencarbazone 7.88E−13 11.6 1.20E+00 9.86E+00 2.13 40 New
Triclopyr 2.90E−03 39 3.00E−02 1.31E+02 3.69 3600 5131
Favourablesubset* >2.63E−6 <1 >1 >100 <1.8
Unfavourablesubset* <2.63E−4 >30 <0 <0.01 >2.8
Fuzzylogic* ]2.63E−6;
2.63E−6[
]0;30[ ]0;1[ ]0.01;100[ ]1.8;2.8[
KH:Henry’slawconstantat25◦C(Pam3mol−1)whichcharacterizestheabilityofasubstanceinasolutiontovolatilize,DT50:half-lifeofactiveingredient(day−1),provides
informationonthetimetakentobreakdownhalfthequantityoftheactiveingredientused,ADI:acceptabledailyintake(mgkg−1j−1)indicatestoxicityforhumans,Aquatox:
thisvariableresultsfromthehighesttoxicity(EC50,mgL−1)oftheactiveingredientforaninvertebrateaquaticorganism(Daphniamagna)after48h,GUS:groundwater
ubiquityscore(Gustafson,1989)whereGUS=log10(DT50)×[4−log10(Koc)],thisindexindicatestheriskofpesticidetransferstogroundwaters.TheKocvalueisameasure ofhowtightlypesticideisretainedbytheorganicfractioninsoilsandtheregisteredrate:theapproveddoseforweeding(gha−1)(Maillary,2012).
*SubsetvalueforeachvariableinI-PHY(VanderWerfandZimmer,1998).
2.3. Variablescharacterizingthesoilsofthestudysite
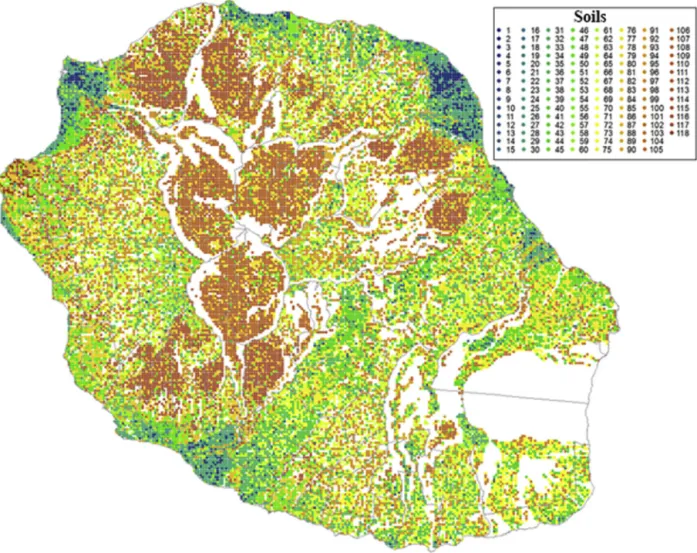
Pesticidemobilityandfateinasoilareinfluencedbysorption anddegradationprocesses.Theadsorptionofapesticideincreases withincreasedsoilorganiccarbonandclaycontent,andcanslow itsmovementinsoil.Degradationprocessesdependonthesoiltype andenvironmentalconditions.Inaddition,theextentofleaching andrunoffisinfluencedbythesoilproperties,slopeandsoildepth. Toaccountfortheseprocesses,I-PHYconsiders7variables char-acterizingsoil(Table1):soiltype,soildepth,pH,organiccarbon content,absenceofswellingclay,slopeandfilteringnatureofthe soil.Fig.4showsthemappingofallthearablesoilsontheisland ofReunion,carriedoutwithArcGISsoftware(ESRI,ArcMap10.0, 2013).Thismapwasobtainedbysuperposing6thematiclayers cor-respondingtothevariablescharacterizingsoil,exceptthefiltering natureofthesoil;itcouldnotbeincorporatedintothismapthrough lackofcartographicaldata.Wethereforeconsidereditasavariable ofthescenariotested(seeSection2.4.Wethendividedthetotal arableareaoftheislandintogeographicalunitsof5haeach char-acterizedbythecombinationofthe6soilvariablesderivedfromthe centrepointofeachunit.Themapcomprises34,645geographical unitsfromwhich118distinctsoilcombinationswereidentified. 2.4. Creationofactiveingredientusescenarios
Twenty-sevenvariablesareneededtocalculatetheI-PHYscore (Table1).Inordertocarryoutourstudy,wecreatedactive ingre-dientusescenariosfromthevariablesneededtotakeintoaccount thediversityofpossibleapplicationconditions.Therewere15of thesevariables(Table1,variables16–27)giventhattheother12 arelinkedtopesticideandsoilproperties(Table1,variables1–12). Eachvariabletakes2thresholdvalues(unfavourableorfavourable) whichwereusedtocreatethescenarios.Inordertolimitthe num-berofscenarios,2variablesrelated tothecharacteristicsofthe equipmentused(Nos.13and14,Table1)wereblockedattheir
favourablethresholdvalues,whichamountedtoregulatory con-ditionsforgoodagriculturalpractices.Likewise,variableno.15, “draining”wastestedwithitsfavourablethresholdvalueasitwas a practicenotfoundinReuniongiven themajortopographyof theisland enabling suchdrainagenaturally. We therefore con-structedouractiveingredientusescenarioswiththeremaining12 variables,consideringtheirtwothresholdvalues.Thisgave4096 usescenariosforeachpesticidetested(212).Thescenarioswere
recordedandprocessedinadatabasedevelopedwithAccess®
soft-ware(MicrosoftCorporation2010). 2.5. Statisticalanalyses
Inthestatisticalanalysis,wesoughttoprioritizetheimportance ofthevaluesrelatedtotheuseofthepesticideintheconstruction oftheI-PHYscoreinordertodeterminewhichofthemshouldbe acteduponasaprioritytoincreasethescoreoftheindicator.The initialdatasetincludedthe4096usescenariosappliedtoeachofthe 118soils,foratotalof483,328I-PHYscoresperactiveingredient. AllthestatisticalanalyseswerecarriedoutwithRsoftware(Version 2.15.2,RDevelopmentCoreTeam2013,Vienna,Austria).
Firstly,wesoughttoreducethedatasetforeasierinterpretation oftheresults.Wedidthisusinghierarchicalclusterclassification accordingtotheWardcriterionovertheEuclidiandistance.The resultsofthisstageenabledustoidentifysomedifferentsoiltypes leadingtothesameI-PHYscoreforthesamescenario.Wetherefore reducedthedatasetaccordingly,excludingallthedoublets.
Secondly,theI-PHYscorevariation(calledgain)wascalculated foreachsoiltype,eachactiveingredient,andeachvariable.The gainwascalculatedfromthedifferencebetween2equal scenar-ios,exceptthevalueofthevariableanalyzed.Ifavariablehadno gain,thevariableandthe2scenariosweredeletedfromthedataset. Then,basedonthisreduceddataset,weusedCART(Breimanetal., 1984),astatisticalmethodthatsuccessivelydividesup observa-tions,bybinarydivisions,intosubsets(callednodes),whichare
Fig.4. Maprepresentationofthe118soilscharacterizedby6variables:typeofsoil,depth,pH,organicmatter,swellingclayandslope.Noneofthemisprevailinginthis territory.Thewhitezonesarenon-arableareas(volcano,riverbed,etc.)createdwithArcMAPsoftware(ESRI,2013).
increasinglyuniforminrelationtoatargetvariable;inthiscase theI-PHYscore.Theresultsweredisplayedintheformofa regres-siontree(Fig.5).Thequalityofthedivisionswasmeasuredbythe decreaseinthemeansquarederrorinducedbythedivision.The selectedvariablewastheonethatinducedthelargestdecrease inmeansquarederror.Theprocedurewasrepeateduntilsubsets wereobtainedthathadveryfewobservations.Iftheconditionof thisselectedvariablewastrue(unfavourablesubsetofvariable,
Table1),theinitialobservationsweresenttotheleftoftheparent node.Iftheconditionofthisselectedvariablewasfalse(favourable subsetofvariable,Table1),theobservationsweresenttotheright oftheparentnode.Finally,theI-PHYminscorecorrespondedto thescenariowhereallthevariables wereintheirunfavourable conditions,i.e.the poorestapplication conditionsfor theactive ingredient.TheI-PHYminimumscoreisgivenatthebottomleftof theregressiontree(Fig.5).Conversely,theI-PHYmaximumscore correspondedtothescenariowhereallthevariableswereintheir favourableconditions,i.e.thebestapplicationconditionsforthe activeingredient.TheI-PHYmaxscoreisgivenatthebottomright oftheregressiontree(Fig.5).
Lastly,wecomparedtheimportanceofthevariablesinthe con-structionoftheI-PHYscorebetweenactiveingredientsandallsoils combined.Wedidthisusingtherandomforestsstatisticalmethod (Breiman,2001).Thismethodisbasedontheaggregationof sev-eraltreesdisruptedbydoublerandomization,ofboththesample (bootstrapsample,i.e.withthedrawingandreturningofn observa-tionsoutoftheinitialnobservations),butalsosomeexplanatory
variables(sub-setsofexplanatoryvariablesselectedfromallthe initialvariables).Aregressiontreewasconstructedfromallthese samples(500inourcase),witharandomdrawofthesub-setsof explanatoryvariables (ofthepinitialvariables,p/3weredrawn randomly)tosearchforeachoptimumdivision.Theimportance ofthevariablesintheconstructionoftheI-PHYwasthendefined bythemeandecreaseinheterogeneity.Asthismeasurementwas notcalculatedonthesamesamplefortheactiveingredients,we roundeditofftoanindexbetween0and100.Theseindexvalues thenenabledustoconstructuniformgroupsofactiveingredients accordingtotheimportanceofthevariablesfortheI-PHYscore usingaprincipalcomponentsanalysis(PCA)followedby hierar-chical ascendantclustering.Lastly, thedifferences inthemean, minimumandmaximumI-PHYscoresforthedifferentgroupswere testedusingKruskal–WallisandWilcoxoncomparisonofmultiple meanstests.
3. Resultsanddiscussion
3.1. ThevalidityofI-PHYscores
Themean,minimum(min)andmaximum(max)I-PHYscores forthe4096scenariostestedonthe118soilsforeachactive ingre-dientarepresentedinTable3.Themeanscoresvariedfrom3.72 (triclopyr)to8.72(thiencarbazone).TheI-PHYminscoresofthe differentactive ingredients variedfrom 2.36(triclopyr)to 6.04
F.LeBellecetal./EcologicalIndicators54(2015)207–216 213
Table3
Theminimum,maximum,roomforprogressbetweenminimumandmaximum,mean(±standarddeviation)oftheI-PHYscoresfor20activeingredients.
Activeingredient I-PHYminimum I-PHYmaximum Roomforprogress(max–min) I-PHYmean
2,4-D 4.78 8.37 3.59 7.25(±0.88) Aclonifen 3.51 6.02 2.51 4.97(±0.73) Asulam 4.60 9.03 4.43 8.30(±0.85) Atrazine 3.63 8.93 5.30 6.04(±1.52) Bentazon 3.98 7.90 3.92 6.28(±0.87) Diquat 4.48 9.21 4.73 7.59(±1.24) Fluazifop-P 4.63 7.54 2.91 6.41(±0.84) Fluroxypyr 5.00 9.50 4.50 6.90(±0.63) Glufosinate 4.92 9.21 4.3 8.29(±0.90) Glyphosate 4.86 9.07 4.21 8.28(±0.85) Isoxaflutole 5.02 8.94 3.92 7.90(±0.87) Linuron 4.37 9.21 4.84 7.55(±1.16) Mesotrione 3.85 9.26 5.41 6.57(±1.51) Metribuzin 3.87 8.11 4.24 6.10(±1.05) Nicosulfuron 4.90 9.51 4.61 7.52(±1.22) Oxadiazon 2.81 4.48 1.67 3.80(±0.39) Pendimethalin 4.24 6.67 2.43 5.78(±0.67) S-metolachlor 3.16 6.19 3.03 4.59(±0.75) Thiencarbazone 5.73 9.60 3.87 8.72(±0.78) Triclopyr 2.36 5.28 2.92 3.72(±0.72)
(fluoxypyr).TheI-PHYmaxscoresvariedfrom4.48(oxadiazon)to 9.60(thiencarbazone).Theseresultsmadeitpossibleatthisstage toidentifysomeactiveingredientsforwhichthescorewasunder theacceptableleveloftheI-PHYindicator(score<7).Tenoutof20 pesticideswereinthiscase.
The question of the validity of the score still remained. In thatrespect,BockstallerandGirardin(2003)andBockstalleretal. (2008)proposedcomparingtheresultsoftheindicatorwith mea-surementsofpesticideconcentrationsinwater.Suchacomparison meansacceptingachangeinstudyscalebutalsoacceptingits lim-itations.Indeed,watercontamination,especiallysurfacewater,is alwaysfoundafteramajorclimateevent(Louchartetal.,2001) while samplingtomonitor water qualityis usually carried out withoutconsideringtheseriskperiods(Voltzetal.,2005).When comparingtheseI-PHYscoreswithwaterqualitymeasurementsin Reunion(Badat,2011),wefoundthat7activeingredients(andtheir associatedmetabolites)studiedinthisarticleaccountedfor72% oftotaldetections(insurfacewatersandgroundwaters):atrazine (56%),metolachlor(8%),bentazon(2%),triclopyr(2%),glyphosate (2%),2,4-D(1.5%)andmetribuzine(0.5%).Apartfrom2,4-Dand glyphosate,theotheractiveingredientshadthelowestmeanand minimumI-PHYvalues.Inaddition,thesameherbicidesare regu-larlyincriminatedinwaterpollutioninmanytropicalortemperate countries(Danieletal.,2002;HaarstadandLudvigsen,2007;Ghosh andSingh,2013).Indeed,2,4-Dandglyphosatealoneaccountfor over2/3ofpesticidesalesinReunion(Maillary,2012).Itislikely thatdetectionofthoseherbicidesinthewatersinReunionisalso theconsequenceofstrongpressurelinkedtothevolumesapplied and/ortoinappropriateculturalpractices.I-PHYcannotconsider thatriskonaterritoryscalebecause,byitsveryconstruction,it assessesrisksonsmallquantitiesofpesticidesappliedonafield scale.However,theI-PHYminvaluesforthesetwoactive ingredi-entswere4.78for2,4-Dand4.86forglyphosate(Table3);these resultsindicateahighriskoftransfertotheenvironmentunder thepoorestapplicationconditions.Thisbriefcomparisonofthe resultsofourstudywithmeasuredcontaminationenablesusto suggestthattheI-PHYindicatorseemsrelevantforidentifyingmost substancespresentingenvironmentalrisks.
3.2. Regressiontreesasdecision–supporttools
The hierarchical cluster classification enabled us to identify somedifferentsoiltypesleadingtothesameI-PHYscoreforthe samescenario.Thisclassificationledto9differentsoiltypesfor
11activeingredients(2,4-D,aclonifen,asulam,diquat,fluazifop-P, glufosinate, glyphosate,isoxaflutole,linuron,pendimethalinand thiencarbazone), 37 soil types for triclopyr and 45 soil types for the last 8 active ingredients studied (atrazine, bentazon, fluroxypyr,mesotrione,metribuzine,nicosulfuron,oxadiazonand S-metolachlor). Then, 496 regression trees wereconstructed (1 regression tree for each type of soil and per activeingredient) usingtheCARTmethod.Noneoftheregressiontreesconstructed wasidentical.Thenumberofnodesmakingupthesetreesnotably determinedtheircomplexity.Fig.5showsthe2,4-Dregressiontree forthemostcommonsoilinReunion;9otherregressiontreesfor9 activeingredientsaregiveninthesupplementarydata(Figs.7–15). Theseregressiontreesenabledustovisualizetheimportanceofthe variablesintheconstructionoftheI-PHYscore.Thescoreatthe topofthetreecorrespondstothemeanofthescenarios,whichis reducedorincreaseddependingontheunfavourableorfavourable thresholdvaluesofthevariablesinvolvedintheconstructionof thetree.The leavesofthetrees (red,orange orgreen squares) indicatethefinalI-PHYscores,withtheminimumscorefurthest leftandthemaximumscorefurthestrightfortheactive ingredi-entonthesoiltypeconsidered.Thedifferencebetweenthesetwo scoreswasusedtoestimatethepossibleroomforimprovement. Thesetreesalsomadeitpossibletovisualizethevariables accord-ingtothegainstheycouldprovide.Themorethevariableislocated nearthetopofthetreethegreaterwasthegainitprovidedinthe constructionoftheI-PHYscore.Fromonesoiltoanother,orfrom oneactiveingredienttoanother,theprioritizationofthese vari-ablesandtheirinteractionsdiffered(seesupplementarydata,Figs. 7–15).
TheCARTmethod(Breimanetal.,1984)isoneofthefew non-parametricmethodsthatofferawayofcomputingtheimportance of variables (Belet al., 2009).Thismethod buildsclassification andregressiontreesforpredictingcontinuousdependentvariables (regression) and categorical predictor variables (classification). CARTprocedureshaveproventobeveryusefulinecologicaland environmentalcontextsbecausetheoutputsareeasilyunderstood (De’athandFabricius,2000).CARTmodelshaveseveraladditional advantagesoverothertechniques:inputdatadonotneedtobe nor-mallydistributed;itisnotnecessaryforpredictorvariablestobe independent;andnon-linearrelationshipsbetweenpredictor vari-ablesandobserveddatacanbemodelled(Beletal.,2009).Thus, classificationandregressiontreesbyCARTrepresentan alterna-tivetomanytraditionalstatisticaltechniques,includingmultiple regression, analysis of variance, logistic regression, log-linear
Fig.5. Regressiontreeof2,4-DforthemostcommonsoilinReunion(soiltype:clayey;soildepth:>90cm;pH:5–5.5;organicmatterrate:2–5%;absenceofswellingclay; slope:>10%;filteringsoil).TheexplanatoryvariablesrepresentedarethoseselectedbytheCARTmethod(seematerialsandmethods).Theytakeontheunfavourablevalue (reddottedbranch)orthefavourablevalue(greencontinuousbranch).Thesedifferentconditionsledtosomemeanscores(I-PHYscores)shownintheleavesofthetree. Foranexplanationofthevariables(spray...),seeTable2.Ascoreover7indicatesasituationwherethepesticidetransferriskisacceptable.
models and linear discriminant analysis (De’ath and Fabricius, 2000).Under theseconditions,regression treescan beused for interactiveexplorationandforthedescriptionandpredictionof patternsandprocesses.Inourcase,regressiontreesenabledusto identifyandprioritizeimportancevariablesfortheI-PHYindicator, foreachherbicideunderourstudyconditions.Thetreeis repre-sentedgraphically,andthisaidsexplorationandunderstanding. Suchananalysisprovesdecisiveforusingthistypeofindicator(Hak etal.,2012)asitmakesitpossibletodeterminetheexactweightof eachofthevariablesmakinguptheindicator(Ferraraetal.,2012). 3.3. Roomformanoeuvretoreduceherbicideenvironmental impacts
Therandomforestsstatisticalmethodwasusedtodetermine theimportanceofthevariables intheI-PHYscoreconstruction. Even though all the variables contributed to this construction exceptthe‘cover-occup’variable(Table4),onlyfourvariableswere verysignificant.Thesewerethe‘spray’,‘water-dist’,‘water-state’ and‘position’variables.However,theimportanceofthesevariables variedwiththepesticide.Thisfirstanalysiscompletedbya princi-palcomponentsanalysisbroughtout3groupsofactiveingredients accordingtotheirvariablesofimportanceintheconstructionofthe I-PHYscores.Thesegroupswererepresentedinthefirstfactorial planeoftheanalysis(Fig.6).Axes1and2explainedover83%ofthis graphicrepresentation.Eachofthe3groupsincludedoneofthe3 activeingredientsmostusedinReunion, sowethereforecalled thesegroupsbytheingredientnames:‘2,4-D’group,‘glyphosate’ groupand‘S-metolachlor’group.Fortheingredientsinthe ‘2,4-D’group,the‘spray’variablewasthemainvariableofimportance intheI-PHYscorethen, toa lesserdegree,the‘water-dist’and
‘water-state’ variables. Conversely, for the ingredients in the ‘glyphosate’group,the2variablesofimportancewere‘water-dist’ and‘water-state’thenthe‘spray’variable.Fortheactive ingredi-entsinthe‘S-metolachlor’group,thevariableofimportancewas
Fig.6. IndividualfactormapofthePCAofimportancemeasurementsforthe vari-ablesofalltheactiveingredients.Thetwoaxesrepresent83%.Threegroupscan bedistinguished,eachrepresentedbyoneofthemostwidelyusedactive ingredi-entsontheislandofReunion:group1:2,4-D,group2:glyphosateandgroup3: S-metolachlor.
F.LeBellecetal./EcologicalIndicators54(2015)207–216 215
Table4
ImportanceofthevariablesintheconstructionoftheI-PHYscore.Thisimportanceiscalculatedwiththerandomforestmethodroundedofftoanindexbetween0and 100.Thestatisticalanalysesbroughtout3groups(PCAgroup)ofactiveingredientsaccordingtotheirvariablesofimportanceintheconstructionoftheI-PHYscorescalled: ‘2,4-D’group,‘glyphosate’groupand‘S-metolachlor’group(S-metointhetable).VariablesneededforI-PHYcalculation:seeTable1.
ActiveIngredient Spray Water-dist Water-state Posi. Cover-state Rain. Mower Filte. Plantstrip Nozzle Weather Cover-occup PCAgroup
2,4-D 37.2 27.1 27.7 1.3 2.7 3.0 0.2 0.0 0.4 0.3 0.0 0.0 2,4-D Aclonifen 52.2 20.7 19.7 2.1 4.2 0.0 0.2 0.0 0.6 0.3 0.0 0.0 2,4-D Asulam 6.8 39.8 41.0 1.8 4.5 5.0 0.2 0.0 0.7 0.2 0.0 0.0 glyphosate Atrazine 12.2 6.2 6.3 68.1 0.5 0.2 4.5 1.9 0.1 0.0 0.1 0.0 S-meto Bentazon 21.8 20.1 20.1 29.2 2.4 2.5 2.6 0.9 0.2 0.2 0.0 0.0 S-meto Diquat 56.0 17.8 17.7 2.5 4.8 0.0 0.2 0.0 0.7 0.3 0.0 0.0 2,4-D Fluazifop-P 67.7 14.2 14.1 0.8 1.3 1.3 0.1 0.0 0.2 0.3 0.0 0.0 2,4-D Fluroxypyr 19.5 18.7 19.1 33.9 2.4 2.5 2.6 0.9 0.2 0.2 0.0 0.0 S-meto Glufosinate 18.1 36.5 35.2 1.8 3.6 4.0 0.2 0.0 0.5 0.2 0.0 0.0 glyphosate Glyphosate 10.3 39.1 39.6 1.6 3.9 4.4 0.2 0.0 0.6 0.2 0.0 0.0 glyphosate Isoxaflutole 35.0 28.5 27.6 1.6 3.1 3.4 0.2 0.0 0.4 0.2 0.0 0.0 2,4-D Linuron 54.9 18.6 18.6 2.7 2.2 2.0 0.5 0.0 0.3 0.3 0.0 0.0 2,4-D Mesotrione 12.0 5.1 5.1 71.5 0.3 0.3 3.4 2.1 0.0 0.0 0.1 0.0 S-meto Metribuzin 13.7 11.3 11.3 57.1 1.0 1.1 3.2 1.0 0.1 0.1 0.1 0.0 S-meto Nicosulfuron 15.8 12.1 11.8 53.4 0.9 1.0 2.0 2.8 0.1 0.1 0.1 0.0 S-meto Oxadiazon 15.6 13.8 14.1 50.5 4.3 0.0 0.4 0.6 0.6 0.1 0.0 0.0 S-meto Pendimethalin 40.3 26.5 26.3 1.5 3.0 1.4 0.2 0.0 0.5 0.3 0.0 0.0 2,4-D S-metolachlor 13.8 11.2 11.0 55.5 1.0 0.3 5.4 1.5 0.1 0.1 0.0 0.0 S-meto Thiencarbazone 14.0 33.7 33.4 9.2 3.8 4.0 1.3 0.1 0.5 0.1 0.0 0.0 glyphosate Triclopyr 15.3 9.9 10.0 56.2 0.5 0.5 6.7 0.7 0.1 0.1 0.0 0.0 S-meto
the‘position’variable then, toa lesser degree,the ‘water-dist’, ‘water-state’ and ‘spray’variables. Whenconsidering theI-PHY scores,themeanandminimumscoresfortheactiveingredients inthe‘glyphosate’groupweresignificantlygreaterthanthoseof the‘S-metolachlor’group.Themeanscoreswere5.57forthe ‘S-metolachlor’groupasopposedto8.54forthe‘glyphosate’group withap-valueof0.00062.Theminimumscoreswere3.57forthe ‘S-metolachlor’groupasopposedto5.38forthe‘glyphosate’group withap-valueof0.0018.However,theI-PHYmeanandminimum scoresforthe‘S-metolachlor’groupdidnotdifferfromthoseofthe ‘2,4-D’group.Lastly,themaximumI-PHYscoresforthe3groups werenotstatisticallydifferent:7.96forthe‘2,4-D’group,9.32for the‘glyphosate’groupand7.45forthe‘S-metolachlor’group.This lastpointshowsthattheconditionsunderwhichtheseactive ingre-dientswereusedhadastrongimpactonthescores.
Withaviewtolimitingtheenvironmentalimpactsofherbicides, ourresultsshowedthatreplacingtheactiveingredientsofthe ‘S-metolachlor’groupwiththoseofthe‘glyphosate’groupwouldbe worthwhile.Unfortunately,thisisnotalwayspossiblebecausethe activeingredientsdonotalwayshavethesametarget (monocotyle-donousordicotyledonousweeds)andthesamemodesofaction (preorpost-emergence).Ifthesubstitutionofactivesubstances isnotpossible,regressiontreescanhelpfarmerstoidentify vari-ablesofimportanceconstitutingtheirownroomformanoeuvre. Wefoundthatfarmershadpossibilitiestoactuponthese differ-entvariablesofimportance.Thosepossibilitieswereeitherpartial forthe‘water-dist’and‘water-state’variables,ortotalforallthe others.Ourresultsshowedthatfourvariablesmainlyaffectedthe I-PHYscoreandthisimportancevarieddependingonthepesticide group.However,thecomparisonoftheseresultswithliterature, suggeststhatI-PHYprobablyminimizesthespecificriskslinked tomajor rainfalleventsgiven themain variables we identified thatinfluenceitsscore.Infact,whilethetwovariableslinkedto theproximityofawaterpoint(‘dist-state’and‘water-state’) log-icallyinfluencedtheI-PHYscoreswhatevertheactiveingredient (HaarstadandLudvigsen,2007),the‘rainfall’variableonlyhada moderateimpactonthisscore.Yet,thatvariablewasconsidered veryimportantinsomeothercasestudies(Louchartetal.,2001; Hermosinetal.,2013)andparticularlyinatropicalclimate(Damm andVandenBrink,2010).Bernardetal.(2005)showedthat what-everthetypeofsoilconsidered,therisksofgroundwaterpollution duringheavyrainfall(>50mmday−1)byalltheactiveingredients
theystudiedwereproven.Includedintheseingredientsandthose weassessedfiguredatrazine,triclopyrand2,4-D.Davisetal.(2011)
alsoshowedthattherisksofsurfacewaterpollutionlinkedto herbi-cides(atrazine)ona cropsuchassugarcanemainlyarosefrom irrigationpracticesjustafterherbicideapplication.Thispractice iswidelyusedinReunion,particularlytoincreasetheeffectiveness ofpre-emergenceherbicidessuchasS–metolachlor.I-PHYdoesnot considerirrigationpracticesandtheycouldbeincludedwiththe ‘rainfall’variable,whichwouldallthemorewarrantincreasingthe weightofthatvariable.
4. Conclusion
Ourmethodologyenabledustoidentifyandprioritize impor-tancevariablesfortheI-PHYindicator,foreachherbicideunder ourstudyconditions.Such ananalysisprovesdecisiveforusing this typeof indicatoras itmakesit possibletolimit the“black box”imageoftheseindicators.Assuch, thesevariables become leversforactionuponwhichusersoftheseherbicidescanactto limit therisk of transferstotheenvironment. We tested some scenariosbasedontheextremethresholdvaluesofthevariables (favourableandunfavourable)inordertodeterminethemaximum roomforimprovement.Inpractice,andforanexanterisk assess-ment,somevariablescanbeblockedattheirtruevaluesrelativeto theactualconditionsofuse.Thismakesitpossibletoreducethe numberofscenariosand,thereby,thecomplexityoftheregression trees.Thesetreesthenbecomedecision–supporttoolsspecificto eachuserandprovidecustomizedadviceenablinguserstotake appropriate decisionswithaviewtoachievingtheirobjectives. Inordertohelpfarmers,thisdecision–supporttoolisnow avail-ableasanapplication,calledPhyto’Aide,onourwebapplications platform(www.margouilla.net/phytoaide).Thistool,basedonan opensourcecode,iscompletelyfreeandtheuserfriendlyinterface allowsthefarmer,oranyuser,toselectanactiveingredientandsoil parameterstoacquirearegressiontreeandthenadvice.Itprovides userswithatutorialtounderstandthemethod,howtointerpret thetreeandtoknowwhichactionscanbetaken.
Acknowledgments
Weshouldliketoexpressourwarmthankstoallstakeholders oftheagriculturalsectorandtheFrenchadministrationfortheir
extensiveinvolvementinthiswork.WethankPeterBigginsfrom CIRADforhislinguisticsupport.Wethanktheanonymous review-erswhohelpedimprovethequalityofthemanuscript.Theproject wasco-financedbytheEuropeanUnionand theReunionIsland Region.
AppendixA. Supplementarydata
Supplementary data associated with this article can be found,intheonlineversion,athttp://dx.doi.org/10.1016/j.ecolind. 2015.02.020.
References
Badat,2011.Etatdelaressourceetdesusagesdel’eauàlaRéunion–2010.In:Office del’eauRéunion,Saint-Denis,France.
Battaglin,W.A.,Furlong,E.T.,Burkhardt,M.R.,Peter,C.J.,2000.Occurrenceof sul-fonylurea,sulfonamide,imidazolinone,andotherherbicidesinriver,reservoirs andgroundwaterintheMidwesternUnitedStates,1998.Sci.TotalEnviron.248, 123–133.
Bel,L.,Allard,D.,Laurent,J.M.,Cheddadi,R.,Bar-Hend,A.,2009.CARTalgorithm forspatialdata:applicationtoenvironmentalandecologicaldata.Comput.Stat. DataAnal.53,3082–3093.
Bernard,H.,Chabalier,P.F.,Chopart,J.L.,Legube,B.,Vauclin,M.,2005.Assessmentof herbicidesleachingriskintwotropicalsoilsofReunionIsland.J.Environ.Qual. 34,534–546.
Bockstaller,C.,Girardin,P.,2003.Howtovalidateenvironmentalindicators.Agric. Syst.76,639–653.
Bockstaller,C.,Wohlfahrt,J.,Hubert,A.,Hennebert,P.,Zahm,F.,Vernier,F.,Mazzela, N.,Keichinger,O.,Girardin,P.,2008.Lesindicateursderisquedetransfert deproduitsphytosanitairesetleurvalidation:exempledel’indicateurI-Phy. Ingénieries86,103–114.
Bockstaller,C.,Guichard,L.,Keichinger,O.,Girardin,P.,Galan,M.B.,Gaillard,G.,2009.
Comparisonofmethodstoassessthesustainabilityofagriculturalsystems,a review.Agron.Sustain.Dev.29,223–235.
Breiman,L.,2001.RandomForests.StatisticsDepartment,UniversityofCalifornia, Berkeley,USA.
Breiman,L.,Friedman,J.H.,Olshen,R.A.,Stone,C.J.,1984.Classificationand Regres-sionTrees.Chapman/HallWadsworth,USA.
Damm,M.A.,VandenBrink,P.J.,2010.Implicationsofdifferencesbetween tem-perateandtropicalfreshwaterecosystemsfortheecologicalriskassessmentof pesticides.Ecotoxicology19,24–37.
Daniel,P.E.,Bedmar,F.,Costa,J.L.,Aparicio,V.C.,2002.Atrazineandmetribuzin sorptioninsoilsoftheArgentineanhumidpampas.Environ.Toxicol.Chem.21, 2567–2572.
Davis,A.M.,Thorburn,P.J.,Lewis,S.E.,Bainbridge,Z.T.,Attard,S.J.,Milla,R.,Brodie, J.E.,2011.Environmentalimpactsofirrigatedsugarcaneproduction:herbicide run-offdynamicsfromfarmsandassociateddrainagesystems.Agric.Ecosyst. Environ.180,123–135.
DeLafontaine,Y.,Beauvais,C.,Cessna,A.J.,Gagnon,P.,Hudon, C.,Poissant,L., 2014. Sulfonylurea herbicides in an agricultural catchmentbasin and its adjacentwetlandin theSt.LawrenceRiverbasin.Sci. TotalEnviron.479, 1–10.
Devillers,J.,Farret,R.,Girardin,P.,Rivière,J.-L.,Soulas,G.,2005.Indicateurspour évaluerlesrisquesliésàl’utilisationdespesticides.Tec&Doc,Lavoisier,Paris.
De’ath, G., Fabricius, K.E., 2000. Classification and regression trees: a pow-erful yet simple technique for ecological data analysis. Ecology 81, 3178–3198.
FAOSTAT. Pesticides (use). http://data.fao.org/dataset?entryId=5e70fee4-fb65-43b6-8da1-b6de4626b9bd&tab=metadata(accessed18.02.13).
Ferrara,A.,Salvati,L.,Sateriano,A.,Nolè,A.,2012.Performanceevaluationandcost assessmentofakeyindicatorsystemtomonitordesertificationvulnerability. Ecol.Indic.23,123–129.
Ghosh,R.K.,Singh,N.,2013.Adsorption–desorptionofmetolachlorandatrazine inIndian soils:effectofflyashamendment.Environ.Monit.Assess. 185, 1833–1845.
Gustafson,D.I.,1989.Groundwaterubiquityscore:asimplemethodforassessing pesticideleachability.Environ.Toxicol.Chem.8,339–357.
Haarstad,K.,Ludvigsen,G.H.,2007.TenyearsofpesticidemonitoringinNorwegian groundwater.GroundWaterMonit.R27,75–89.
Hak,T.,Kovanda,J.,Weinzettel,J.,2012.Amethodtoassesstherelevanceof sus-tainabilityindicators:applicationtotheindicatorsetoftheCzechRepublic’s SustainableDevelopmentStrategy.Ecol.Indic.17,46–57.
Hermosin,M.C.,Calderon,M.J.,Real,M.,Cornejo,J.,2013.Impactofherbicidesused inolivegrovesonwatersoftheGuadalquivirriverbasin(southernSpain).Agric. Ecosyst.Environ.164,229–243.
Lin,Y.J.,Makesh,K.,Anugrah,S.,Gian,G.,1999.Effectofsimulatedsunlighton atrazineandmetolachlortoxicityofsurfacewaters.Ecotoxicol.Environ.Saf. 43,35–37.
Louchart,X.,Voltz,M.,Andrieux,P.,Moussa,R.,2001.Herbicidesrunoffatfieldand watershedscalesinaMediterraneanvineyardarea.J.Environ.Qual.30,982–991.
Maillary,2012.,2012.Basenationaledesventesdesdistributeurs2009–2010et 2011.DAAF,Saint-Pierre,France.
Ministèredel’agricultureetdel’agroalimentaire,2013.e-phy,lecataloguedes pro-duitsphytopharmaceutiquesetdeleursusagesdesmatièresfertilisanteset dessupportsdeculturehomologuésenFrance,http://e-phy.agriculture.gouv.fr/
(accessed07.06.12).
Mottes,C.,Lesueur-Jannoyer,M.,LeBail,M.,Malézieux,E.,2013.Pesticide trans-fermodelsincropandwatershedsystems:areview.Agron.Sustain.Dev.,
http://dx.doi.org/10.10007/s13593-013-0176-3(onlinefirst).
Oliver,D.P.,Kookana,R.S.,2006.On-farmmanagementpracticestominimizeoff-site movementofpesticidesfromfurrowirrigation.PestManag.Sci.62,899–911.
Payraudeau,S.,Gregoire,C.,2012.Modellingpesticidestransfertosurfacewaterat thecatchmentscale:amulti-criteriaanalysis.Agron.Sustain.Dev.32,479–500.
Pedlowski,M.A.,Canela,M.C.,DaCostaTerra,M.A.,RamosdeFaria,R.M.,2012.
ModesofpesticidesutilizationbyBraziliansmallholdersandtheirimplications forhumanhealthandtheenvironment.CropProt.31,113–118.
Reichenberger,S.,Bach,M.,Skitschak,A.,Frede,H.G.,2007.Mitigationstrategiesto reducepesticideinputsintogroundandsurfacewaterandtheireffectiveness, areview.Sci.TotalEnviron.384,1–35.
Reus,J.,Leendertse,P.,Bockstaller,C.,Fomsgaard,I.,Gutsche,V.,Lewis,K.,etal., 2002.Comparisonandevaluationofeightpesticideenvironmentalrisk indica-torsdevelopedinEuropeandrecommendationsforfutureuse.Agric.Ecosyst. Environ.90,177–187.
Sadok,W.,Angevin,F.,Bergez,J.-E.,Bockstaller,C.,Colomb,B.,Guichard,L.,Reau,R., Doré,T.,2008.Exanteassessmentofthesustainabilityofalternativecropping systems:guidelinesforidentifyingrelevantmulti-criteriadecisionaidmethods. Agron.Sustain.Dev.28,163–174.
Tomlin,C.D.S.(Ed.),2006.ThePesticideManual.,14thed.BritishCropProtection Council,Farnham,UnitedKingdom,p.1349.
UniversityofHertfordshire,2013.ThePesticidePropertiesDataBase(PPDB) Devel-opedby theAgriculture&Environment ResearchUnit(AERU). University ofHertfordshire,2006–2013.http://sitem.herts.ac.uk/aeru/ppdb/en/atoz.htm
(accessed07.06.12).
VanderWerf,H.M.G.,Zimmer,C.,1998.Anindicatorofpesticideenvironmental impactbasedonafuzzyexpertsystem.Chemosphere36,2225–2249.
Voltz,M.,Alix,A.,Barriuso,E.,Bedos,C.,Bonicelli,B.,Caquet,T.,Dubus,I.,Gascuel, C.,Gril,J.N.,2005.Devenirettransfertdespesticidesdansl’environnementet impactsbiologiques.In:Aubertot,J.N.,Barbier,J.M.,Carpentier,A.,Gril,J.N., Guichard,L.,Lucas,P.,Savary,S.,Voltz,M.(Eds.),Pesticides,agricultureet environnement–Réduirel’utilisationdespesticidesetenlimiterlesimpacts environnementaux,ExpertisescientifiquecollectiveINRA-Cemagref,chapitre, vol.3,pp.1–219.
![Fig. 1. Decision tree of the groundwater component of I-PHY, GUS: groundwater ubiquity score (Gustafson, 1989) where GUS = log 10(DT50) × [4 − log 10(Koc)] where DT50 is the half-life of the active ingredient, Koc: soil sorption coefficient, position; funct](https://thumb-eu.123doks.com/thumbv2/123doknet/13962621.453005/4.918.213.716.624.942/decision-groundwater-component-groundwater-ubiquity-gustafson-ingredient-coefficient.webp)