Solar activity effects in the ionospheric D region
8
0
0
Texte intégral
Figure
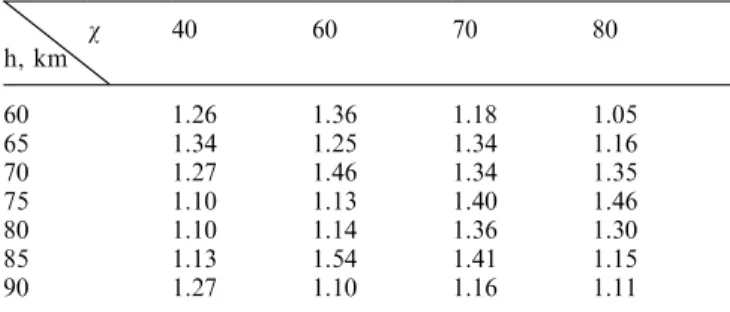
![Table 1. Estimates of [e] variations in the D region from high to low solar activity (r = [e](h)/[e](l))](https://thumb-eu.123doks.com/thumbv2/123doknet/14794734.603190/3.892.68.833.119.484/table-estimates-variations-region-high-low-solar-activity.webp)
Documents relatifs