HAL Id: hal-01601646
https://hal.archives-ouvertes.fr/hal-01601646
Submitted on 27 May 2020
HAL is a multi-disciplinary open access
archive for the deposit and dissemination of sci-entific research documents, whether they are pub-lished or not. The documents may come from teaching and research institutions in France or abroad, or from public or private research centers.
L’archive ouverte pluridisciplinaire HAL, est destinée au dépôt et à la diffusion de documents scientifiques de niveau recherche, publiés ou non, émanant des établissements d’enseignement et de recherche français ou étrangers, des laboratoires publics ou privés.
Copyright
Angelika D. Rosa, Nadege Hilairet, Sujoy Ghosh, Jean-Philippe Perrillat,
Gaston Garbarino, Sebastien Merkel
To cite this version:
Angelika D. Rosa, Nadege Hilairet, Sujoy Ghosh, Jean-Philippe Perrillat, Gaston Garbarino, et al.. Evolution of grain sizes and orientations during phase transitions in hydrous Mg2SiO4. Journal of Geophysical Research : Solid Earth, American Geophysical Union, 2016, 121 (10), pp.7161-7176. �10.1002/2016JB013360�. �hal-01601646�
Version postprint
This article has been accepted for publication and undergone full peer review but has not been through the copyediting, typesetting, pagination and proofreading process which may lead to differences between this version and the Version of Record. Please cite this article as doi: 10.1002/2016JB013360
Evolution of grain sizes and orientations during phase transitions
in hydrous Mg
2SiO
4.
Angelika D. Rosa1, Nadège Hilairet2, Sujoy Ghosh3, Jean-Philippe Perrillat4, Gaston
Garbarino1, Sébastien Merkel2,5
1
European Synchrotron Research Facility, ESRF, 71 rue des Martyrs, Grenoble, 38000, France
2
Unité Matériaux et Transformations, ENSCL, CNRS, Université Lille1, Villeneuve d'Ascq, 59655, France
3
Department of Geology and Geophysics, IIT Kharagpur, Kharagpur, 721302, India
4
Laboratoire de Géologie de Lyon, UMR5276, Université Claude Bernard Lyon 1, CNRS ENS Lyon, Villeurbanne, 69622, France
5
Institut Universitaire de France, 75005 Paris, France
Corresponding author: Angelika Dorothea Rosa ([email protected])
Key Points:
In-situ microstructure tracking with multigrain x-ray diffraction at high P/T.
Significant transformational grain size reductions at cold slab conditions.
Version postprint
Abstract
Transformation microstructures in mantle minerals, such as (Mg,Fe)2SiO4, are
critical for predicting the rheological properties of rocks and the interpretation of seismic observations. We present in-situ multi-grain X-ray diffraction experiments on hydrous Mg2SiO4 at the P/T conditions relevant for deep cold subducting slabs (up to 40 GPa and 850
°C) at a low experimental strain rate (~4*10-6s-1). We monitor the orientations of hundreds of grains and grain size variations during the series of α-β-γ (forsterite-wadsleyite-ringwoodite) phase transformations. Microtextural results indicate that the β and an intermediate γ* phase grow incoherently relatively to the host α-phase consistent with a nucleation and growth model. The β and γ-phase exhibit orientation relationships which are in agreement with previous ex-situ observations. The β and intermediate γ* show texturing due to moderate differential stress in the sample. Both the α-β and α-γ transformation induce significant reductions of the mean sample grain size of up to 90% that starts prior to the appearance of the daughter phase. Apart from the γ*, in the newly formed β and γ-phases, the nucleation rate is faster than the growth rate, inhibiting the formation of large grains. These results on grain orientations and grain size reductions in relation to transformation kinetics should allow refining existing slab strength models.
Version postprint
1 Introduction
Phase transformations in the major Earth‟s mantle minerals, such as (Mg,Fe)2SiO4,
play a key role for the global Earth‟s mantle dynamics as well as for the fate of subducting slabs [Helfrich and Wood, 2001; Mosenfelder et al., 2001; Poli and Schmidt, 2002; Tetzlaff and Schmeling, 2009]. Microstructural changes during phase transitions in this compound may affect mantle convection, slab subduction rates and the rheological properties of mantle rocks. The importance of transitions in olivine for geodynamics have motivated a tremendous amount of experimental studies focusing on understanding transformation microstructures. Such studies have been conducted on structural analogues [e.g., Vaughan and Coe, 1981;; Boland and Liu, 1983; Vaughan et al., 1984; Rubie and Champness, 1987; Burnley and Green, 1989; Burnley, 1995; Burnley and Bassett, 1995; Chen et al., 2001; Burnley, 2005] as well as on the mantle mineral (Mg,Fe)2SiO4 itself [e.g., Rubie and Brearley, 1990; Guyot et
al., 1991; Brearley et al., 1992; Fujino and Irifune, 1992; Brearley and Rubie, 1994; Sharp et al., 1994; Dupas-Bruzek et al., 1998; Kerschhofer et al., 1996; 1998; 2000; Wenk et al., 2004; Kubo et al., 2004; Couvey et al., 2005; Demouchy et al., 2011; Smyth et al., 2012; Perrillat et al., 2013, 2016].
(Mg,Fe)2SiO4 undergoes two polymorphic phase transitions and a decomposition reaction in
a relatively short depth interval between 410-660 km, the transition zone [Ringwood, 1975]. Along a typical mantle geotherm orthorhombic α-(Mg,Fe)2SiO4 transforms to an
orthorhombic β-polymorph (wadsleyite) at 13 GPa [Katsura and Ito, 1989]. This polymorph further transforms to a cubic γ-phase (ringwoodite) at 18 GPa which finally decomposes to orthorhombic-(Mg,Fe)SiO3 (bridgmanite) and cubic-(Mg,Fe)O (ferropericlase) at 23 GPa
[e.g., Ghosh et al., 2013]. These structural changes result in important modifications of the physical properties and rheology of mantle rocks. In particular, phase transitions in (Mg,Fe)2SiO4 will affect the behaviour of fast cold subducting slabs and their seismic
Version postprint
signature. High stress conditions and cold temperatures in such slabs, as well as water stored in the mineral structures [Hirschmann, 2005], can dramatically alter the properties and transformation microstructures of (Mg,Fe)2SiO4 [e.g., Bolfan-Casanova et al., 2000;
Demouchy et al., 2005; Litasov et al., 2006; Karato, 2006; 2008; Perrillat et al., 2013]. For example, studies conducted at cold subducting slab conditions have reported on important grain size reductions along with phase transformations [e.g., Vaughan and Coe, 1981; Boland and Liu, 1983; Rubie, 1984; Rubie and Champness, 1987; Guyot et al., 1991; Ito and Sato, 1991; Brearley et al., 1992; Sharp et al., 1994; Dupas-Bruzek et al., 1998; Kerschhofer et al., 1998; Perrillat et al., 2013, 2016]. Simple models derived from these data [Rubie 1984; Karato et al., 2001; Riedel and Karato, 1997] show that such grain size reductions could greatly affect the rheological properties of the slab. Transformational grain size reductions are thus a potential explanation for the observed spectrum of slab subduction behaviours, including their deflection, stagnation and penetration [Fukao et al., 1992; Fukao and Obayashi, 2013].
Most of the transformation microstructural observations have been obtained ex-situ from samples quenched at different stages of the high P/T transformation using methods such as optical and electron microscopy [e.g., Burnley and Green, 1989; Rubie and Brearley, 1990; Brearley et al., 1992; Brearley and Rubie, 1994; Sharp et al., 1994; Burnley, 1995; Kerschhofer et al., 1996; 1998, 2000; Kubo et al., 2004; Burnley, 2005; Demouchy et al., 2011; Smyth et al., 2012]. These ex-situ techniques allow a very precise determination of crystallographic orientations, compositions, grain boundaries, mean grain sizes and defect structures. Only few in-situ results were reported [e.g., Wenk et al., 2004] and most focused on kinetics and phase boundaries [e.g., Rubie et al., 1990; Meng et al., 1993; Kubo et al., 2004; Rubie and Ross, 1994; Hosoya et al., 2005; Perrillat et al., 2013, 2016].
Version postprint
Recently, multi-grain crystallography (MGC) was developed for in-situ diamond anvil cell (DAC) experiments [Nisr et al., 2012; Zhang et al., 2013; Nisr et al., 2014, Langrand et al., 2016]. The method allows in-situ measurements of crystallographic structures, grain orientations, and grain statistics at high pressure during dynamic processes such as deformation or phase transformation [Rosa et al., 2015]. Such studies can overcome limitations of ex-situ methods such as the restricted statistics on grain sizes and orientations, the limited number of P/T steps that can be studied, and the effect of quenching to ambient conditions. Moreover, they can be applied to non-quenchable phases that cannot be investigated ex-situ.
In this work, we study transformations in hydrous Mg2SiO4 and their effects on
microstructures through in-situ experiments. In particular, some questions we wish to address are their effect on grain sizes and whether anisotropy (i.e. crystallographic preferred orientations - CPO) could be preserved. We follow sample microstructures (i.e., grain sizes and CPO) in-situ during the phase transformations, and detect potential changes in these microstructural features with reaction progress. This is performed with in-situ multi-grain synchrotron X-ray diffraction experiments during the two phase transitions in hydrous Mg2SiO4 inside a resistively heated diamond anvil cell (RH-DAC). The experiments are
performed at temperatures between 600 and 850 °C over 33 hours, corresponding to relatively low strain rates (~4*10-6 s-1), and follow the P/T path of rapidly descending, cold slabs. This technique allows us to investigate transformational grain size variations and orientation-dependent growth in-situ during stable high P/T conditions up to 40 GPa and 850 °C. Three different polymorphic transitions are investigated: the direct α-γ transition, the α-β transition with the involvement of the intermediate γ* phase, and the β-γ transition. We monitor the individual orientations and crystallographic parameters of hundreds of grains inside the polycrystalline sample and infer the degree of grain size reductions for each
Version postprint
transition from the obtained grain size variations. The results provide deeper insights into grain size reductions, transformation kinetics, as well as textural evolutions under subducting slabs P/T conditions.
2 Materials and Methods
2.1 Sample preparation
Starting materials were polycrystalline samples of hydrous forsterite (Mg2SiO4*H2O)
similar to those employed by Rosa et al. [2015]. Single-crystals of up to 150 μm length were synthesized in a 1000-ton Walker type multi-anvil press. These single-crystals were produced from a stoichiometric mixture of MgO, SiO2 and Mg(OH)2. The mixture was loaded in a
welded platinum capsule. The synthesis run was carried out at 12 GPa and 1200 °C and held for 6 hours before quenching. Recovered crystals were individually picked, characterized and checked for their purity using Raman spectroscopy. Because multi-grain diffraction experiments in the DAC require a sample grain size distribution compatible with the small sample chamber (~50x50x45 μm3), all single-crystals were ground into a polycrystalline granulate using two tungsten carbide cubes. After crushing, the starting material comprised larger grains of 1-3 µm and a fine-grained matrix in the submicron domain, while a small amount of tungsten was present in the sample due to the sample preparation procedure. For more details on the sample preparation see Rosa et al. [2015]. The water content was estimated from the ambient conditions unit cell volume (293.38 A3) of forsterite which corresponds to 4500 ppm of H2O according to the calibration of Smyth et al. [2006].
2.2 High pressure and temperature experiments
We used an internally resistively heated diamond anvil cell (RH-DAC) in order to monitor the succession of phase transitions in-situ at simultaneous high P/T conditions. The RH-DAC was equipped with two Boehler-Almax beveled diamonds with a culet size of 350
Version postprint
and 300 µm and a conical aperture of 70° [Boehler and De Hantsetters, 2004]. A rhenium gasket indented to a thickness of 45 µm with a centered hole of 100 µm in diameter served as a sample chamber. A chip of gold and a pellet of sodium chloride (each of ~5x5x1 μm3 size), loaded at the bottom of the sample chamber, were used for in-situ monitoring of P and T in the sample using a cross-calibration method [Crichton and Mezouar, 2002]. Great care was taken to place these calibrants in contact to each other in order to optimize the cross calibration results. For the P/T cross-calibrations we used the thermal equation of state parameters reported by Shim et al. [2002] for Au and by Matusi et al. [2012] for NaCl.
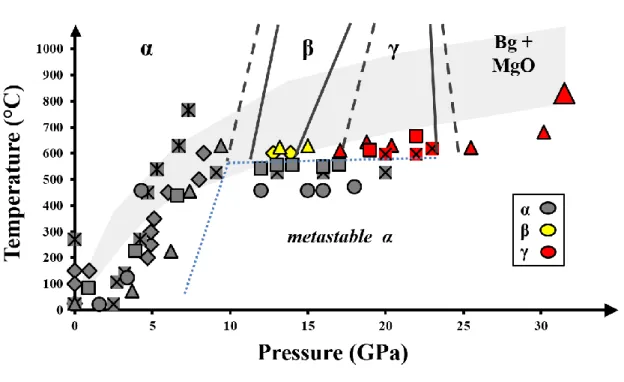
Fig. 1 shows the P/T paths of the experiments. Note that, after the compaction of the sample at relatively low P (below 3 GPa) and ambient T, the sample was heated in 100 °C increments up to the target T. In the highest P experiment (Exp.#4), P increase was then started by a single increase in membrane pressure. P in the sample further increased without external influence at high T over 33 hours due to the plastic flow of the metallic gasket. The experiments were hence performed at a slow compression rate. This procedure is very important for preserving the sample microstructure up to the phase boundary (see also section 5.1.1). From the estimated height reduction of the gasket from 45 to 25 µm (total strain of 50%) and the duration of the experiment we calculate a strain rate of ~4*10-6 s-1. This is slower than, for example, the strain-relaxation multi-anvil study of Sharp et al. [1994] conducted at an average strain rate of 10-5 s-1 over 3 hours.
Version postprint
2.3 Multi-grain crystallography experiments
The use of MGC for the study of high P/T phase transformations is described in detail in Rosa et al. [2015] and will be only outlined in the following. The experiments were performed at the beamlines ID11 and ID27 of the ESRF using monochromatic synchrotron radiation (0.2953 and 0.3738 Å, respectively). At ID27 a X-ray beam focused to a spot size of 7x4 µm2 (horizontal to vertical direction) was used together with a 2048x2048 pixels PerkinElmer detector placed at 457 mm from the sample. At ID11 the X-ray beam was focused to 10x5 µm2 and diffraction images were collected using a 1048x1048 pixels Frelon4M detector placed at 165 mm from the sample. Detector calibration parameters were obtained using a CeO2 standard. The positions of the P/T calibrant and the sample were
determined from horizontal and vertical scans of the X-ray beam through the sample chamber. Before the acquisition of diffraction data, and multiple times through the experiment, the cell was centered onto the rotation axis of the goniometer using horizontal X-ray scans of the sample chamber edges at moderate omega (ω) angles (i.e., ±10°).
The sample diffraction patterns were acquired at the exact center of the sample chamber in order to probe the same individual grains during the entire P/T cycle. Diffraction data were collected in two different modes. In order to accurately determine the crystallographic parameters of standards and samples, powder-like diffraction patterns were collected from continuous ω scans. Such “panoramic” diffraction images were obtained by exposing the detector for 40s during sample rotation around the goniometer z axis, over a wide ω interval [ωmin, ωmax]. The entire accessible ω interval, [-22°, 22°] was used over 40s
for the sample, while smaller intervals were used for the P/T standards.
Multi-grain analysis requires the ability to distinguish single diffraction spots originating from individual grains. We therefore acquired “oscillation” images using a
Version postprint
stepped ω scan, similar to data acquisitions for single-crystals. In this mode, a series of diffraction images is recorded over the ω interval [-22°, 22°]. Each image is collected during sample rotation over a short δω step of 0.25° with an exposure time of 0.25-0.5 s, resulting in 174 individual diffraction images for each P/T point.
3 Data analysis
3.1 Average sample properties
We use the “panoramic” diffraction images and Rietveld refinement with the software package MAUD [Lutterotti et al., 1997] for extracting the crystallographic parameters and average volume proportions of each potential phase (α, β, γ*, γ, NaCl, or Au).
3.2 Fine-grained matrix versus larger grains
The ratio between fine-grained matrix and larger grains (l-grains) at each P/T point is evaluated by separating the single grain diffraction spots from the continuous Debye rings; both signals are present in the acquired diffraction data (Fig. 2). For this purpose two intensity filters are applied to the “oscillation” diffraction data [Rosa et al., 2015]. For each detector pixel, we calculate its average and median intensity over a set of ω oscillation images. This results in two pseudo diffraction images: one containing only the diffraction signal from the fine-grained matrix (median filter) and one containing the signal of both the fine-grained matrix and l-grains (average filter).
For both diffraction data types, we integrated the diffraction image into an intensity vs. 2θ pattern and removed the background. The integration procedure ensured the averaging of diffraction peaks intensities originating from different grains. For each phase in the sample, the ratio of l-grains vs. fine-grained matrix is then quantified by measuring an intensity scaling factor between both patterns. In this process, we select one diffraction peak from the
Version postprint
phase which does not overlap with peaks of other phases. Specifically, we used the (021)α, (022)β and (400)γ(*) diffraction peaks.
Finally, the volumetric proportions of fine-grained matrix and l-grains of a given phase relative to the overall sample is determined by accounting for the total volume fraction of the phase (see section 3.1). For each phase, these global volume fractions will be referred to as “matrix” and “l-grains” in the rest of the paper (Table S1). These qualitative descriptors allow tracking the relative volume of two „extreme‟ grain size categories during the phase transitions.
3.3 Multi-grain analysis
The crystallographic parameters of individual grains are extracted from the oscillation images with the GrainSpotter program of the Fable package [Schmidt, 2014]. The principle of this analysis has been described previously [i.e., Lauridsen et al., 2001; Schmidt et al., 2003; Poulsen, 2004; Vaughan et al., 2004]. In this study, we follow the procedure described in Rosa et al. [2015], including noise removal from individual ω oscillation images and the extraction, filtering and assignment of individual diffraction spots to diffraction vectors using Peaksearch [Sorensen et al., 2012] and ImageD11 [Wright, 2006].
Individual grains are then indexed using the list of extracted scattering vectors (vectors), the obtained lattice parameters from Rietveld refinement, and Grainspotter. G-vectors are assigned to randomly generated grain orientations if the theoretical and observed G-vector angles (ω, omega; η, eta and θ, theta) deviate by less than 2σ. A grain is accepted when more than 30% of the theoretical predicted G-vectors are assigned. Typically, up to 110 grains can be indexed and more than 30% of G-vectors can be assigned in a first grain search. Later, several grain indexing iterations are performed, allowing Grainspotter to associate vectors with higher deviations and to accept grains with a lower number of assigned
G-Version postprint
vectors. For each iteration, the assigned G-vectors from the previous iteration are removed from the input list in order to avoid the assignment of a G-vector to multiple grains. For P/T-points collected during the phase transition, the indexing procedure is performed for each individual phase in order of descending volume fraction.
The procedure allows for up to 80% of the original G-vectors to be assigned to more than 800 grains (Table S1 and S2), while the remaining 20% unassigned G-vectors may correspond to unfiltered noise or difficult indexing due to shadowing effects of the DAC. The number of indexed grains is then used to evaluate the mean size of larger grains (l-grains) of a given phase at each P/T point. The volume occupied by l-grains of a given phase in the sample is calculated using the volume sampled by the X-ray beam, the volume fraction of the phase obtained by Rietveld refinements and the l-grains fraction. The volume sampled by the X-ray beam is estimated from the known beam size and the assumed thickness of the gasket (~25 µm at high pressure). The mean volume of individual grains is obtained by dividing the volume occupied by l-grains by the number of indexed grains for a given phase. The mean size of l-grains is then calculated from the mean grain volume by assuming a cubic shape for the grain. We find that during the experiments the size of l-grains varied between 0.1 and 1.6 μm (Table 2).
4 Results
Table 1 summarizes the P/T conditions and observations of all experiments. Exp.#1-#3 are from Rosa et al, 2015. Exp.#4-#6 are new. Exp.#1 covered the lowest P/T conditions (18 GPa and 470 °C) at which forsterite remained metastable. Exp.#2 and #3 were conducted at relatively low temperatures of up to 670 °C at which we observed the direct α-γ transformation, relevant for the transformation of metastable olivine to ringwoodite in cold slabs. Exp.#4, was conducted at the highest P/T conditions (40 GPa and 830 °C) and the two
Version postprint
polymorphic phase transitions in Mg2SiO4 could be monitored (Fig. 1). In Exp.#5, performed
up to 14 GPa and 610 °C, we observed the microstructure produced by the partial transition of hydrous forsterite to wadsleyite. Exp.#6 was conducted at high temperatures but lower pressures (850 °C and 7 GPa), and no transformation occurred. In the following we focus mostly on Exp.#4 as this experiment is the most geophysically relevant. Results from Exp.#3, with the direct α-γ transformation will be partly discussed as well.
4.1 Phase Stabilities
Fig. 3b shows the volume fraction evolution of phases with time for Exp.#4 together with the onsets of the phase transformations (see Table S1). We observe the transition from hydrous forsterite (α) to wadsleyite (β) at 13 GPa and 620 °C (Fig. 2b). These conditions are consistent with the boundary in hydrous Mg2SiO4 reported by previous studies (Fig. 1;
Litasov et al., 2006). Additional diffraction peaks appear during this transformation, which can all be indexed in the Fd3m spinel structure. These observations are in agreement with those of Rubie and Brearley [1990] at the same experimental conditions in Mg2SiO4 and
Perrillat et al. [2013] in hydrous iron bearing olivine. The intermediate phase, which will be referred to as γ* in the following (Perrillat et al. [2013]) remains volumetrically dominant at all stages of the α–(γ*+β) transition, even after 620 minutes. We do not observe the complete transformation of the α and γ*-phases to the β-phase at 620 °C (Fig. 3b). After 90 vol.% transformation of the α-phase, the volume fraction of the γ*-phase remains higher than 55%, while that of the β-phase is limited to 36 vol.%. These incomplete transformations have already been reported and discussed in previous studies [i.e., Kerschhofer et al., 1998]. Similar to Exp.#4, the involvement of the γ*-phase during the α–(γ*+β) transition can be monitored in Exp.#5. However, only the onset of the transition can be tracked in Exp.#5 which does not allow for a more detailed analysis.
Version postprint
At around 17 GPa and 610 °C, we observe further transformation of the sample in Exp.#4 to the phase (Fig. 2c). Because of many peak overlaps between the γ*-, β- and γ-phases (Fig. 2b,c), the exact onset of the (γ*+β)–γ transformation is difficult to constrain. We therefore take the onset of the β-phase volume fraction decrease as the beginning of this transformation, which agrees well with the β-γ phase boundary from Litasov et al., (2006). At 26 GPa and 590 °C, the volume fraction of γ-phase is 82%, while 5% and 13% relict β- and α-phase grains remain metastable. Note that these P/T conditions are at the limit of the γ-phase stability field in (Fig. 1).
With further P/T increase, the γ-phase remains metastable up to the highest P/T point of 40 GPa and 830°C. Diffraction peaks of periclase or bridgmanite were not observed even after 14 hours. These observations are consistent with the phase diagram established by Ghosh et al. [2013] and the kinetic data reported by Kubo et al. [2002] who found that at 860 °C and 28 GPa only 5% of periclase and bridgmanite formed after 7 hours.
4.2 Fine-grained matrix versus larger grain fraction
Fig. 3c-g) show the evolution of the relative volume fractions of the fine-grained matrix and l-grains in the different polymorphs during Exp.#3 γ transition) and Exp.#4 (α-(γ*+β)-γ transitions). The evolution of the extracted matrix fractions (m-fraction) as well as number of indexed grains are listed in Table S1 for Exp.#4 and have been described for Exp.#3 by Rosa et al. [2015]. Information on grain sizes are in Table 2.
In Exp.#4, at the beginning of the compression at elevated temperatures (7 GPa and 430 °C) the α-phase exhibits an equivolumetric distribution of matrix and l-grains. In the vicinity of the α–(γ*+β) transition (13 GPa and 600 °C) the fraction of α l-grains decreases significantly to less than 20 vol.% and the mean size of l-grains reduces from 1.6 to 1.4 µm. During the transformation, both the α-phase matrix and l-grains are consumed equally by the
Version postprint
newly formed β and γ*-phases. Both the β and γ*-phases grow predominantly as fine-grained matrix and show only little increase of the mean size of l-grains.
Interestingly, the γ*-phase shows a significant increase of the l-grain fraction during the α–(γ*+β) transition as well as an increase of the mean size of l-grains from 0.7 to 1.1 µm. Up to 10 vol.% γ* l-grains are present already in the first stages of the transformation which is in very good agreement with the ex-situ observations of Rubie and Brearly [1990]. This fraction further increases to 18 vol.% with ongoing transformation and increasing P/T conditions. In contrast, not more than 5% β l-grains grow with a mean size changing from 0.3 to 0.6 µm. The β l-grains further break up at a later stage of the transition within the β stability field and in vicinity of the (γ*+β)–γ transition.
During the (γ*+β)–γ transition, the newly formed γ-phase grows predominantly as fine-grained matrix by consuming primarily the β-phase matrix. Interestingly, the fraction of γ* l-grains of 18 vol.% is preserved in the γ-phase stability field. The γ-phase shows no further increase of the l-grain fraction with ongoing transformation, while the size of existing l-grains increases. The transition of the γ*- phase into the γ-phase cannot be pinpointed because we cannot deconvolute properly the diffraction peaks from these phases.
4.3 Texture evolution
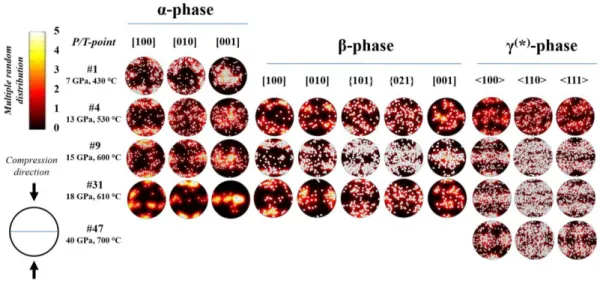
Fig. 4 shows pole figures (PF) representing individual grain orientations for selected P/T points of Exp.#4. PFs were calculated from the extracted Euler angles of the larger grains using the Mtex software [Bachmann et al., 2010]. They show the orientation distribution density of the main crystallographic axis of the indexed grains of each phase with respect to the geometry of the RH-DAC.
In the beginning of the Exp.#4, the α-phase shows a similar texture as reported by Rosa et al. [2015] with the [010]α and [001]α axes predominantly oriented parallel and
Version postprint
transformation to the β+γ* assembly (P/T-point #4 and #9, Fig. 4) the α-phase texture weakens. After the transformation, several metastable relict α grains can be indexed (P/T-point #31, Fig. 4). Their orientations are similar to the average texture observed at lower P/T conditions.
In the initial stage the α–(γ*+β) transition, the β-phase exhibits a weak preferential alignment of the [100]β and [001]β axis parallel and perpendicular to the compression
direction, respectively, while γ*-grains are randomly oriented (P/T-point #4, Fig. 4). In the later stages of the transformation the β-phase texture strength increases and the γ*-phase forms a preferential alignment, with <100>γ* being oriented perpendicular and parallel to the
compression axis and <111>γ* being inclined at 45 ° to the compressional direction
(P/T-point #9, Fig. 4). During the (γ*+β)–γ transformation, the β-phase texture strength reduces and becomes random, while the γ*-phase texture is preserved by the γ-phase (P/T-point #31, Fig. 4).
5 Discussion
5.1 Strength and limitations of the study
5.1.1 Stress and sample microstructures
In this study, the sample was compressed at elevated temperatures (~600-850°C) throughout the whole experiment, following a P/T path relevant for cold subduction slabs. We find that heating at low pressure and high temperature during compression is extremely important for preserving the sample microstructures (e.g. avoiding grain crushing). This experimental approach differs from previous studies in which pressure was increased at lower temperature. As highlighted before, large stresses during cold compression result in ultra-fine α-phase grains (down to 10 nm) and high dislocation densities [e.g., Rubie et al., 1990;
Version postprint
Brearley et al., 1992; Burnley et al., 1995]. In large volume press studies, this complication is somewhat solved by annealing the microstructure induced by cold compression at high temperature (e.g., 1200 °C) prior to transformation [e.g., Rubie et al., 1990; Brearley et al., 1992].
Another difference of the present study with previous works is that pressure was not increased in steps. Pressure increased continuously due to the plastic flow of the metallic gasket at high T without further external influence. We approximate a strain rate of = ~4*10-6s-1 using the estimated height reduction of the gasket during the experiment (~50%) and the duration of the run (33 hours). This rate is lower than in most other studies [e.g., Sharp et al., 1994].
A limitation of the present study is that both microscopic differential stress in grains and macroscopic stress in the sample cannot be quantified. In single-crystal diffraction studies, peak broadening or the enlargement of the rocking curves of off-axis diffraction peaks are used to identify microscopic stress in the crystal. In the present experiment, peak broadening in θ and η is not observed below 25 GPa, and rocking curves are only slightly enlarged from 0.25° to 1.25°, from ambient conditions to 25 GPa and ~700 °C. These observations indicate that microscopic differential stresses are moderate in the experiments up to 25 GPa.
With low strain rate (4*10-6s-1) and temperatures of 600-830°C, we expect the stress level in our experiments to be relatively low compared to classical DAC deformation experiments. Finally, note that misfit strains between the host and the newly formed phases do create microscopic stresses in grains that are inherent to the study of these phase transformations [Kershhoffer et al., 1998].
Version postprint
5.1.2 In-situ microstructure characterization
This project is a first step towards the in-situ microstructural characterization during phase transitions using MGC at high pressure. While electron microscopy on quenched samples provides indisputable topotatic relationships and higher spatial resolution, MGC achieves good statistics regarding grain orientations by sampling most of the sample chamber. MGC also allows for in-situ measurements with ongoing phase transitions and avoids possible drawbacks of sample quenching.
Using MGC, larger grains (~ 1 µm average size) can be clearly distinguished from small grains that are not detectable (< 0.1 µm average). Note however, that in-situ grain sizes from MGC are estimated qualitatively based on sample volumes and number of indexed grains. Those are qualitative descriptors. It remains difficult to obtain average grain sizes (crystallite sizes) of polycrystalline samples with grains size distribution in the range of 0.1 – 1 µm through the analysis of diffraction peak broadening. Electron microscopy observations of quenched samples could help to better constrain the uncertainty of in-situ grain sizes from MGC. The latter was not feasible in the present work because of diamond breakage in the RH-DAC prototype but is foreseen in future studies.
5.2 Transformational grain size variations
Constraining the variations of grain sizes during phase transitions is important to predict the strength evolution in a transforming material as well as for transformation kinetics. Numerous ex-situ studies on quenched samples have reported on transformational grain size reductions in (Mg,Fe)2SiO4 and analogue phases [e.g., Vaughan and Coe, 1981;
Rubie, 1984; Ito and Sato, 1991; Green and Burnley, 1989; Perrillat et al., 2013, 2016]. We also observe transformational grain size reductions in both the (α–(γ*+β) and the partial α–γ
Version postprint
transformations (Fig. 3). Grain size reduction occurs before the detection of the high pressure phase in the diffraction pattern. This could be due to 1) pre-transformational grain size reduction in the host α-phase related to pre-transformational microscopic stresses in this phase 2) the formation of small nano-scale high pressure phase domains within the α-phase that are not detected by diffraction. Later in the transformation, we observe the growth of pre-dominantly fine-grained newly formed phases due to a faster nucleation over growth rate.
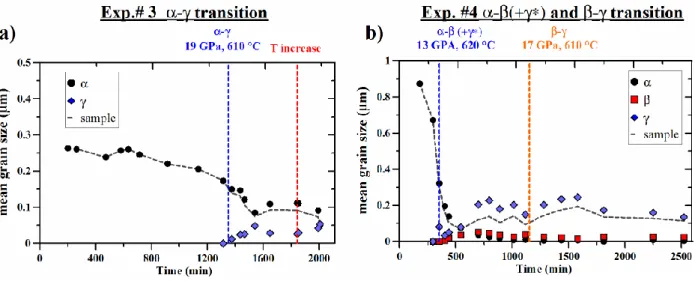
In order to infer the magnitude of the overall sample grain size reductions during the phase transitions we estimate the mean grain size of the sample at different P/T points. It was calculated assuming a mean grain size of 0.1 µm for the matrix and the results of Table S1 for the larger grain sizes and the relative fractions of each grain types.
We find significant average grain size reductions in the sample from 0.9 to 0.1 µm (88%) and 0.25 to 0.1 µm (60%) during the α–(γ*+β) and the α–γ transformations, respectively (Fig. 5a,b). Perrillat et al. [2013, 2016] observed 44% and 70% mean grain size reductions during the α–(γ*+β) and α–γ transformations in a similar compositions, respectively (2.5 to 1.4 µm and 7 to 2 µm). These previous results indicate that both these transformations induce significant grain size reduction consistent with the trends observed in our work. Differences in the absolute values of grain size reduction ratios may be due to partial transformations in the present studies, uncertainties on grain size determination from X-ray diffraction, as well as differing sample composition, experimental P/T paths, and stress levels.
5.3 Incoherent versus coherent growth
Transformation mechanisms can be divided in two types: those that will preserve preferred grain orientations and thus elastic and seismic anisotropy and those that do not. The intracrystalline transformation mechanism as well as the coherent nucleation and growth of newly formed phases on grain boundaries can be assigned to the first type, while the
Version postprint
incoherent nucleation and growth mechanism on grain boundaries is ascribed to the second type.
In dry and hydrous (Mg,Fe)2SiO4 and analogue phases, both mechanisms occur during
the α–β and α-γ transition, depending mainly on the starting grain size and the differential stress. Small grains and fine-grained matrix (< 30 µm) transform predominantly through incoherent grain boundary nucleation and growth at low average mantle-like differential stresses (<1GPa) [e.g., Rubie et al., 1990; Fujuo and Irifune 1992; Brearley and Rubie, 1994, Kubo et al., 2004; Smyth et al., 2012; Perrillat et al., 2013; 2016]. An intracrystalline mechanism operating simultaneously with the nucleation and growth mechanism has been observed at differential stresses of 1 GPa [e.g., Burnley and Green, 1989; Burnley, 1995], in large α-grains (> 0.6 mm) [e.g., Kerschhofer et al., 1996, 1998, 2000; Smyth et al., 2012] as well as at high-over pressures and high differential stresses in fine-grained samples [e.g., Burnley, 1995; 2005; Wang and Martinez, 1997; Kerschhofer and Rubie, 1997]. Kerschhofer et al. [1998] observed γ-phase lamella intergrown in olivine grains with [100]α // [111]γ and
[001]α // [110]γ in experiments conducted in the γ-phase stability field (18-20 GPa and
900-1400 °C) with 4-5 GPa pressure oversteps to the metastable α-γ phase boundary. Few
coherent wadsleyite lamella intergrown in hydrous olivine grains with {101}β and {021}β //
(100)α have been recently discovered in a peridotitic sample quenched from 1400 °C and 13
GPa [Smyth et al., 2012].
5.3.1 α–(γ*+β) and α-γ transition
Microtextures extracted in the present study for the α–(γ*+β) transformation at 600-670 °C and 13-17 GPa (Fig. 4), show that neither the β nor the γ*- phase exhibit the structural relationships to the host α-phase observed by previous studies on quenched samples of hydrous or dry (Mg,Fe)2SiO4 [e.g., Boland and Liu, 1983; Burnley and Green, 1989; Madon
Version postprint
et al., 2012]. However, the newly formed phases show texturing (Fig. 4 and section 4.3) which we assign to moderate differential stresses in the sample chamber.
Our microtextural observations hence indicate that the α-γ and α–(γ*+β) transitions are driven by an incoherent nucleation and growth mechanism with a faster nucleation than growth rate. This conclusion is in good agreement with the interface controlled nucleation and growth mechanism reported in previous studies and supports a reconstructive transformation mechanism [e.g., Guyot et al. 1991; Brearley et al. 1992; Fujino and Irifune 1992; Brearley and Rubie 1994: Kubo et al., 2004]. Because textural relationships expected for the intracrystalline mechanism were not observed at the scale of X-ray diffraction observations, we suggest that this mechanism does not dominate the transformation. The small grain sizes and moderate stress conditions may inhibit the intracrystalline mechanism [see e.g., Kerschhofer et al., 1998].
Interestingly, the β-phase shows crystallographic orientation relationship to the γ* with [001]β // [001]γ*/ γ and [010]β // [110]γ*/γ (see Fig. 4: P/T-point #9, the <100> γ* direction
is symmetry equivalent to [001]). These relations are similar to the epitaxial intergrowth relations reported by Brearley et al. [1992] on quenched samples of Mg2SiO4. These textural
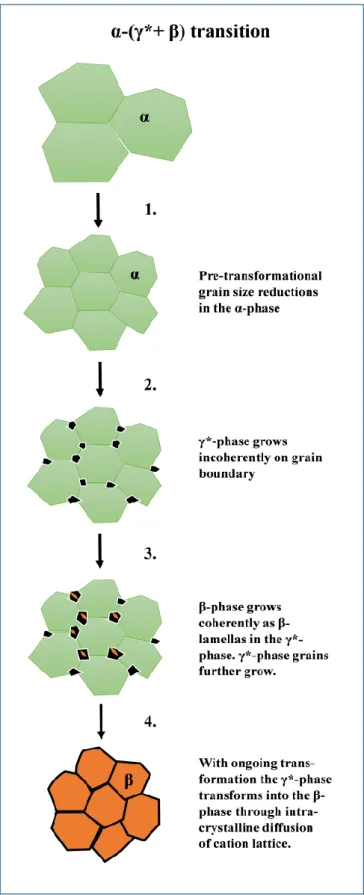
observations and the fact that the γ* is volumetrically slightly above the β-phase (Fig. 3b) suggest an oriented growth of β-phase lamella in γ*-grains (Fig. 6).
5.3.2 (γ*+β)–γ transition
Similar textural patterns and orientation relationships are observed between the β and γ phases [(γ*+β)–γ transition] and the β and γ* phases [α–(γ*+β) transition] (Fig. 4). The origin of the crystallographic relationships between the β- and γ-phase at the onset of the transformation are most likely related to the rearrangement of the crystallographic lattice of
Version postprint
the γ*-phase through short range cation diffusion into the γ-phase. This mechanism preserves the crystallographic orientation and therefore the orientation relationship of the γ(*)-phase to the β-phase. During the (γ*+β)–γ transition, the γ-phase texture strength increases, which suggests that the newly formed γ-phase grows in the same preferred orientation as the γ*-phase.
6. Implications
6.1 Grain size reduction during subduction
Transformational grain size reductions can modify the deformation mechanisms in mantle minerals, which has important implication for the slab strength and subduction behaviors [Rubie, 1984, 1993; Solomatov, 1996, 2001, 2008; Riedel and Karato, 1997; Karato et al., 2001; Billen, 2008; Syracuse et al., 2010]. In subducting slabs in particular, grain size reductions due to phase transformations may reduce the viscosity by many orders of magnitude [Solomatov, 2008]. Solomatov [1996, 2001, 2008] showed that the effect of the grain size variations on the viscosity and convective flow may be comparable to or even larger than that due to temperature and pressure. Our experimental results show that grain size reductions may occur for the α–(γ*+β) and the direct α–γ transition at moderate stresses and temperatures of 600(10) °C, with degrees of grain size reductions of 60 to 90% (Fig. 5). These reductions are likely due to two mechanisms, including a pre-transformational grain size reduction in the host phase and the formation of mainly fine-grained newly formed phases.
The studied mean grain size in our sample is relatively small and varies between 0.1 and 2 µm, which is at the lower limit of the estimated grain size distribution in subducting slabs of 0.01 – 10 mm [Riedel and Karato, 1997; Karato et al., 2001]. The studied grain sizes do however cover the transition from dislocation to grain-size sensitive diffusion creep in
Version postprint
ringwoodite and wadsleyite at cold slab conditions. Indeed, at high stresses, i.e., 300 MPa, which are expected for the deep Tonga slab [Kaneshima et al., 2012; Kaneshima and Yoshioka, 2014], the boundary between these regimes is located at fine grain sizes of 0.5 µm for both minerals [Shimojuku et al., 2009].
In order to apply experimental grain size variations to the observed slab subduction behaviours in the Earth‟s mantle, complex simulations would be required that also account for temperature, stress and pressure variations along the subduction path. Such a model is out of the scope of the present study. However, based on the present in-situ observations, we find that pre-transformational grain size reductions can play an important role in overall grain size changes during phase transitions, a mechanism which should be taken into account in future slab strength models.
6.3 Seismic anisotropy
Phase transitions in (Mg,Fe)2SiO4 induce a change in texture that affect seismic
anisotropy variations in the Earth‟s mantle at the global scale and in deep subducted slabs [Mainprice, 1991; Mainprice et al., 2000; Montagner et al., 2012; Mohiuddin et al., 2015; Yuan and Beghein, 2013; Dannberg et al., 2015]. The present results on transformation textures indicate that at hydrous and cold slab conditions, newly formed β- and γ-phase grow incoherently from the α-phase, while the γ-phase shows oriented growth relation to the β phase.
The results thus indicate that an inheritance of CPO across the α-β and α-γ transitions is unlikely, while it could be preserved across the β–γ transition. This is consistent with the predominant incoherent growth between the α- and β-phases in hydrous (Mg,Fe)2SiO4 at
normal mantle conditions reported by Smyth et al. [2012]. This is also consistent with the epitaxial growth observed by Kerschhofer et al. [1998] during the γ-β transition in
Version postprint
(Mg,Fe)2SiO4 at cold slab conditions. Moreover, the observations also agree with the fact that
the β-, γ*- and γ-phases exhibit the same oxygen lattice symmetry (fcc), while oxygen atoms in the α-phase form a different lattice symmetry (hcp).
Based on our results we conclude that seismic anisotropy in cold slabs would not be preserved at the ~410 km discontinuity through CPO inheritance. Anisotropy above and below this discontinuity will be controlled by large-scale deformation. Grain orientations can be preserved through the β–γ transition. The seismic anisotropy across the β–γ transition will decrease significantly, however, due the low elastic anisotropy in ringwoodite.
7 Conclusion
Multi-grain XRD experiments have been conducted up to 40 GPa and 850 °C on a hydrous polycrystalline Mg2SiO4 sample. Microstructural information, i.e., grain size
variations and texture evolutions have been extracted in-situ during successive α–(γ*+β), (γ*+β)-γ and α–γ transformations.
We observed significant grain size reductions during the α–(γ*+β) and α–γ transitions. The mean grain size reduction in the overall material is due to both grain size reduction in the α-phase, before transformation, and due to growth of mainly fine-grained newly formed phase, with faster nucleation than growth rate. These pre-transformational grain size reductions in the host α-phase at cold slab conditions may play an important role for overall grain size evolution during subduction as well as on transformation kinetics. Slab strength models that consider pre-transformational grain size reductions could help to better constrain the effect of this mechanism for the observed subduction behaviours.
Textural results reveal that both the γ(*) and β phases grow incoherently to the host α– phase, while the β and γ(*)-phases show texture features in agreement with orientation relationships proposed in previous studies. Textures in newly formed β- and γ(*)-phases most likely develop due to their orientation-dependent growth under the stress. Accordingly,
Version postprint
seismic anisotropy in cold slabs would not be preserved at the ~410 km discontinuity through CPO inheritance. Anisotropy above and below this discontinuity will likely be due to deformation. Grain orientations can be preserved through the β–γ transition. However, the reduced elastic anisotropy of the γ phase might result in an overall decrease of the seismic anisotropy across the transition in cold subducted slabs.
This study is a first step towards the in-situ characterization of microstructural features during high P/T phase transitions using multi-grain crystallography. Experimental and analytical developments are ongoing to refine the technique, including tracking of the position, the strain and orientation of individual grains during phase transitions. The present experimental approach bears a high potential to be used on other systems relevant to the deep Earth which are un-quenchable and/or cannot be studied with conventional ex-situ methods.
Acknowledgements
The authors would like to thank the European Synchrotron Radiation Facility (ESRF) for allocation of beam time, Gavin Vaughan for the support during the beam time at ID11, Jeroen Jacobs for the technical high-pressure support and Stany Bauchau for providing technical equipment. The authors would also like to thank the two anonymous reviewers that helped to improve this manuscript and the editor for editorial handling. A.D.R. was financially supported by a fellowship of the Swiss National Foundation (PBEZP2-142924) and S.G. was supported by a SNF grant (# 200020-130100/1), which are both gratefully acknowledged. S.M., N.H. and A.D.R. received support from the PNP program of CNRS/INSU. The data for this paper are available by contacting the corresponding author at [email protected].
Version postprint
References
Bachmann, F., R. Hielscher and H. Schaeben (2010), Texture Analysis with MTEX – Free and Open Source Software Toolbox, Solid State Phenom., 160, 63-68.
Billen, M.I. (2008), Modeling the Dynamics of Subducting Slabs, Annu. Rev. Earth Pl. Sc., 36, 325-356.
Boehler, R. and K. De Hantsetters (2004), New anvil designs in diamond-cells, High Pressure Res. , 24, 3, 391-396.
Boland, J.N. and L. Liu (1983), Olivine to spinel transformation in Mg2SiO4 via faulted
structures. Nature, 303, 233-235.
Bolfan-Casanova, N., H. Keppler and D.C. Rubie (2000), Water partitioning between nominally anhydrous minerals in the MgO–SiO2–H2O system up to 24 GPa: implications
for the distribution of water in the Earth's mantle, Earth Planet. Sci. Lett., 182, 209–221. Brearley, A. J. and D. C. Rubie (1994), Transformation mechanisms of San Carlos olivine to
(Mg,Fe)2SiO4 b-phase under subduction zone conditions, Phys Earth Planet. Int., 86(1-3), 45-67.
Brearley, A.J., D.C. Rubie and E. Ito (1992), Mechanisms of the transformations between the α, β and γ polymorphs of Mg2SiO4 at 15 GPa, Phys. Chem. Min., 18, 6, 343-358.
Burnley, P. C. (2005), Investigation of martensitic-like transformation from Mg2GeO4 olivine
to its spinel structure polymorph, Am. Min., 90, 8-9, 1315-1324.
Burnley, P. C. (1995), The fate of olivine in subducting slabs: a reconnaissance study. Am. Mineral, 80, 1293-1301.
Burnley, P. C., W. A. Bassett and T-C. Wu (1995), Diamond anvil cell study of the transformation mechanism from the olivine to spinel phase in Co2SiO4, Ni2SiO4 and
Version postprint
Burnley, P.C. and H.W. II Green, (1989), Stress dependence of the mechanism of the olivine spinel transformation, Nature, 338, 753-756.
Chen, J., D.J. Weidner, J.B. Parise, M.T. Vaughan and P. Raterron (2001), Observation of Cation Reordering during the Olivine-Spinel Transition in Fayalite by In Situ Synchrotron X-Ray Diffraction at High Pressure and Temperature, Phys. Rev. Lett., 86, 4072 – 2001. Crichton, W. and M. Mezouar (2002), Noninvasive pressure and temperature estimation in
large-volume apparatus by equation-of-state cross-calibration, High Temp. - High Press., 34, 2, 235 – 242.
Couvy, H., 2005. Experimental deformation of forsterite, wadsleyite and ringwoodite: implications for seismic anisotropy of the Earth‟s mantle. Bayerisches Geoinstitut, PhD thesis, Universitaet Bayreuth, Bayreuth, p. 140.
Dannberg, J., Z. Eilon, R. Gassmoeller, P. Moulik, R. Myhill, U. Faul and P. Asimow (2015), Grain size evolution in the mantle and its effect on geodynamics, seismic velocities and attenuation, Geophy. Res. Abs., 17, EGU2015-10825, EGU Gerneral Assembly 2015. Demouchy, S., E. Deloule, D.J. Frost and H. Keppler (2005), Pressure and temperature-
dependence of water solubility in Fe-free wadsleyite, Am. Mineral., 90, 1084–1091. Demouchy, S., Mainprice, D., Tommasi, A., Couvy, H., Barou, F., Frost, D.J. and Cordier P.,
(2011), Forsterite to wadsleyite phase transformation under shear stress and consequences for the Earth's mantle transition zone, Phys. Earth Planet. Int. 184, 91 ‐ 104.
Dupas-Bruzek, C., T.G. Sharp, D.C. Rubie and W.B. Durham (1998), Mechanisms of transformation and deformation in Mg1.8Fe0.2SiO4 olivine and wadsleyite under
non-hydrostatic stress, Phys. Earth Planet. Inter., 108, 33–48.
Fujino K. and T. Irifune (1992), TEM studies on the olivine to modified spine1 transformation in Mg2SiO4, In: High Pressure Research: Application to Earth and
Version postprint
Fukao, Y. and M. Obayashi (2013), Subducted slabs stagnant above, penetrating through, and trapped below the 660 km discontinuity, J. Geophys. Res., 118, 5920–5938.
Fukao, Y., M. Obayashi, H. Inoue and M. Nenbai (1992), Subducting slabs stagnant in the mantle transition zone, J. Geophys. Res., 97, B4, 4809–4822.
Ghosh, S., E. Ohtani, K.D. Litasov, A. Suzuki, D. Dobson and K. Funakoshi (2013), Effect of water in depleted mantle on post-spinel transition and implication for 660 km seismic discontinuity. Earth Planet, Sci. Lett., 371, 103-111.
Guyot, F., G.D. Gwanmesia and R.C. Liebermann (1991), An olivine to beta phase transformation mechanism in Mg2SiO4, Geophys. Res. Lett., 18, 89–92.
Helfrich, G.R and B.J. Wood (2001), The Earth‟s Mantle, Nature, 412, 501-507.
Hirschmann, M.M., C. Aubaud and A.C. Withers (2005), Storage capacity of H2O in
nominally anhydrous minerals in the upper mantle, Earth Planet. Sci. Lett., 236, 167–181. Hosoya, T., T. Kubo, E. Ohtani, A. Sano, and K.-I. Funakoshi (2005), Water controls the
fields of metastable olivine in cold subducting slabs, Geophys. Res. Lett., 32, L17305. Irifune, T., N. Nishiyama, K. Kuroda, T. Inoue, M. Isshiki, W. Utsumi, K. Funakoshi, S.
Urakawa, T. Uchida, T. Katsura and O. Ohtaka (1998), The post-spinel phase boundary in Mg2SiO4 determined by in situ X-ray diffraction, Science, 279, 1698–1700.
Ito, E. and H. Sato (1991), A seismicity in the lower mantle by superplasticity of the descending slab, Nature 351, 140-141, 1991.
Kaneshima, S. and S. Yoshioka (2014), Dominant role of temperature on deep earthquake mechanics for the Tonga slab near the bottom of the upper mantle, Earth Planets Space, 66, 138-146.
Kaneshima, S., T. Kubo and S. Yoshioka (2012), Geophysical and mineralogical constrains on the post-spinel transformation for the Tonga slab, Phy. Earth Plant. Int., 196-197, 23-31.
Version postprint
Karato, S. (2006), Remote sensing of hydrogen in Earth ‟s mantle, in: Water in Nominally Anhydrous Minerals, Rev. in Mineral. and Geochem., vol. 62, edited by H. Keppler and J. R. Smyth, pp. 343 – 375, Mineral. Soc. of Am., Washington.
Karato, S. (2008), Deformation of Earth Materials: An Introduction to the Rheology of Solid Earth. Cambridge: Cambridge University Press.
Karato, S., M.R. Riedel and D.A. Yuen (2001), Rheological structure and deformation of subducted slabs in the mantle transition zone: implications for mantle circulation and deep earthquakes, Phys. Earth Planet. Int., 127, 83-108.
Katsura, T., and E. Ito (1989), The system Mg2SiO4-Fe2SiO4 at high pressures and
temperatures. Precise determination of stabilities of olivine, modified spinel and spinel, J. Geophys. Res., B11, 663-670.
Kerschhofer, L., D. C. Rubie, T. G. Sharp, J.D.C. McConnel and C. Dupas-Bruzek (2000), Kinetics of Intracrystalline Olivine-Ringwoodite Transformation, Phys. Earth Planet. Int., 121(1-2), 59-76.
Kerschhofer, L., C. Dupas, M. Liu, T.G. Sharp, W.B. Durham and D.C. Rubie (1998), Polymorphic transformations between olivine, wadsleyite and ringwoodite: mechanisms of intracrystalline nucleation and the role of elastic strain, Mineral. Mag., 62, 617-638.
Kerschhofer, L., T.G. Sharp and D.C. Rubie (1996), Intracrystalline Transformation of Olivine to Wadsleyite and Ringwoodite Under Subduction Zone Conditions, Science, 274, 79-81.
Kubo, T., E. Ohtani, T. Kato, S. Urakawa, A. Suzuki, Y. Kanbe, K. Funakoshi, W. Utsumi, T. Kikegawa and K. Fujino (2002), Mechanisms and kinetics of the post-spinel transformation in Mg2SiO4, Phy. Earth Plant. Int., 129, 153–171.
Version postprint
Kubo, T., E. Ohtani and K. Funakoshi (2004), Nucleation and growth kinetics of the α-β transformation in Mg2SiO4 determined by in situ synchrotron powder X-ray diffraction,
Am. Min., 89, 285-293.
Langrand, C., N. Hilairet, C. Nisr, M. Roskosz, G. Ribárik, G. B.M. Vaughand, S. Merkel (2016) , Reliability of Multigrain Indexing for Orthorhombic Polycrystals above 1 Mbar: Application to MgSiO3 post-perovskite., J. Appl. Cryst., in revision
Lauridsen, E.M., S. Schmidt, R.M. Suter, H.F. Poulsen (2001), Tracking: a method for structural characterization of grains in powders or polycrystals, J. Appl. Cryst., 34, 744-750.
Litasov, K.D., E. Ohtani and A. Sano (2006), Earth's Deep Water Cycle, edited by S. D. Jacobsen, S. Van Der Lee, pp. 95-111. Washington, DC: American Geophysical Union. Lutterotti, L., S. Matthies, H.R. Wenk, A.S. Schultz and J.W. Richardson (1997), Combined
texture and structure analysis of deformed limestone from time-of-flight neutron diffraction spectra, J. Appl. Phys., 81, 594-600.
Nisr, C., G. Ribárik, T. Ungár, G. B. M. Vaughan, P. Cordier, and S. Merkel (2012), High resolution three-dimensional X-ray diffraction study of dislocations in grains of MgGeO3
post-perovskite at 90 GPa, J. Geophys. Res., 117, B03201.
Nisr, C., G. Ribárik, T. Ungár, G. B. M. Vaughan and S. Merkel, Three-dimensional X-ray diffraction in the diamond anvil cell: application to stishovite, High Pres. Res., 2014, 34, 2, 158.
Madon, M., F. Guyot, J. Peyronneau and J.P. Poirier (1989), Electron microscopy of high-pressure phases synthesized from natural olivine in diamond anvil cell, Phys. Chem. Miner., 16, 320–330.
Mainprice, D. (1991), Phase transformations and inherited ODFs: Implications for Petrophysical properties, Textures and Microtextures, 14-18,339-345.
Version postprint
Mainprice, D., G. Barruol and W.B. Ismaïl (2000), The Seismic Anisotropy of the Earth's Mantle: from Single Crystal to Polycrystal, in Earth's Deep Interior: Mineral Physics and Tomography From the Atomic to the Global Scale (eds S.-I. Karato, A. Forte, R. Liebermann, G. Masters and L. Stixrude), American Geophysical Union, Washington, D. C.
Matsui, M., Y. Higo, Y. Okamoto, T. Irifune and K.-I. Funakoshi (2012), Simultaneous sound velocity and density measurements of NaCl at high temperatures and pressures: Application as a primary pressure standard, Am. Mineral., 97, 1670-1675.
Meng, Y., D. J. Weidner, G.D. Gwanmesia, R.C. Liebermann, M.T. Vaughan, Y. Wang, K. Leinenweber, R.E. Pacalo, A. Yenaneh-Haeri, and Y. Zaoh (1993), In situ high P-T X ray diffraction studies on three polymorphs (α,β,γ) of Mg2SiO4, J. Geophys. Res. 98(B12),
22199-22207.
McNamara, A.K., P.E. van Keken and S. Karato (2002), Development of anisotropic structure in the Earth's lower mantle by solid-state convection, Nature, 416, 310-314. Mohiuddin, A., M.D. Long and C. Lynner (2015), Mid-mantle seismic anisotropy beneath
southwestern Pacific subduction systems and implications for mid-mantle deformation, Phys. Earth Planet. Inter., 245, 1-14.
Montagner, J.-P., G. Burgos, M. Drilleau, E. Beucler, Y. Capdeville, A. Mocquet and J. Trampert (2012), Seismic anisotropy in the transition zone of the mantle, Geophys. Res. Abstracts, 14, EGU2012-9951.
Mosenfelder, J.L., F.C. Marton, C.R.II Ross, L. Kerschhofer and D.C Rubie (2001), Experimental constraints on the depth of olivine metastability in subducting lithosphere, Phys. Earth Planet. Inter., 127, 165-180.
Version postprint
Perrillat, J.-P., I. Daniel, N. Bolfan-Casanova, M. Chollet, G. Morard and M. Mezouar (2013), Mechanism and kinetics of the α–β transition in San Carlos olivine Mg1.8Fe0.2SiO4,
J. Geophys. Res., 118, 110–119.
Perrillat J.-P., M. Chollet, S. Durand, B. van de Moortèle, F. Chambat, H. Cardon, M. Mezouar and I. Daniel (2016), Kinetics of the olivine-ringwoodite transformation and seismic attenuation on the Earth's mantle transition zone, Earth Planet. Sci. Let., 433, 360– 369.
Poli, S. and M.W. Schmidt (2002), Petrology of subducted slabs, Annu. Rev. Earth Planet. Sci., 30, 207-235.
Poulsen, H.F. (2004), Three-Dimensional X-ray Diffraction Microscopy - Mapping Polycrystals and Their Dynamics. Berlin: Springer.
Poirier, J. P. (1981), On the kinetics of olivine-spinel transition, Phys. Earth Planet. Int., 26, 179–187.
Raterron, P., J. Chen and D.J. Weidner (2002), A process for low-temperature olivine-spinel transition under quasi-hydrostatic stress, Geophys. Res. Lett., 29, 36-31-36-34.
Ringwood, A.E. (1975), Composition and Petrology of the Earth's Mantle. New York: McGraw-Hill.
Riedel, M.R. and S. Karato, (1997), Grain-size evolution in subducted oceanic lithosphere associated with the olivine-spinel transformation and its effects on rheology, Earth Planet. Sci. Lett., 148, 1–2, 27-43.
Rosa, A.D., N. Hilairet, S. Ghosh, G. Garbarino, J. Jacobs, J.-P. Perrillat, G. Vaughan and S. Merkel, (2015), In-situ monitoring of phase transformation microstructures at Earth's mantle pressure and temperature using multi-grain XRD, J. Appl. Cryst., 48, 1346-1354. Rubie, D.C. (1984), The olivine + spine1 transformation and the rheology of subducting
Version postprint
Rubie, D.C., and P.E. Champness (1987), The evolution of microstructure during the transformation of Mg2GeO4 olivine to spinel. Bulletin de Mineralogie, I10, 471-480.
Rubie D.C. and A.J. Brearley (1990), Mechanism of the γ-β phase transformation of Mg2SiO4 at high temperature and pressure, Nature, 348, 628-631.
Rubie, D. C., Y. Tsuchida, T. Yagi, W. Utsumi, T. Kikegawa, O. Shimomura, and A. J. Brearley (1990), An in-situ X ray diffraction study of the kinerics of the Ni2SiO4 olivine spinel transformation, J. Geophys. Res., 95(B10), 15829-15844.
Rubie, D.C. (1993), Mechanisms and kinetics of solid-state reconstructive phase transformations in the Earth's mantle, in Short Course Handbook on Experiments at High Pressure and Applications to the Earth's Mantle, vol. 21, edited by R. W. Luth, 247–303 pp., Miner. Assoc. Can., Edmonton.
Rubie, D.C. and C.-R. Ross (1994), Kinetics of the olivine-spinel transformation in subducting lithosphere: Experimental constraints and implications for deep slab processes, Phys. Earth Planet. Inter., 86, 223–241.
Schmidt, S. (2014), GrainSpotter: a fast and robust polycrystalline indexing algorithm, J. Appl. Cryst., 47, 276-284, doi:10.1107/S1600576713030185.
Schmidt, S., H.F. Poulsen and G.B.M. Vaughan (2003), Structural refinements of the individual grains within polycrystals and powders, J. Appl. Cryst., 36, 326-332.
Sharp, T. G., G. Y. Bussod and T. Katsura (1994), Microstructures in β-Mg1.8Fe0.2SiO4
experimentally deformed at transition zone conditions, Phys. Earth Planet. Int., 86, 69-83. Shim, S.-H., T.S. Duffy and K. Takemura (2002), Equation of state of gold and its
application to the phase boundaries near 660 km depth in Earth‟s mantle, Earth Planet. Sci. Lett., 203, 729-739.
Shimojuku, A., K. Tomoaki, E. Ohtani, T. Nakamura, R. Okazaki, R. Dohmen and S. Chakraborty (2009), Si and O diffusion in (Mg,Fe)2SiO4 wadsleyite and ringwoodite and
Version postprint
its implications for the rheology of the mantle transition zone, Earth Planet. Sci. Lett., 284, 1–2, 103-112.
Smyth, J.R., D.J. Frost, F. Nestola, C.M. Holl and G. Bromiley (2006), Olivine hydration in the deep upper mantle: Effects of temperature and silica activity, Geophys. Res. Lett., 33, L15301.
Smyth, J.R., N. Miyajima, G.R. Huss, E. Hellebrand, D.C. Rubie and D.J. Forst (2012), Olivine–wadsleyite–pyroxene topotaxy: Evidence for coherent nucleation and diffusion-controlled growth at the 410-km discontinuity, Phys. Earth Planet. Inter., 200-201, 85-91. Solomatov, V. S. (1996), Can hotter mantle have a larger viscosity?, Geophys. Res. Lett., 23,
937–940.
Solomatov, V. S. (2001), Grain size-dependent viscosity convection and the thermal evolution of the Earth, Earth Planet. Sci. Lett., 191, 203–212.
Sørensen, H.O., S. Schmidt, J.P. Wright, G.B.M. Vaughan, S. Techert, E. Garman, J. Oddershede, J. Davaasambuu, K.S. Paithankar, C. Gundlach and H.F. Poulsen (2012), Multigrain crystallography, Z. Kristallogr., 227, 63-78.
Syracuse, E.M., P.E. van Keken and G.A. Abers (2010), The global range of subduction zone thermal models, Phys, Earth Planet. Inter., 183, 1–2, 73-90.
Tetzlaff, M. and H. Schmeling (2009), Time-dependent interaction between subduction dynamics and phase transition kinetics, Geophys. J. Int., 178, 826–844.
Van Keken, P.E., B.R. Hacker, E.M. Syracuse, G.A. Abers (2011), Subduction factory: 4. Depth‐dependent flux of H2O from s ubducting slabs worldwide, J. Geophys. Res., 116,
B01401.
Vaughan, P. J. and R. S. Coe (1981), Creep mechanism in Mg2GeO4: effects of a phase
Version postprint
Vaughan, P. J., H. W. Green, R. S. Coe (1984), Anisotropic growth in the olivine-spinel transformation of Mg2GeO4 under nonhydrostatic stress. Tectonophysics, 108, 299-322. Vaughan, G.B.M., S. Schmidt and H.F. Poulsen (2004), Multicrystal approach to crystal
structure solution and refinement, Z. Kristallogr., 219, 813-825.
Wang, Y., I. Martinez, F. Guyot and R.C. Liebermann (1997), The Breakdown of Olivine to Perovskite and Magnesiowustite, Science, 275(5299), 510-513.
Wenk, H.-R., I. Lonardeli, I., J. Pehl, J. Devine, V. Prakapenka, G. Shen, H.-K. Mao (2004), In situ observation of texture development in olivine, ringwoodite, magnesiowüstite and silicate perovskite at high pressure, Earth Planet. Sci. Lett., 226, 3–4, 507-519.
Wright, J. (2006), ImageD11, ESRF, Grenoble, France. http://sourceforge.net/projects/fable. Wu, T.-C., W.A. Bassett, P.C. Burnley and M.S. Weathers (1993), Shear-promoted phase
transitions in Fe2SiO4 and Mg2SiO4 and the mechanism of deep earthquakes, J. Geophys.
Res., 98, 19767-19776.
Yuan, K., and C. Beghein (2013), Seismic anisotropy changes across upper mantle phase transitions, Earth Planet. Sci. Lett., 374, 132–144.
Zhang, L., Meng, Y., Dera, P., Yang, W., Mao, W.L. and Mao, H.-k. (2013), Single-crystal structure determination of (Mg,Fe)SiO3 postperovskite , P. Natl. Acad. Sci. USA, 110, 6292-6295.
Version postprint
Tables
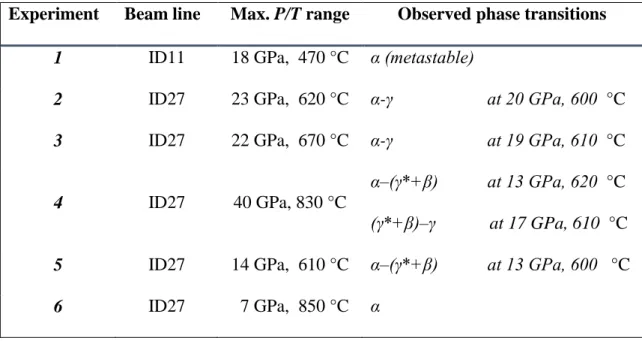
Table 1. Multi-grain diffraction experiments performed on the hydrous Mg2SiO4- 4500 ppm
H2O system at high P/T conditions. Experiments #1-3 have been already described in Rosa et
al. [2015]
Experiment Beam line Max. P/T range Observed phase transitions
1 ID11 18 GPa, 470 °C α (metastable)
2 ID27 23 GPa, 620 °C α-γ at 20 GPa, 600 °C
3 ID27 22 GPa, 670 °C α-γ at 19 GPa, 610 °C
4 ID27 40 GPa, 830 °C
α–(γ*+β) at 13 GPa, 620 °C (γ*+β)–γ at 17 GPa, 610 °C
5 ID27 14 GPa, 610 °C α–(γ*+β) at 13 GPa, 600 °C