HAL Id: hal-00722962
https://hal.archives-ouvertes.fr/hal-00722962
Submitted on 18 Aug 2015
HAL is a multi-disciplinary open access
archive for the deposit and dissemination of
sci-entific research documents, whether they are
pub-lished or not. The documents may come from
teaching and research institutions in France or
abroad, or from public or private research centers.
L’archive ouverte pluridisciplinaire HAL, est
destinée au dépôt et à la diffusion de documents
scientifiques de niveau recherche, publiés ou non,
émanant des établissements d’enseignement et de
recherche français ou étrangers, des laboratoires
publics ou privés.
nitrogen over the United States
C. L. Heald, J. L. Collett Jr., T. Lee, K. B. Benedict, F. M. Schwandner,
Yulun Li, L. Clarisse, D. R. Hurtmans, M. van Damme, Cathy Clerbaux, et al.
To cite this version:
C. L. Heald, J. L. Collett Jr., T. Lee, K. B. Benedict, F. M. Schwandner, et al.. Atmospheric
ammonia and particulate inorganic nitrogen over the United States. Atmospheric Chemistry and
Physics, European Geosciences Union, 2012, 12 (21), pp.10295-10312. �10.5194/acp-12-10295-2012�.
�hal-00722962�
doi:10.5194/acp-12-10295-2012
© Author(s) 2012. CC Attribution 3.0 License.
Chemistry
and Physics
Atmospheric ammonia and particulate inorganic nitrogen over the
United States
C. L. Heald1, J. L. Collett Jr.2, T. Lee2, K. B. Benedict2, F. M. Schwandner2,*, Y. Li2, L. Clarisse3, D. R. Hurtmans3, M. Van Damme3, C. Clerbaux3,4, P.-F. Coheur3, S. Philip5, R. V. Martin5, and H. O. T. Pye6
1Department of Civil and Environmental Engineering and Department of Earth, Atmospheric and Planetary Sciences, MIT, Cambridge, MA, USA
2Department of Atmospheric Science, Colorado State University, Fort Collins, CO, USA
3Spectroscopie de l’Atmosph`ere, Service de Chimie Quantique et Photophysique, Universit´e Libre de Bruxelles, Brussels, Belgium
4UPMC Univ. Paris 06, Universit´e Versailles St-Quentin, CNRS/INSU, LATMOS-IPSL, Paris, France 5Department of Physics and Atmospheric Science, Dalhousie University, Halifax, Canada
6US Environmental Protection Agency, Research Triangle Park, NC, USA
*now at: Earth Observatory of Singapore, Nanyang Technological University, Singapore
Correspondence to: C. L. Heald (heald@mit.edu)
Received: 18 July 2012 – Published in Atmos. Chem. Phys. Discuss.: 6 August 2012 Revised: 18 October 2012 – Accepted: 30 October 2012 – Published: 6 November 2012
Abstract. We use in situ observations from the Interagency
Monitoring of PROtected Visual Environments (IMPROVE) network, the Midwest Ammonia Monitoring Project, 11 sur-face site campaigns as well as Infrared Atmospheric Sound-ing Interferometer (IASI) satellite measurements with the GEOS-Chem model to investigate inorganic aerosol loading and atmospheric ammonia concentrations over the United States. IASI observations suggest that current ammonia emissions are underestimated in California and in the spring-time in the Midwest. In California this underestimate likely drives the underestimate in nitrate formation in the GEOS-Chem model. However in the remaining continental United States we find that the nitrate simulation is biased high (nor-malized mean bias > = 1.0) year-round, except in Spring (due to the underestimate in ammonia in this season). None of the uncertainties in precursor emissions, the uptake efficiency of N2O5on aerosols, OH concentrations, the reaction rate for the formation of nitric acid, or the dry deposition velocity of nitric acid are able to explain this bias. We find that reduc-ing nitric acid concentrations to 75 % of their simulated val-ues corrects the bias in nitrate (as well as ammonium) in the US. However the mechanism for this potential reduction is unclear and may be a combination of errors in chemistry, de-position and sub-grid near-surface gradients. This “updated”
simulation reproduces PM and ammonia loading and cap-tures the strong seasonal and spatial gradients in gas-particle partitioning across the United States. We estimate that nitro-gen makes up 15–35 % of inorganic fine PM mass over the US, and that this fraction is likely to increase in the coming decade, both with decreases in sulfur emissions and increases in ammonia emissions.
1 Introduction
Ammonia (NH3) is the most abundant form of gas-phase re-duced nitrogen in the atmosphere and contributes to both the formation of particulate matter (PM) and the deposition of re-active nitrogen to the environment. Particulate matter in the atmosphere degrades air quality and visibility and can mod-ify the radiative balance of the Earth both directly and indi-rectly through the formation of cloud droplets. Human mor-bidity has been shown to increase linearly with PM concen-trations (Dockery et al., 1993; Pope et al., 2009), even at low (< 10 µg m−3) concentrations (Crouse et al., 2012) suggest-ing that while air quality standards are set to protect human health, there are no “safe” levels of PM. Typically over half of the fine PM in the United States is made up of inorganic
aerosol (defined here as the sum of: sulfate, nitrate and am-monium) (NARSTO, 2004). These aerosols are formed in the atmosphere from gas-phase precursors (sulfur dioxide, nitro-gen oxides and ammonia), which are largely emitted from an-thropogenic activity, including agriculture. The formation of these aerosols is thermodynamically linked, with ammonium nitrate formation generally taking place only when sulfate has been fully neutralized. Ammonia sources have increased through the 20th century with industrial fertilizer produc-tion (Erisman et al., 2008), provoking concerns regarding ex-cess nitrogen deposition to sensitive ecosystems (Beem et al., 2010). Recent trends in wet deposition and air quality indi-cate that the relative role of reduced vs oxidized nitrogen is changing (Pinder et al., 2011). Thus ammonia and particulate nitrogen play important roles in both air quality and ecosys-tem health.
Model studies suggest that the reduction of SO2emissions in the US may shift aerosol composition towards nitrate for-mation (e.g. Pye et al., 2009) and that ammonia emissions control could play an increasing role in achieving compli-ance with air quality standards (Pinder et al., 2008; Pinder et al., 2007). While such predictions are predicated on accurate model descriptions of both ammonia and the complete inor-ganic gas-particle system, there have been few observational constraints available to verify the fidelity of these models. This is largely the result of the challenges of measuring am-monia, a sticky, semi-volatile compound with ambient con-centrations that vary over several orders of magnitude (von Bobrutzki et al., 2010). Model simulations have been widely validated against surface network observations of inorganic aerosol concentrations and wet deposition (e.g. Park et al., 2004; Adams et al., 1999; Bessagnet et al., 2004). Observa-tions of gas-phase precursors alongside aerosol concentra-tions are more rare. Efforts have been made to optimize inor-ganic aerosol precursor emissions based on observed particle concentrations (Henze et al., 2009), however errors in PM formation and loss may cloud the links between precursor emissions and ambient particle concentrations. Recently, in-frared satellite instruments have demonstrated the capability to measure ammonia from space (Beer et al., 2008; Clarisse et al., 2009). The spatial and continuous global coverage of such observations provides critical complementarity to spe-cific field campaign observations. However, the sensitivity of these infrared sounders can be limited, particularly as at-mospheric ammonia is largely present in the boundary layer, where thermal contrast can be low. Our goal here is to apply a series of unique satellite and surface inorganic measurements to investigate both atmospheric ammonia and particle phase nitrogen in the United States.
Thermodynamic models have been developed to describe the partitioning of semi-volatile species. Several studies have confirmed that the assumption of equilibrium partitioning is valid for ambient aerosol (e.g. Ellis et al., 2011; Nowak et al., 2010; Nowak et al., 2006). Thus 3-D model simulation errors are not likely to result from errors in the description of
thermodynamic partitioning but rather from (1) errors in pre-cursor emission estimates (2) errors in formation of sulfate or nitric acid (3) biases in temperature and humidity lead-ing to biased gas-particle partitionlead-ing or (4) errors in gas and particle deposition. Here we investigate the skill of the GEOS-Chem global model in reproducing regional ammo-nia loadings and inorganic concentrations and partitioning. We note that the study of Walker et al, (2012), completed at the same time as this work, addresses some of the same is-sues, with a focus on California, and reports similar results to those presented here. Our objective is to identify obvious biases in the key processes outlined above and to suggest what kind of field measurements could be particularly valu-able. Routine measurement of ammonia will be added in the coming years to select sites in the IMPROVE network in the United States, providing additional constraints on inorganic gas-particle partitioning. These future observations and those discussed herein can contribute to an improved understand-ing of the complete inorganic system. This will be critical to the accurate interpretation of new satellite observations of ammonia and resulting estimates of the role of nitrogen in PM formation, climate, and ecosystem health.
2 Measurement description
2.1 IMPROVE network aerosol measurements and the Midwest Ammonia Monitoring Project
The Interagency Monitoring of PROtected Visual Environ-ments (IMPROVE) network of stations was established in 1987 to monitor visibility in national parks and other pro-tected environments in the United States (Malm et al., 1994). Surface concentrations of fine particle (PM2.5) sulfate, ni-trate, organic carbon and elemental carbon are measured as 24-h averages every third day. The ammonium ion is not routinely measured in the IMPROVE network. Nitrate (and sulfate) are collected on a Nylasorb substrate after pass-ing through a carbonate denuder tube, minimizpass-ing both ni-trate volatilization and gas-phase contamination (Malm et al., 2004). We show here comparisons at 238 sites operating in 2004 in the continental United States.
We also examine measurements from the Midwest Am-monia Monitoring Project (MWNH3), a field intensive at 10 sites (9 co-located at IMPROVE sites) from November 2003 through October 2005 (Blanchard and Tanenbaum, 2005; Sweet et al., 2005). We show only measurements from 2004. Measurements of fine particle sulfate, nitrate, ammonium as well as gas-phase ammonia, nitric acid and sulfuric acid were collected every 6th day by the Illinois State Water Survey. The measurement system consisted of two denuders, one to collect HNO3and SO2and the second to collect NH3, fol-lowed by a Teflon and Nylon filter to collect the particles. Measured sulfate and nitrate agreed well with co-located IM-PROVE measurements (Blanchard and Tanenbaum, 2005).
25oN 30oN 35oN 40oN 45oN 120oW 100oW 80oW Yosemite, CA San Gorgonio, CA Grand Canyon, AZ Big Bend, TX Bondville, IL Brigantine, NJ Boulder, WY RMNP, CO Great Smoky Mtns, TN Brush, CO Loveland, CO 1999 2002 2003 2004 2009
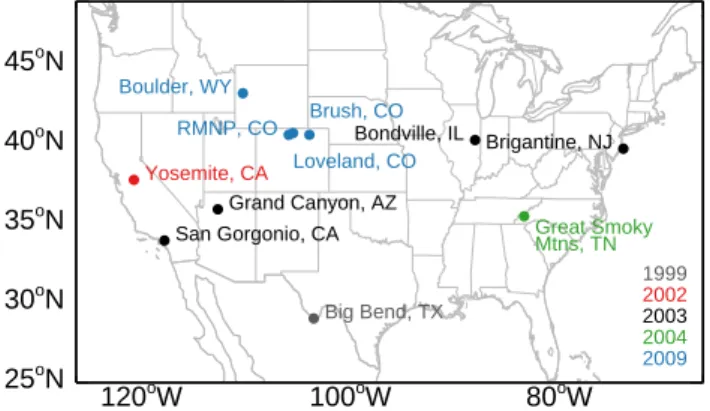
Fig. 1. Surface measurement site locations, colored by year of
mea-surement.
2.2 In situ measurements
Several field experiments were designed and conducted to investigate the chemical composition of PM2.5 aerosol and the concentrations of trace gases (HNO3, NH3 and SO2) at monitoring locations for the IMPROVE program from the late 1990’s through 2010 (Fig. 1). Daily 24-h mea-surements were made in a variety of seasons during 1999, 2002, 2003 and 2004. Study sites included Big Bend Na-tional Park (July–October 1999), Yosemite NaNa-tional Park (July–September 2002), Bondville, Illinois (February 2003), San Gorgonio Wilderness Area, California (April and July 2003), Grand Canyon National Park, Arizona (May 2003), Brigantine National Wildlife Refuge, New Jersey (Novem-ber 2003), and Great Smoky Mountains National Park, Ten-nessee (July/August 2004). Aerosol composition measured at these sites has previously been reported (Yu et al., 2005b, 2006; Lee et al., 2004, 2008a). In addition, a series of year-long intensive measurements were made in Rocky Moun-tain National Park (November 2008–October 2009, daily), Boulder, WY (December 2006–December 2010, 3 and 4-day average), and Brush and Loveland, CO (December 2008-November 2009, weekly average).
A URG (University Research Glassware) cyclone/annular denuder/filter pack system was used for PM2.5 and trace gas (HNO3, NH3and SO2) sampling. Ambient air is drawn into the URG sampler through a cyclone (D50= 2.5 µm, 10 LPM), and through two denuders in series for collection of the gaseous species of interest. Na2CO3(or NaCl for Big Bend NP and Boulder, WY) coated the first denuder for collec-tion of gaseous HNO3and SO2and the second denuder was coated with phosphorus acid (or citric acid for Big Bend NP) to collect gaseous NH3. SO2concentrations are not measured at Big Bend NP or in Boulder, WY. The air stream continued through either a nylon filter (Nylasorb, 1.0 µm pore size, Pall Corporation) and a backup phosphorus acid-coated denuder or a 3-stage filter pack with a Teflon filter (Teflo, 2.0 µm pore size, Pall Corporation), a nylon filter (Nylasorb, 1.0 µm pore size, Pall Corporation) and a backup citric acid-coated
cel-lulose filter (or quartz filter). Sampling at the ammonia-rich Brush, CO site was performed with a lower flow rate (3 LPM) and with an extra ammonia denuder before the filter to ensure that ammonia collection capacity was not exceeded. Analy-sis of PM2.5 filter and denuder extracts focused on the main PM2.5 ionic species (SO2−4 , NO−3, NH+4), and trace gases (HNO3, NH3 and SO2). Sampling and analysis details are described in detail elsewhere (Yu et al., 2005b; Lee et al., 2004; Lee et al., 2008b). Species detection limits were typi-cally 20–70 ng m−3while measurement precisions were typ-ically in the range of 3–9 % (RSD) for individual samples, but are correspondingly smaller for the monthly or seasonal means shown here. Accuracy checks on key components of the measurement (sample volume, extract volume, and ion concentration) typically reveal biases of a few percent, with a range from approximately 1–10 %. PM2.5 ion concentra-tions measured with the URG compare well (R2>0.9 and mean biases less than 10 % across the US) with online mea-surements, as discussed by Lee et al. (2008b).
2.3 Infrared Atmospheric Sounding Interferometer (IASI)
The Infrared Atmospheric Sounding Interferometer (IASI) was launched aboard the MetOp-A platform in October 2006. This nadir sounder provides global measurements of a suite of atmospheric trace gases, including ammonia (Cler-baux, 2009). The instrument footprint (12 km x 12 km) is combined with extensive cross-track scanning (2200 km) to provide detailed global daily coverage. Measurements from sun-synchronous polar orbit are made twice daily at 9:30 and 21:30 local time.
Ammonia retrievals are based on an absorption feature
∼950 cm−1. Initial global retrievals reported by Clarisse et al. (2009) were based on a brightness temperature scaling approach, but here retrievals apply formal optimal estimation methods (Rodgers, 2000) to retrieve the profile of ammonia (ˆx):
ˆ
x = xa+A(x − xa) + ε (1)
where x is the true profile, xais the a priori constraint, which is a constant global moderately polluted mean profile from the TM5 model, and ε is the spectral measurement error. The averaging kernels (A) describe the vertical sensitivity of the instrument and depend on the thermal contrast and vertical distribution of ammonia. IASI NH3measurements are gener-ally most sensitive at 1–2 km altitude, where concentrations are highest and thermal contrast is sufficient for detection. Thermal contrast is also highest during daytime, and there-fore only daytime retrievals are used here. Retrieved am-monia is shown here as an integrated column concentration given the low vertical sensitivity.
The retrievals are performed in near real time using the fast radiative transfer model FORLI (Hurtmans et al., 2012). Note that with the constraints applied to allow for global retrievals,
the averaging kernels and degrees of freedom (DOF) are un-realistically small for this research product (typically < 0.3 over the continental United States), especially in compari-son to the initial work of Clarisse et al. (2010) over the San Joaquin Valley. This does not impact the quality of the re-trievals; however, low DOFs imply larger reliance on the a priori when attempting to compare the IASI retrievals with other measurements or models. This is discussed further in Sect. 4.2.
3 Model description
We compare here measurements of the inorganic gas-particle system with the GEOS-Chem global model of atmo-spheric chemistry (www.geos-chem.org). We employ v9-01-01 of the model driven by GEOS-5 assimilated meteorology from the NASA Global Modeling and Assimilation Office (GMAO). We conduct a series of coupled oxidant-aerosol nested grid simulations (0.5◦×0.67◦ horizontal resolution) (Chen et al., 2009) over North America for three years (2004, 2009 and 2010) and show results over the continental United States. Boundary conditions are from global simulations per-formed at 2◦×2.5◦horizontal resolution for the same years.
The GEOS-Chem oxidant-aerosol simulation includes H2SO4-HNO3-NH3aerosol thermodynamics coupled to an ozone-NOx-hydrocarbon-aerosol chemical mechanism (Park et al., 2004). Partitioning of total ammonia and nitric acid between the gas and particle phases is calculated using the ISORROPIA II thermodynamic equilibrium model (Foun-toukis and Nenes, 2007) as implemented in GEOS-Chem by Pye et al. (2009). The gas-particle equilibrium considers sodium and chloride from accumulation mode sea salt as well as sulfate, nitrate and ammonium. Formation of inorganic aerosol on coarse mode dust and sea salt is excluded, thus estimated aerosol concentrations represent PM2.5 concentra-tions. In this implementation of ISORROPIA the inorganic aerosol are assumed to be metastable on the upper branch of the hygroscopicity hysteresis curve. The metastable assump-tion likely holds near the surface where relative humidities exceed the deliquescence relative humidity on a daily basis, but may not be appropriate in the free troposphere (Wang et al., 2008).
Anthropogenic emissions of aerosol precursors over the US are specified according to the US EPA National Emis-sion Inventory for 2005 (NEI05, with seasonality as in Park et al. (2004)), with biofuel emissions from the US EPA National Emission Inventory for 1999 (NEI99) and year-specific biomass burning from the GFED2 inventory (van der Werf et al., 2006). Anthropogenic emissions are scaled to the model year following national energy use statistics as de-scribed by van Donkelaar et al. (2008). Natural and agricul-tural ammonia emissions in GEOS-Chem follow the global inventory of Bouwman et al. (1997) with seasonal varia-tion as described by Park et al. (2004). Natural emissions of
DMS, NOxfrom lightning and soils, and sea salt depend on meteorology and are computed online in the model (see de-scription in Pye et al., 2009). Emission totals for ammonia, NOx and SOxover the United States for 2004 are given in Table 1.
Wet deposition of soluble aerosols and gases follows the scheme of Liu et al. (2001) including contributions from scavenging in convective updrafts, rainout, and washout. Dry deposition follows a standard resistance-in-series model (Wesely, 1989) and is discussed further in Sect. 4.3.
The GEOS-5 meteorology fields used here suffer from an artifically low mixed layer depth at nightime which can pro-duce large biases in simulated nighttime surface concentra-tions (and thus 24-h or monthly means). We implement a correction to the standard v9.01.01 version of GEOS-Chem by restricting the mixed layer depth from dropping below a minimum mechanical mixing depth, defined as a function of local friction velocity (Lin and McElroy, 2010; Koracin and Berkowicz, 1988). This restriction increases mean nighttime mixed layer depths by a factor or two and bring them in line with values measured at the ARM-Southern Great Plains site (Liu and Liang, 2010). This also elimiated the erroneously large increases in nitrate concentrations at night, decreasing annual mean nitrate concentrations across the US by 20 % on average.
Previous studies using GEOS-Chem and the MARS-A thermodynamic scheme have shown large biases (up to a fac-tor of two) in simulated nitrate over the United States (Park et al., 2004; Henze et al., 2009). Recent evaluation of the inor-ganic aerosol simulation using ISORROPIA also shows large biases in nitrate, which is overestimated by GEOS-Chem in the Eastern US and underestimated in the Western US (Pye et al., 2009). Zhang et al. (2012), using a similar model config-uration to our work (but using the MARS-A scheme), show that both nitric acid and ammonium nitrate concentrations are overestimated in the model when sulfate is unbiased, par-ticularly in wintertime. They suggest that this is the result of excessive HNO3formation via N2O5hydrolysis. In addition, they show that ammonia measurements in the upper Midwest support an increase in springtime emissions compared to the standard seasonality applied in GEOS-Chem based on Park et al. (2004).
We build on this work by bringing new measurements of both ammonia (satellite) and gas-particle partitioning (in situ) to bear on the inorganic system. We evaluate daily mean concentrations simulated for 2004 with the URG observa-tions from 1999, 2002, 2003 and 2004 described in Sect. 2. Thus interannual variability in meteorology may degrade the comparison, particularly the ability to reproduce daily vari-ability. The same 2004 simulation is compared to monthly mean measurements across the IMPROVE network and the Midwest Ammonia Monitoring Project. Monthly mean mea-surements from 2009 in Wyoming and Colorado are com-pared to the 2009 simulation. For comparison with IASI mea-surements we match simulated ammonia profiles with the
120o W 100o W 80o W 60o W 0.0 1.6 3.2 4.8 6.4 8.0 [µgm-3 ] -4.0 -2.0 0.0 2.0 4.0 90o S 60o S 30o S 0o 30o N 60o N 90o N 180o 120o W60o W 0o 60o E120o E180o 0 2 4 6 8 0 2 4 6 8 GEOS-Chem [ µ gm -3] R: 0.92 slope: 0.84 NMB: 0.10 90o S 60o S 30o S 0o 30o N 60o N 90o N 180o 120o W60o W 0o 60o E120o E180o 0 2 4 6 8 0 2 4 6 8 GEOS-Chem [ µ gm -3] R: 0.93 slope: 0.97 NMB: 0.06 90o S 60o S 30o S 0o 30o N 60o N 90o N 180o 120o W60o W 0o 60o E120o E180o 0 2 4 6 8 0 2 4 6 8 GEOS-Chem [ µ gm -3] R: 0.94 slope: 0.99 NMB: 0.01 90o S 60o S 30o S 0o 30o N 60o N 90o N 180o 120o W60o W 0o 60o E120o E180o 0 2 4 6 8 IMPROVE [µgm-3] 0 2 4 6 8 GEOS-Chem [ µ gm -3] R: 0.94 slope: 1.22 NMB: 0.30 DJF MAM JJA SON
IMPROVE Sulfate GEOS-Chem Obs-Model
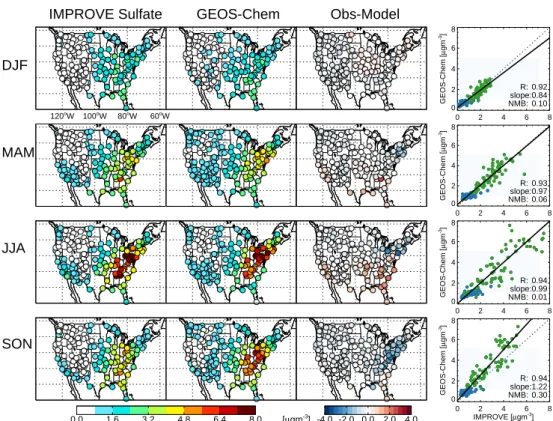
Fig. 2. Sulfate mean seasonal surface concentrations measured, simulated with GEOS-Chem (baseline simulation), and the difference at
IMPROVE sites in 2004. Scatterplot of seasonal means also shown with reduced-major-axis regression fit (solid black line). Correlation coefficient (R), slope and normalized mean bias (NMB) shown in inset. Sites located west of 100◦W shown in blue, sites east of this longitude shown in green (longitude labels given in top panel for reference).
location and time of each retrieval and then apply the IASI averaging kernel and a priori ammonia profile as in Eq. (1), and integrate over the vertical column. The paired compar-isons are then re-gridded to the GEOS-Chem horizontal res-olution.
4 Results
4.1 Initial fine PM evaluation
The over 200 IMPROVE stations reporting surface PM2.5 composition in 2004 provide dense coverage of the United States and a good basis for model evaluation. Figure 2 shows that the model reproduces the spatial and seasonal distribu-tion of observed sulfate in 2004, with a small positive bias in the Northeast in the summer/fall (responsible for the normal-ized mean bias of 0.30 in the Fall; NMB = 6iMi−Oi/ 6iOi, where Oi= observed values and Mi= model values) and a small underestimate in the Southeast in summertime. However regression slopes between observed and simulated means are close to unity, with the exception of the Northeast in the fall, and thus these errors do not substantially degrade the model simulation of PM.
Figure 3 shows the same comparison for nitrate. The model captures the large scale patterns and seasonality, with two obvious, significant biases. Nitrate concentrations are underestimated in California, possibly due to an underes-timate of ammonia or nitrogen oxide emissions in the re-gion. The model underestimate of nitrate in the southwest may also be associated with the failure to represent coarse mode nitrate on dust, the tail of which Lee et al. (2008a) show can be included in PM2.5 measurements. Nitrate con-centrations are overestimated in the rest of the United States year-round. This is consistent with the overestimate reported in other studies using both GEOS-Chem and other models (Pye et al., 2009; Henze et al., 2009; Zhang et al., 2012; Yu et al., 2005a; Walker et al., 2012). Note that regression lines and NMB statistics are shown separately for the Eastern and Western US to demonstrate these differences. In the Eastern United States normalized mean biases are close to or greater than 1.0 in all seasons, except spring. Similar biases are seen with respect to CASTNet network observations of both ni-trate and ammonium (not shown here, but reported by Zhang et al. (2012)). However CASTNet measurements do not pro-vide a good quantitative test of the fine PM simulation given that measurements may include contamination from coarse mode nitrate (no size-selective sampling) which can be sig-nificant (Lee et al., 2008a), and CASTNet ammonium nitrate
0.0 1.0 2.0 3.0 4.0 5.0 [µgm-3 ] -2.5 -1.2 0.0 1.2 2.5 90o S 60o S 30o S 0o 30o N 60o N 90o N 180o 120o W60o W 0o 60o E120o E180o 0 1 2 3 4 5 0 1 2 3 4 5 GEOS-Chem [ µ gm -3] R: 0.75 slope: 1.44 NMB: 0.26 0.95 90o S 60o S 30o S 0o 30o N 60o N 90o N 180o 120o W60o W 0o 60o E120o E180o 0 1 2 3 4 5 0 1 2 3 4 5 GEOS-Chem [ µ gm -3] R: 0.77 slope: 1.04 NMB: 0.02 0.15 90o S 60o S 30o S 0o 30o N 60o N 90o N 180o 120o W60o W 0o 60o E120o E180o 0 1 2 3 4 5 0 1 2 3 4 5 GEOS-Chem [ µ gm -3] R: 0.47 slope: 2.17 NMB: 0.19 1.97 90o S 60o S 30o S 0o 30o N 60o N 90o N 180o 120o W60o W 0o 60o E120o E180o 0 1 2 3 4 5 IMPROVE [µgm-3 ] 0 1 2 3 4 5 GEOS-Chem [ µ gm -3] R: 0.47 slope: 1.19 NMB: 0.26 1.66 DJF MAM JJA SON
IMPROVE Nitrate GEOS-Chem Obs-Model
Fig. 3. Nitrate mean seasonal surface concentrations measured, simulated with GEOS-Chem (baseline simulation), and the difference at
IMPROVE sites in 2004. Scatterplot of seasonal means also shown with reduced-major-axis regression fit (solid black line). Sites located west of 100◦W shown in blue, sites east of this longitude shown in green, with reduced-major-axis regression fits for each shown separately as solid lines. Correlation coefficient (R), slope and normalized mean bias (NMB) for east and west region shown in inset.
measurements are more susceptible to re-volatilization errors from the Teflon filters used (Ames and Malm, 2001).
Potential causes for the nitrate overestimate seen in Fig. 3 include (1) overestimated precursor emissions of either am-monia or nitrogen oxides (2) excess nitric acid formation (3) an underestimate in nitrate (or nitric acid) deposition (4) a cold or wet bias in the model that favors excess ammonium nitrate formation or (5) the absence of HNO3reactions with coarse mode PM. We explore the bias in simulated nitrate in the following sections.
4.2 Investigating ammonia emissions
Extensive evaluation of the GEOS-Chem in the US against aircraft and satellite observations effectively precludes errors in NOxemissions as the source of the observed nitrate bias (Lamsal et al., 2011; Zhang et al., 2012; Martin et al., 2006). However, ammonia emissions are poorly constrained.
Figure 4 compares seasonal gridded mean ammonia con-centrations observed by the IASI instrument with the GEOS-Chem simulation from May 2009 through April 2010. Only gridboxes with at least 4 observations during a season are shown in order to avoid drawing conclusions from limited, variable measurements. We first show the number of re-trievals averaged in each gridbox, to demonstrate both the
extensive cross-track coverage of IASI, and the seasonal vari-ability in the number of successful retrievals of ammonia. This is most likely due to cloud coverage, particularly in the fall and winter. We also see in Fig. 4 the high degree of reliance on the a priori in the retrieval. This is particularly evident when comparing the native GEOS-Chem simulation with the “retrieved” simulation where the IASI ammonia av-eraging kernel and a priori are applied as in Eq. (1). Both the IASI and GEOS-Chem retrieved values rarely drop below the a priori column concentration (∼0.3 × 10¹⁶molecules cm−2) and seasonality is reduced, consistent with the reported char-acteristics of the ammonia retrievals for the Tropospheric Emission Spectrometer (TES) (Shephard et al., 2011). Fur-thermore, all the features of the GEOS-Chem ammonia dis-tribution are considerably damped by application of the av-eraging kernel.
IASI ammonia concentrations peak in the springtime in the Midwest, in contrast with simulated concentrations which peak in the summertime. However, comparison of the na-tive and retrieved GEOS-Chem fields suggest that IASI sen-sitivity in the Midwest may be lower in the summer than the springtime, which may contribute to this apparent differ-ence. The distribution of simulated ammonia agrees reason-ably well in the region in summertime, but the comparison suggests that springtime ammonia emissions are far too low
4 40 400 0.00 0.15 0.30 0.45 0.60 [x1016 molec cm-2]
# Retrievals IASI GEOS-Chem GEOS-Chem
(Retrieved) IASI - GEOS-Chem(Retrieved)
DJF -0.30 -0.15 0.00 0.15 0.30 [x1016 molec cm-2] MAM JJA SON
Fig. 4. Comparison of atmospheric ammonia column concentrations observed by IASI and simulated with the baseline GEOS-Chem model
over the United States from May 2009 through April 2010. The IASI retrieval averaging kernel and a priori have been applied to the GEOS-Chem simulation as in Eq. (1) (4th column) for quantitative comparison with the satellite observations. Gridded model and observations only shown in gridboxes with 4 or more retrievals per season. Color scales are saturated at respective values.
Table 1. Continental US emissions for 2004. Ammonia emissions
with “new seasonality” shown in brackets (see Sect. 4.2). Species Emission Ammonia (NH3) Anthropogenic Biofuel Biomass Burning Natural 2.8 (3.3) TgNyr−1 2.0 (2.5) 0.2 0.002 0.6
Sulfur Oxides (SOx)
Anthropogenic Biofuel Aircraft Biomass Burning Volcanic 6.8 Tg S yr−1 6.7 0.001 0.01 0.09 0.02
Nitrogen Oxides (NOx)
Anthropogenic Biofuel Aircraft Fertilizer Biomass Burning Lightning Soil 6.8 Tg N yr−1 5.5 0.01 0.2 0.09 0.03 0.7 0.4
in GEOS-Chem. This is consistent with Zhang et al. (2012) who find that comparisons with the MWNH3 observations support a broadening of the NH3emission peak from sum-mer into spring and fall, with more than a doubling of March and April emissions. Total US ammonia emissions increase by 18 % (see Table 1). Some previous studies also support a springtime peak in ammonia emissions in the United States (Pinder et al., 2006; Gilliland et al., 2006); however, opti-mized ammonia emissions from Henze et al.(2009) peak in the summertime. These differences in part confirm the chal-lenge of constraining ammonia emissions from wet deposi-tion or aerosol measurements as done in the preceding stud-ies. The increase in springtime ammonia concentrations re-sulting from applying the Zhang et al. (2012) seasonality in GEOS-Chem is washed out when the IASI averaging ker-nels are applied and does not close the gap with the IASI observations. In fact, an extremely large and likely unrealis-tic increase in ammonia concentrations (in excess of a factor of 5) would be required to reconcile the GEOS-Chem sim-ulation with the IASI measurements over the Midwest. As discussed in Sect. 2.3 this is due to the artificially low IASI degrees of freedom for signal such that the averaging ker-nels do not accurately represent the balance between a pri-ori and detected information in the retrieval. Thus, for this study, the IASI retrievals are only used qualitatively. In light of this, we conclude that IASI measurements support the
0.0 0.2 0.4 0.6 0.8 1.0 1.2 1.4 Observations Model (new seas) Model (baseline) 0 2 4 6 8 10 12 0 2 4 6 8 10 12 0.0 0.5 1.0 1.5 2.0 0 2 4 6 8 10 12 0 2 4 6 8 10 12 0 1 2 3 4 5 6 0 2 4 6 8 10 12 0 2 4 6 8 10 12 J F M A M J J A S O N D 0 2 4 6 8 10 12 0 2 4 6 8 10 12 0 2 4 6 8 10 12 a) Boulder, WY b) RMNP, CO c) Loveland, CO d) Brush, CO NH 3 [ µ gm -3 ]
Fig. 5. Timeseries of year-long monthly mean ammonia
concentra-tions measured (black) and simulated (red) in 2009 at 4 sites (from west to east): (a) Boulder, WY, (b) Rocky Mountain National Park, CO, (c) Loveland, CO and (d) Brush, CO. Both the baseline sim-ulation (dotted) and simsim-ulation with updated ammonia emissions seasonality (solid) are shown. Standard deviations of the individual observations averaged for each month are shown as error bars.
springtime enhancement of ammonia emissions suggested by Zhang et al. (2012) and include this increase in the compar-isons that follow (referred to as “New NH3 Seasonality”). Wells et al. (2012) find a similar springtime underestimate of methanol in the GEOS-Chem simulation compared to the IASI methanol retrievals, which they attribute to an underes-timate of biogenic emissions from new leaves in mid-latitude ecosystems. Ammonia emissions from vegetation are negli-gible (Guenther et al., 2012), thus enhanced springtime emis-sions are far more likely associated with agricultural prac-tices, for example earlier fertilizer application in the Mid-west, or seasonal changes in cattle feed availability and asso-ciated emissions (Hristov et al., 2011).
Figure 4 also indicates that ammonia emissions in Cali-fornia and particularly in the San Joaquin Valley (SJV) are underestimated in GEOS-Chem. This mainly rural and agri-cultural region features some of the largest ammonia emis-sions in the country (Goebes et al., 2003; Makar et al., 2009),
and regularly reports some of the highest PM loading in the United States (Chow et al., 1996; Watson et al., 2000), leading to frequent violations of the National Ambient Air Quality Standards. Clarisse et al. (2010) previously estimated that mean summertime surface ammonia concentrations in the SJV regionally exceed 15 ppb. Figure 4 shows that Cal-ifornia is well-observed by IASI, with the exception of the wintertime, and while the spatial and seasonal patterns of enhanced ammonia are captured by Chem, GEOS-Chem concentrations significantly underestimate IASI from spring through fall. Retrieval characteristics preclude a quan-titative estimate of the associated emissions gap (see previous discussion); however, an underestimate in ammonia in the re-gion is consistent with the ammonium nitrate formation un-derestimate implied by the nitrate unun-derestimate in the region (Fig. 3), as also suggested by Walker et al. (2012). Nowak et al. (2012) report an underestimate of dairy emissions in the South Coast Air Basin in the NEI-05 emission inventory which could contribute to the underestimate in California.
Figure 5 presents a further evaluation of simulated ammo-nia, which illustrates some of the challenges associated with local comparisons and strong regional gradients. We com-pare simulated and measured ammonia at four field sites lo-cated in some proximity (within 700 km, Fig. 1). The model (with “New NH3Seasonality” emissions as discussed above) reproduces ammonia well at the rural site in Wyoming which is removed from local sources. The Colorado sites represent a strong west to east gradient from the very clean Rocky Mountain National Park to Brush, CO which is east and often down-wind of one of the largest inventories of cattle in the United States (Weld County). Observed monthly mean am-monia concentrations increase more than 20-fold across this gradient, while model concentrations at most double. While the underestimation of ammonia emissions associated with these agricultural operations has a limited impact on ammo-nium nitrate formation in the model (limited by the nitric acid supply), it implies potentially large underestimates of simu-lated regional nitrogen deposition.
The qualitative information provided by the IASI instru-ment suggests that the ammonia emissions biases may be re-sponsible for two aspects of the GEOS-Chem nitrate simu-lation shown in Fig. 3: (1) The underestimate of nitrate in California is associated, at least in part, with an underesti-mate in ammonia emissions in the region. (2) A springtime underestimate of ammonia emissions in the Midwest masks some of the bias in nitrate present year-round in the simu-lation. Increasing the ammonia emissions in springtime as suggested by Zhang et al. (2012) increases the nitrate bias seen in Fig. 3 (slope increases from 1.04 to 1.77 – see in-crease in annual mean nitrate concentrations in Fig. 6). Thus, while further validation of ammonia emission inventories is clearly called for, there is no evidence to suggest that the ex-cess nitrate levels in GEOS-Chem are associated with biases in emissions.
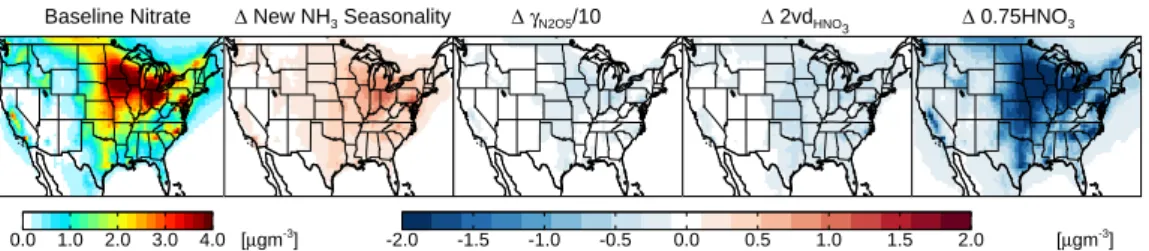
Baseline Nitrate ∆ New NH3 Seasonality ∆γN2O5/10 ∆ 2vdHNO3 ∆ 0.75HNO3
0.0 1.0 2.0 3.0 4.0 [µgm-3
]
-2.0 -1.5 -1.0 -0.5 0.0 0.5 1.0 1.5 2.0 [µgm-3
]
Fig. 6. Annual mean simulated surface nitrate (left) and the difference from this baseline (labeled as 1) for four sensitivity simulations.
The four sensitivity simulations are as follows from left to right: (1) The increase in springtime ammonia emissions, (2) the decrease in the uptake coefficient of N2O5by a factor of 10, (3) a doubling of the dry deposition velocity for nitric acid and (4) a reduction of nitric acid concentrations to 75 % of baseline values.
4.3 Further exploration of the nitrate bias
Alternate explanations for the nitrate bias in the GEOS-Chem model include errors in nitric acid formation or deposition. Surface nitric acid concentrations are challenging to evaluate as a result of the strong vertical gradient associated with sur-face uptake. Zhang et al. (2012) make an attempt to account for this by adjusting the lowest model gridbox center (70 m) simulated concentrations to the 10 m CASTNet measurement altitude using an aerodynamic resistance correction. They re-port an 18 % annual average high bias in the model following this correction, which they attribute to an overestimation of nitric acid formation via N2O5hydrolysis on ammonium ni-trate aerosols. However this is unlikely given that McIntyre and Evans (2010) show that the sensitivity of the NOx bud-get to a decrease in the uptake coefficient of N2O5 is less than 10 % given the current values of the uptake coefficient assumed in GEOS-Chem. This is confirmed in Fig. 6 which shows that nitrate concentrations decrease by less than 10 % when the uptake coefficient of N2O5is reduced by an order of magnitude in the model.
Nitric acid formation could also be promoted by an exces-sively oxidizing environment. However, nitrate concentra-tions are found to be relatively insensitive to modest changes in OH. A reduction in simulated OH levels by 25 % does not impact simulated nitrate levels (within 5 % of baseline concentrations), as a reduction in nitric acid formation is somewhat compensated by an increase in lifetime. Similarly,
∼15 % overestimation of the reaction rate of NO2oxidation by OH suggested by recent studies (Mollner et al., 2010; Henderson et al., 2012), does not significantly impact nitrate concentrations at the surface over the United States (within 5 % of baseline GEOS-Chem simulated concentrations).
An additional sink of nitric acid, not considered in the GEOS-Chem simulation here, is the uptake of nitric acid on coarse mode dust or sea salt (e.g. Goodman et al., 2000; Abbatt and Waschewsky, 1998). Neglecting this effect could lead to a high bias in surface nitric acid, particularly in the southwest near dust sources, and in coastal regions influ-enced by coarse mode sea salt. However, Fairlie et al. (2010) show that including the uptake of nitric acid on dust in the
GEOS-Chem simulation does not eliminate the nitric acid bias in dusty outflow from Asia. Thus, while this effect may contribute locally to the model overestimate of nitric acid and fine particulate nitrate, it is unlikely that this can explain the fine nitrate surface bias through most of the eastern US.
Ammonium nitrate formation is favored in cold and hu-mid conditions. GEOS-Chem uses assimilated meteorology and thus temperature and relative humidity are unlikely to be subject to large systematic biases. Meteorological param-eters are not reported for the IMPROVE sites shown here, but were measured during the field intensives described in Sect. 2.2. A general comparison of 2004 simulated values with the temperature and relative humidity detected at these sites in various years does not reveal any consistent biases. It is therefore highly unlikely that a strong, consistent, year-round, cold and/or wet bias exists in the model which could be the cause of excess ammonium nitrate formation. Such a bias would also imply a corresponding underestimate in nitric acid, which is inconsistent with our simulations and the results of Zhang et al. (2012). We also verify that sur-face concentrations of ammonium nitrate are insensitive to the metastable assumption employed in our implementation of ISORROPIA II (see Sect. 3).
Errors in deposition of either particle or gas-phase nitrate could contribute to a biased simulation of nitrate. Zhang et al. (2012) show that annual mean wet deposition of nitrate in GEOS-Chem is biased slightly high but within 10 % of mea-surements from the National Atmospheric Deposition Pro-gram (NADP) over the continental United States. Dry depo-sition of aerosols is size-dependent in the model and any bias in this process would manifest itself in simulated sulfate as well as nitrate. As the sulfate simulation is relatively unbi-ased and dry deposition of particles makes a minor contribu-tion to total nitrogen deposicontribu-tion (Zhang et al., 2012) we rule this out as a dominant factor in the simulated nitrate over-estimate. However, the dry deposition velocity of nitric acid over various land types is considerably larger and not well constrained. Derived estimates from CASTNet sites across the United States vary from 0.8 to 3.3 cm s−1(Clarke et al., 1997). Schwede et al. (2011) show that the choice of depo-sition models can result in depodepo-sition velocities that differ
0.0 1.0 2.0 3.0 4.0 5.0 [µgm-3] -2.5 -1.2 0.0 1.2 2.5 90o S 60o S 30o S 0o 30o N 60o N 90o N 180o 120o W60o W 0o 60o E120o E180o 0 1 2 3 4 5 0 1 2 3 4 5 GEOS-Chem [ µ gm -3] R: 0.70 slope: 1.07 NMB: -0.33 0.42 90o S 60o S 30o S 0o 30o N 60o N 90o N 180o 120o W60o W 0o 60o E120o E180o 0 1 2 3 4 5 0 1 2 3 4 5 GEOS-Chem [ µ gm -3] R: 0.75 slope: 0.89 NMB: -0.49-0.10 90o S 60o S 30o S 0o 30o N 60o N 90o N 180o 120o W60o W 0o 60o E120o E180o 0 1 2 3 4 5 0 1 2 3 4 5 GEOS-Chem [ µ gm -3] R: 0.47 slope: 0.75 NMB: -0.78-0.19 90o S 60o S 30o S 0o 30o N 60o N 90o N 180o 120o W60o W 0o 60o E120o E180o 0 1 2 3 4 5 IMPROVE [µgm-3] 0 1 2 3 4 5 GEOS-Chem [ µ gm -3] R: 0.48 slope: 0.59 NMB: -0.60 0.15 DJF MAM JJA SON
IMPROVE Nitrate GEOS-Chem(Updated) Obs-Model
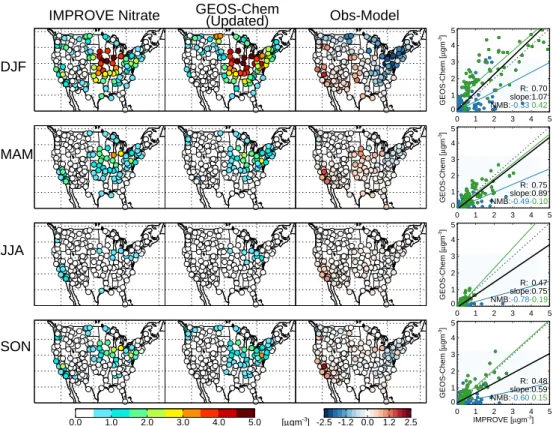
Fig. 7. Nitrate mean 1 seasonal surface concentrations measured, simulated with GEOS-Chem (updated simulation where HNO3is reduced
to 75 % of baseline concentrations), and the difference at IMPROVE sites in 2004. Scatterplot of seasonal means also shown with reduced-major-axis regression fit (solid black line). Sites located west of 100◦W shown in blue, sites east of this longitude shown in green, with reduced-major-axis regression fits for each shown separately as solid lines. Correlation coefficient (R), slope and normalized mean bias (NMB) for east and west region shown in inset. Compare to Fig. 3.
by a factor of 2 to 3, and that CASTNet estimates of nitric acid deposition velocities are consistently lower than compa-rable estimates derived using the CAPMoN network model. Annual mean simulated dry deposition velocities over the continental United States in GEOS-Chem vary from 0.2 to 3.9 cm s−1, a similar range to values estimated by CASTNet. Given the poor constraints on this value, we test the sensi-tivity of simulated nitrate to the deposition velocity for nitric acid by doubling this value year-round. Figure 6 shows that particulate nitrate concentrations decrease by less than 10 %, and therefore that uncertainties in deposition velocities can-not reconcile the GEOS-Chem simulation with the nitrate observations at the IMPROVE sites. Alvarado et al. (2010) previously showed that nitric acid concentrations measured during the ARCTAS campaign were overestimated by over a factor of two in GEOS-Chem and invoke insufficient pre-cipitation scavenging in the Arctic. A good simulation of the wet removal of aerosols over the continental United States (Fisher et al., 2011) in concert with the high solubility of nitric acid makes this an unlikely source of the bias here; however, uncertainties in precipitation distribution and fre-quency are large and we cannot rule out an underestimate of wet scavenging as a contributing factor in the nitrate bias.
Figure 6 shows that when nitric acid concentrations are ar-tificially decreased to 75 % of their values at each timestep (as an input to the thermodynamic gas-particle partitioning only), annual mean US surface nitrate concentrations can de-crease by up to 2 µg m−3. This decrease brings the nitrate simulation into near agreement with the IMPROVE measure-ments (Fig. 7), with the exception of California, where the existing bias is exacerbated (see Sect. 4.1). Nitrate concen-trations remain somewhat high in the Northeast (NMB = 0.42 for the Eastern US), particularly in winter when ammonium nitrate formation is favored. However, overall, model per-formance is substantially improved by this forced reduction in nitric acid with NMB values in the Eastern US consid-erably lower (all below 0.50) than baseline values shown in Fig. 3. Figure 8 shows how this decreased nitric acid brings the model into agreement with the ammonia, nitrate and am-monium observations from the Midwest Ammonia Monitor-ing Project in 2004. A reduction of nitric acid reduces ammo-nium nitrate formation and conversely forces more ammonia into the gas-phase, particularly in the fall and winter. Ammo-nium nitrate concentrations may still be overestimated in the simulation, consistent with the Fig. 6 comparison with IM-PROVE sites, but overall model bias is drastically reduced.
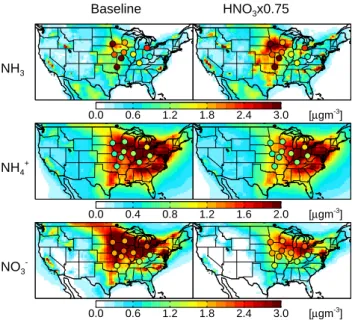
0.0 0.6 1.2 1.8 2.4 3.0 [µgm-3 ] 10o N 20oN 30oN 40oN 50o N 60oN 70oN 120oW 90oW 60oW NH3 Baseline HNO3x0.75 0.0 0.4 0.8 1.2 1.6 2.0 [µgm-3 ] 10oN 20oN 30oN 40oN 50oN 60oN 70o N 120o W 90o W 60o W NH4+ 0.0 0.6 1.2 1.8 2.4 3.0 [µgm-3 ] 10oN 20oN 30oN 40oN 50o N 60oN 70oN 120oW 90oW 60oW NO3
-Fig. 8. Annual mean concentrations of ammonia and speciated
fine ammonium nitrate during the Midwest Ammonia Monitor-ing Project in 2004. GEOS-Chem means (left=baseline simulation, right=updated simulation) are shown with observed means overlaid.
Figure 9 shows that this “updated” simulation with re-duced nitric acid also compares well with the year-round ni-trate observations in Wyoming and Colorado. Nini-trate at the Loveland and Brush sites is underestimated in the winter-time with the “updated” simulation, however Fig. 5 suggests that this is associated with an underestimated wintertime sup-ply of ammonia. Year-round cattle operations in the region likely maintain ammonia emissions in cooler seasons above the summertime-peaking seasonality currently applied to all anthropogenic ammonia emissions in the NEI-05 inventory. This calls for a dis-aggregation of ammonia emissions and an investigation of the seasonality of emissions in various sec-tors.
While we can identify no single process or uncertainty that could result in the current overestimation of surface ni-trate concentrations in the GEOS-Chem simulation, it is clear that a simple year-round reduction of nitric acid can improve model performance drastically. A number of processes may potentially contribute to this. First, while we have tested the impact of oxidant loading and N2O5hydrolysis, there may be other unrecognized chemical pathways for NOycycling which may reduce nitric acid formation. Second, an under-estimate of deposition of nitric acid could contribute to this bias, however as shown above, this cannot explain the entire model bias. Third, uptake of HNO3on coarse PM (not treated here) may reduce both nitric acid and nitrate concentrations, particularly in the dusty southwest. Fourth, the vertical sub-grid gradient of nitric acid at the surface may induce a sim-ilar gradient in ammonium nitrate formation which has not been accounted for here. Sievering et al. (2001) find that the
0.0 0.2 0.4 0.6 0.8 1.0 1.2 1.4 Observations Model (updated) Model (baseline) 0 2 4 6 8 10 12 0 2 4 6 8 10 12 0.0 0.2 0.4 0.6 0.8 1.0 1.2 1.4 0 2 4 6 8 10 12 0 2 4 6 8 10 12 0.0 0.5 1.0 1.5 2.0 2.5 3.0 0 2 4 6 8 10 12 0 2 4 6 8 10 12 J F M A M J J A S O N D 0 1 2 3 4 0 2 4 6 8 10 12 0 2 4 6 8 10 12 a) Boulder, WY b) RMNP, CO c) Loveland, CO d) Brush, CO Nitrate [ µ gm -3 ]
Fig. 9. Timeseries of year-long monthly mean fine nitrate
concentra-tions measured (black) and simulated (red) in 2009 at 4 sites (from west to east): (a) Boulder, WY, (b) Rocky Mountain National Park, CO, (c) Loveland, CO and d) Brush, CO (solid). Standard deviation of the individual observations averaged for each month shown as error bars.
vertical gradient in nitrate is weaker than for HNO3, suggest-ing that thermodynamic equilibrium may not be maintained through the surface layer. de Brugh et al. (2012) suggest that not accounting for this effect can mute the simulated diur-nal cycle. They recommend artificially increasing the alti-tude of the meteorological input parameters in coarse reso-lution models to correct for this effect; however, they show that this correction is only valid in unstable conditions. It is unclear how this would impact the comparison of daily mean surface concentrations. Additional time-resolved gas-particle vertical profile measurements through the boundary layer are required to investigate this phenomenon further and develop an appropriate global correction for coarse resolution mod-els such as GEOS-Chem. We note that no effort was made to optimize our artificial nitric acid reduction seasonally, and the uncertainties outlined above may play a role in different seasons, as well as different regions.
Jul13 Jul22 Jul30 Aug08 Aug17 Aug25 Sep03 0 5 10 15 20 25 Inorganic PM [µ gm -3] Yosemite N.P., CA (2002) Observed GEOS-Chem Sulfate Ammonium Nitrate
Jul13 Jul22 Jul30 Aug08 Aug17 Aug25 Sep03
0 5 10 15 20 25
Apr03 Apr23 May12 Jun01 Jun20 Jul10 Jul29
0 5 10 15 20 25 Inorganic PM [µ gm -3] San Gorgonio, CA (2003)
Apr03 Apr23 May12 Jun01 Jun20 Jul10 Jul29
0 5 10 15 20 25
Apr30 May05 May10 May15 May19 May24 May29
0 5 10 15 20 25 Inorganic PM [µ gm -3] Grand Canyon N.P., AZ (2003)
Apr30 May05 May10 May15 May19 May24 May29
0 5 10 15 20 25
Jun30 Jul20 Aug10 Aug30 Sep19 Oct10 Oct30
0 5 10 15 20 25 Inorganic PM [µ gm -3] Big Bend N.P., TX (1999)
Jun30 Jul20 Aug10 Aug30 Sep19 Oct10 Oct30
0 5 10 15 20 25
Feb01 Feb05 Feb10 Feb14 Feb18 Feb23 Feb27
0 5 10 15 20 25 Inorganic PM [µ gm -3] Bondville, IL (2003)
Feb01 Feb05 Feb10 Feb14 Feb18 Feb23 Feb27
0 5 10 15 20 25
Jul19 Jul24 Jul29 Aug03 Aug07 Aug12 Aug17
0 5 10 15 20 25 Inorganic PM [µ gm -3] Great Smoky Mtns N.P., TN (2004)
Jul19 Jul24 Jul29 Aug03 Aug07 Aug12 Aug17
0 5 10 15 20 25
Nov04 Nov08 Nov12 Nov17 Nov21 Nov25 Nov29
0 5 10 15 20 25 Inorganic PM [ µ gm -3] Brigantine, NJ (2003)
Nov04 Nov08 Nov12 Nov17 Nov21 Nov25 Nov29
0 5 10 15 20 25
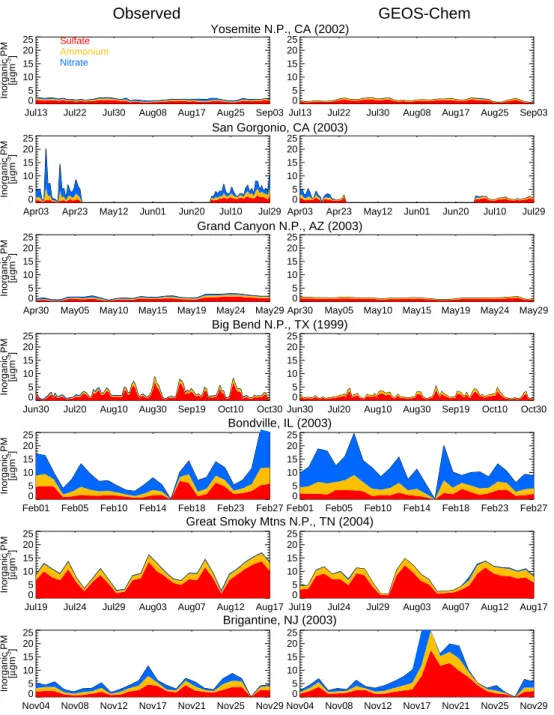
Fig. 10. Timeseries of daily mean aerosol concentrations observed (left) and simulated (right) at the 7 focus sites. GEOS-Chem simulation
is for 2004, years of measurements shown with site names.
4.4 Application of “updated” simulation
Figure 10 compares this “updated” (HNO3reduced to 75 %) simulation with the daily observations of inorganic PM from the seven focus sites (Sect. 2.2) as an independent check on the comparisons discussed in Sect. 4.3. The timeseries also illustrates the regional and temporal variability of inorganic PM across the United States. Sites are ordered roughly west to east. Note that measurements do not correspond to the 2004 year of the simulation for six of the seven sites, and thus meteorological variability can degrade these
compar-isons. The “updated” model simulation reproduces the char-acter of inorganic PM across the US both in magnitude and variability. Concentrations are highest in the East and contri-butions from nitrate are largest in the fall/winter and in the western US. Elevated PM concentrations are episodic and generally persist for 2–3 days.
The seasonal mean simulated gas fraction for the three in-organic classes (SOx, NHx and total nitrate) are compared to these same observations in Fig. 11. These patterns illus-trate the complex gas-particle partitioning regimes across
DJF
SO
2/SOx NH3/N(-III) HNO3/N(V)
0.0 0.2 0.5 0.8 1.0 MAM JJA SON
Fig. 11. Seasonal mean surface gas fractions simulated with GEOS-Chem for 2004. Mean observations (from 1999, 2002, 2003 and 2004)
overlaid on corresponding season. SO2concentrations were not measured at the Big Bend National Park site (Sect. 2.2).
the United States. This figure particularly illustrates the spa-tial variability in gas-particle partitioning and the necessity of using high-resolution simulations to resolve this behav-ior and usefully compare with in situ measurements. We see that sulfate formation is most efficient in the summertime due to higher oxidant loadings and that the short lifetime of SO2results in gas fraction hot spots near local sources. GEOS-Chem captures this seasonal SOxpartitioning across the United States, with the exception of the remote Brigan-tine, NJ site, which itself may experience predominantly pro-cessed emissions as sulfate, but which is located in a gridbox with fresh emissions.
Figure 11 shows that much of the ammonia in the eastern US neutralizes acidity in the region to form ammonium salts, and thus the N(-III) gas fraction is low. Important source re-gions in both California and the Midwest produce excess am-monia which locally remains predominantly in the gas-phase, particularly in the summertime. The model reproduces the observed N(-III) partitioning with the exception of the Big Bend site near the Texas-Mexico border. Observed concen-trations of ammonia are very low at this site (< 0.4 µg m−3), and are overestimated by the model by at least a factor of two (likely due to an underestimate in sulfate, Fig. 10). Given the low PM concentrations at the site, this significantly degrades the gas fraction comparison.
Much of the nitric acid in the Eastern US participates in ammonium nitrate formation given the up-wind source of ammonia from the Midwest. Conversely, much of the
DJF JJA
0.00 0.10 0.20 0.30 0.40 [gN g-1]
Fig. 12. Fraction of nitrogen in winter (left) and summer (right)
mean surface inorganic PM mass simulated with GEOS-Chem for 2004. Mean observations both from focus sites (from 1999, 2002, 2003 and 2004) and 2004 MWNH3 campaign overlaid on corre-sponding season.
ern US is limited by the ammonia supply. This East-West gradient in the N(V) gas fraction is reproduced by the model, with the exception of the San Gorgonio site in California in springtime, where both complex terrain unresolved by the model, and the ammonia underestimate discussed in Sect. 4.2 and seen in Fig. 4 likely play a role. We note that using sur-face measurements to evaluate the simulation of total nitrate partitioning presumes that any near-surface gradient is con-sistent between nitric acid and nitrate.
Figure 12 quantifies the nitrogen contribution to inorganic PM mass. In particular we see that in wintertime nitrogen makes up over a third of inorganic PM mass in the North-ern United States. In all seasons at least 15 % of continental inorganic PM mass is nitrogen, and this fraction will almost
certainly grow as drastic further reductions in sulfur emis-sions expected in the United States (van Vuuren et al., 2011) are likely to outpace the recent decline in NOx emissions (Pinder et al., 2011). Furthermore, organic nitrogen may con-tribute significant additional nitrogen mass to total fine PM (Fry et al., 2009; Rollins et al., 2009).
5 Conclusions
Model simulations of inorganic PM are typically evaluated by network measurements of sulfate and nitrate concentra-tions or wet deposition. Comparison of a 2004 GEOS-Chem simulation with observations of sulfate and nitrate at IM-PROVE sites reveals the following features: (1) a good sim-ulation of sulfate concentrations year-round with a modest high bias in the Northeast in the Fall and a modest under-estimate in the Southeast in the summer; (2) an underesti-mate of nitrate concentrations year-round in California and (3) a large positive bias in nitrate year-round across the rest of the United States, likely associated with an overestimate in nitric acid concentrations previously reported by Zhang et al. (2012). IASI observations confirm that ammonia concen-trations are underestimated in California and are likely the source of the nitrate underestimate in this region. A recent, independent study by Walker et al. (2012) reaches the same conclusion. A spatially diverse set of full year observations is required in the region to further characterize the emission discrepancies. Comparison with IASI also suggests that am-monia concentrations are underestimated in the springtime with current assumed emission seasonality, however increas-ing emissions in this region only exacerbates the nitrate bias. We explore the sensitivity of simulated nitrate to a number of uncertain model parameters related both to chemistry and deposition but are unable to identify the cause of the model overestimate. We do find that decreasing nitric acid concen-trations uniformly to 75 % of simulated values brings the model into close agreement with the IMPROVE nitrate mea-surements, as well as the ammonium and nitrate measured during the Midwest Ammonia Monitoring Project and the year-round nitrate measured at a suite of sites in Wyoming and Colorado. Further investigation into the role of sub-grid near-surface processes and the nitric acid budget are required to resolve this. In particular, tower-based measurements of the boundary layer vertical profile and fluxes could provide critical insight into this question. Further investigation of the importance of coarse mode nitrate as a control on nitric acid concentrations and fine particle nitrate throughout the US is also required.
We demonstrate the challenges of reproducing strong ammonia gradients near source regions. However we also show that the impact of underestimating ammonia near these sources on PM formation is limited, at least in the near-field. The fate of this excess ammonia and the prevalence of these underrepresented “hot spot” emissions in the United States
requires further investigation in order to accurately charac-terize local deposition and ecosystem response. Furthermore, our full year comparisons for sites in Wyoming and Colorado suggest that fertilizer and livestock ammonia emissions may exhibit quite different seasonality with implications for am-monium nitrate formation in wintertime.
This study uses a suite of in situ and satellite measure-ments, in particular focusing on ammonia, to evaluate our understanding of the inorganic gas-particle system. While we provide examples of model skill, the complexity of this system remains a challenge to capture with full fidelity. For example, inclusion of bi-directional treatment of ammonia fluxes may improve day-to-day variability in the model and the simulation of downwind concentrations (Cooter et al., 2010). Additional co-located measurements of both gas and particle phase inorganics are required to further constrain models and refine schemes that can be applied to accurately characterize both PM formation and nitrogen deposition in the United States.
Acknowledgements. This work was supported by NOAA
(NA12OAR4310064). Measurements at Big Bend NP, Yosemite NP, San Gorgonio, Bondville, Brigantine, Great Smoky Mountain NP, Rocky Mountain NP, Loveland Brush were supported by the National Park Service. Field assistance from D. Day, X. Yu, and B. Ayres is gratefully acknowledged. Measurements at Boulder, WY were supported by Shell Exploration and Development Company and taken in collaboration with Air Resource Specialists, Inc. IASI was developed and built under the responsibility of CNES and flies onboard the MetOp satellite as part of the Eumetsat Polar system. The IASI L1 data are received through the EUMETCast near real time data distribution service. LC, PFC and MVD are respectively Postdoctoral Researcher, Research Associate and FRIA grant holder with F.R.S.-FNRS. CC is grateful to CNES for scientific collaboration and financial support. The research in Belgium was funded by the BELSPO and ESA (Prodex arrangements). We acknowledge support from the ECLAIRE project (EU-FP7) and the “Actions de Recherche Concert´ees” (Communaut´e Franc¸aise de Belgique). RVM and SP acknowledge support from NSERC Canada. Although this paper has been reviewed by the EPA and approved for publication, it does not necessarily reflect EPA policies or views.
Edited by: J. G. Murphy
References
Aan de Brugh, J. M. J., Henzing, J. S., Schaap, M., Morgan, W. T., van Heerwaarden, C. C., Weijers, E. P., Coe, H., and Krol, M. C.: Modelling the partitioning of ammonium nitrate in the convective boundary layer, Atmos. Chem. Phys., 12, 3005–3023, doi:10.5194/acp-12-3005-2012, 2012.
Abbatt, J. P. D., and Waschewsky, G. C. G.: Heterogeneous interac-tions of HOBr, HNO3, O−3, and NO2with deliquescent NaCl
aerosols at room temperature, J. Phys. Chem. A, 102, 3719– 3725, doi:10.1021/jp980932d, 1998.
Adams, P. J., Seinfeld, J. H., and Koch, D. M.: Global concentra-tions of tropospheric sulfate, nitrate, and ammonium aerosol sim-ulated in a general circulation model, J. Geophys. Res.-Atmos., 104, 13791–13823, 1999.
Alvarado, M. J., Logan, J. A., Mao, J., Apel, E., Riemer, D., Blake, D., Cohen, R. C., Min, K. E., Perring, A. E., Browne, E. C., Wooldridge, P. J., Diskin, G. S., Sachse, G. W., Fuelberg, H., Sessions, W. R., Harrigan, D. L., Huey, G., Liao, J., Case-Hanks, A., Jimenez, J. L., Cubison, M. J., Vay, S. A., Weinheimer, A. J., Knapp, D. J., Montzka, D. D., Flocke, F. M., Pollack, I. B., Wennberg, P. O., Kurten, A., Crounse, J., St. Clair, J. M., Wisthaler, A., Mikoviny, T., Yantosca, R. M., Carouge, C. C., and Le Sager, P.: Nitrogen oxides and PAN in plumes from boreal fires during ARCTAS-B and their impact on ozone: an integrated analysis of aircraft and satellite observations, Atmos. Chem. Phys., 10, 9739–9760, doi:10.5194/acp-10-9739-2010, 2010. Ames, R. B. and Malm, W. C.: Comparison of sulfate and nitrate
particle mass concentrations measured by IMPROVE and the CDN, Atmos. Environ., 35, 905–916, 2001.
Beem, K. B., Raja, S., Schwandner, F. M., Taylor, C., Lee, T., Sul-livan, A. P., Carrico, C. M., McMeeking, G. R., Day, D., Levin, E., Hand, J., Kreidenweis, S. M., Schichtel, B., Malm, W. C., and Collett, J. L.: Deposition of reactive nitrogen during the Rocky Mountain Airborne Nitrogen and Sulfur (RoMANS) study, En-viron. Pollut., 158, 862–872, doi:10.1016/j.envpol.2009.09.023, 2010.
Beer, R., Shephard, M. W., Kulawik, S. S., Clough, S. A., Elder-ing, A., Bowman, K. W., Sander, S. P., Fisher, B. M., Payne, V. H., Luo, M. Z., Osterman, G. B., and Worden, J. R.: First satellite observations of lower tropospheric ammonia and methanol, Geo-phys. Res. Lett., 35, L09801, doi:10.1029/2008gl033642, 2008. Bessagnet, B., Hodzic, A., Vautard, R., Beekmann, M.,
Cheinet, S., Honore, C., Liousse, C., and Rouil, L.: Aerosol modeling with CHIMERE – preliminary evaluation at the continental scale, Atmos. Environ., 38, 2803–2817, doi:10.1016/j.atmosenv.2004.02.034, 2004.
Blanchard, C. L. and Tanenbaum, S.: Draft Final Technical Memo-randum: Analysis of Data from the Midwest Ammonia Monitor-ing Project, Envair, Albany, CA, USA, 2005.
Bouwman, A. F., Lee, D. S., Asman, W. A. H., Dentener, F. J., Van-der Hoek, K. W., and Olivier, J. G. J.: A global high-resolution emission inventory for ammonia, Glob. Biogeochem. Cy., 11, 561–587, 1997.
Chen, D., Wang, Y., McElroy, M. B., He, K., Yantosca, R. M., and Le Sager, P.: Regional CO pollution in China simulated by the high-resolution nested-grid GEOS-Chem model, Atmos. Chem. Phys. Discuss., 9, 5853—5887, doi:10.5194/acpd-9-5853-2009, 2009.
Chow, J. C., Watson, J. G., Lu, Z. Q., Lowenthal, D. H., Frazier, C. A., Solomon, P. A., Thuillier, R. H., and Magliano, K.: Descrip-tive analysis of PM(2.5) and PM(10) at regionally representaDescrip-tive locations during SJVAQS/AUSPEX, Atmos. Environ., 30, 2079– 2112, 1996.
Clarisse, L., Clerbaux, C., Dentener, F., Hurtmans, D., and Coheur, P. F.: Global ammonia distribution derived from infrared satellite observations, Nature Geosci., 2, 479–483, doi:10.1038/ngeo551, 2009.
Clarisse, L., Shephard, M. W., Dentener, F., Hurtmans, D., Cady-Pereira, K., Karagulian, F., Van Damme, M., Clerbaux, C., and
Coheur, P. F.: Satellite monitoring of ammonia: A case study of the San Joaquin Valley, J. Geophys. Res.-Atmos., 115, D13302, doi:10.1029/2009jd013291, 2010.
Clarke, J. F., Edgerton, E. S., and Martin, B. E.: Dry Deposition Cal-culations for the Clean Air Status and Trends Network, Atmos. Environ., 31, 3367–3678, 1997.
Clerbaux, C., Boynard, A., Clarisse, L., George, M., Hadji-Lazaro, J., Herbin, H., Hurtmans, D., Pommier, M., Razavi, A., Turquety, S., Wespes, C., and Coheur, P.-F.: Monitoring of atmospheric composition using the thermal infrared IASI/MetOp sounder, At-mos. Chem. Phys., 9, 6041–6054, doi:10.5194/acp-9-6041-2009, 2009.
Cooter, E. J., Bash, J. O., Walker, J. T., Jones, M. R., and Robarge, W.: Estimation of NH3 bi-directional flux from managed agricultural soils, Atmos. Environ., 44, 2107–2115, doi:10.1016/j.atmosenv.2010.02.044, 2010.
Crouse, D. L., Peters, P. A., van Donkelaar, A., Goldberg, M. S., Villeneuve, P. J., Brion, O., Khan, S., Atari, D. O., Jerrett, M., Pope, C. A., Brauer, M., Brook, J. R., Martin, R. V., Stieb, D., and Burnett, R. T.: Risk of Non accidental and Cardiovascu-lar Mortality in Relation to Long-term Exposure to Low Con-centrations of Fine Particulate Matter: A Canadian National-Level Cohort Study, Environ. Health Perspect., 120, 708–714, doi:10.1289/ehp.1104049, 2012.
Dockery, D. W., Pope, C. A., Xu, X. P., Spengler, J. D., Ware, J. H., Fay, M. E., Ferris, B. G., and Speizer, F. E.: An association between air-pollution and mortality in 6 United-States cities, N. Engl. J. Med., 329, 1753–1759, 1993.
Ellis, R. A., Murphy, J. G., Markovic, M. Z., VandenBoer, T. C., Makar, P. A., Brook, J., and Mihele, C.: The influence of gas-particle partitioning and surface-atmosphere exchange on am-monia during BAQS-Met, Atmos. Chem. Phys., 11, 133–145, doi:10.5194/acp-11-133-2011, 2011.
Erisman, J. W., Sutton, M. A., Galloway, J., Klimont, Z., and Wini-water, W.: How a century of ammonia synthesis changed the world, Nature Geosci., 1, 636–639, doi:10.1038/ngeo325, 2008. Fairlie, T. D., Jacob, D. J., Dibb, J. E., Alexander, B., Avery, M. A., van Donkelaar, A., and Zhang, L.: Impact of mineral dust on nitrate, sulfate, and ozone in transpacific Asian pollution plumes, Atmos. Chem. Phys., 10, 3999–4012, doi:10.5194/acp-10-3999-2010, 2010.
Fisher, J. A., Jacob, D. J., Wang, Q., Bahreini, R., Carouge, C. C., Cubison, M. J., Dibb, J. E., Diehl, T., Jimenez, J. L., Leibensperger, E. M., Meinders, M. B. J., Pye, H. O. T., Quinn, P. K., Sharma, S., van Donkelaar, A., and Yantosca, R. M.: Sources, distribution, and acidity of sulfate-ammonium aerosol in the Arc-tic in winter-spring, Atmos. Environ., 45, 7301–7318, 2011. Fountoukis, C., and Nenes, A.: ISORROPIA II: a
computa-tionally efficient thermodynamic equilibrium model for K+ -Ca2+-Mg2+-NH+4-Na+-SO2−4 -NO−3-Cl−-H2O aerosols,
At-mos. Chem. Phys., 7, 4639–4659, doi:10.5194/acp-7-4639-2007, 2007.
Fry, J. L., Kiendler-Scharr, A., Rollins, A. W., Wooldridge, P. J., Brown, S. S., Fuchs, H., Dube, W. P., Mensah, A., dal Maso, M., Tillmann, R., Dorn, H.-P., Brauers, T., and Cohen, R. C.: Organic nitrate and secondary organic aerosol yield from NO3
oxidation of beta-pinene evaluated using a gas-phase kinet-ics/aerosol partitioning model, Atmos. Chem. Phys., 9, 1431– 1449, doi:10.5194/acp-9-1431-2009, 2009.