HAL Id: hal-00298989
https://hal.archives-ouvertes.fr/hal-00298989
Submitted on 1 Jan 2002
HAL is a multi-disciplinary open access
archive for the deposit and dissemination of
sci-entific research documents, whether they are
pub-lished or not. The documents may come from
teaching and research institutions in France or
abroad, or from public or private research centers.
L’archive ouverte pluridisciplinaire HAL, est
destinée au dépôt et à la diffusion de documents
scientifiques de niveau recherche, publiés ou non,
émanant des établissements d’enseignement et de
recherche français ou étrangers, des laboratoires
publics ou privés.
The EU CADZIE database for extreme and deflected
snow avalanches
U. Domaas, C. B. Harbitz, H. Bakkehøi
To cite this version:
U. Domaas, C. B. Harbitz, H. Bakkehøi. The EU CADZIE database for extreme and deflected snow
avalanches. Natural Hazards and Earth System Science, Copernicus Publications on behalf of the
European Geosciences Union, 2002, 2 (3/4), pp.227-238. �hal-00298989�
Natural Hazards and Earth System Sciences (2002) 2: 227–238 c
European Geosciences Union 2002
Natural Hazards
and Earth
System Sciences
The EU CADZIE database for extreme and deflected snow
avalanches
U. Domaas1, C. B. Harbitz1, and H. Bakkehøi1
1Norwegian Geotechnical Institute, P.O. Box 3930, Ullev˚al stadion, N-0806 Oslo, Norway
Received: 20 September 2001 – Revised: 19 December 2001 – Accepted: 16 January 2002
Abstract. The EU programme CADZIE (Catastrophic
Avalanches: Defence Structures and Zoning in Europe), was established after the catastrophic 1999 avalanche winter in
Europe. The overall objective of the programme is
im-proved snow avalanche risk management by: (1) imim-proved avalanche hazard zoning by computational models; and (2) improved understanding of the interaction between defence structures and avalanches.
One contribution to meet the objectives is a database of well-documented extreme or deflected avalanche events in the six countries of the partners of the programme. The database contains observational, topographical and meteoro-logical snow avalanche data with reliability, as well as refer-ences, copyrights, etc., all in a convenient framework based on common formats.
The structure, contents, and potential use of the database are described. Example calculations of extreme and deflected events made by the NGI user interface “SKRED”, for prac-tical use of avalanche computational models, present appli-cations of the database. Finally, further development of the database and of the computational models to meet the future needs in avalanche hazard zoning is proposed.
1 Introduction
Increased human activity and expensive infrastructure in mountain regions, combined with a possible increase in avalanche activity and a reduced social acceptance of risk, have caused a growing demand for improved mitigative measures. This was clearly illustrated by the catastrophic avalanche accidents in Austria, Switzerland and France in January and February 1999.
Active avalanche control (controlled artificial release by explosives, etc.) is often hardly feasible in build-up areas. Hence, passive avalanche control, such as hazard zoning and defence structures, should be considered. Efficient zoning Correspondence to: U. Domaas ([email protected])
and dam design critically depend on knowledge of extreme avalanche events. Information on extreme events in terms of release conditions, and the extension and effect of possible defence structures, constitutes a sound means for the desired improvement of these issues. Experience from one event or region can most often be applied in aerial planning and dam design in other areas with little or no historical information.
Obviously, extreme events are rare. Likewise, very few naturally deflected avalanches have been studied in detail. Only a few deflecting and catching dams are built in each country that faces avalanche problems and even fewer dams have been struck by avalanches. Hence, experience on ex-treme and deflected avalanches is still scarce in each coun-try. To obtain as much understanding of the phenomenon as possible, the requested information should, therefore, not be restricted to a few accidental events in central Europe in 1999. To gather “enough” information, a joint effort between professional avalanche institutions, as well as open and easy exchange of information is essential.
The EU CADZIE programme for joint European effort on improved hazard zoning and defence measures is described in Sect. 2. One important deliverable to this programme is the EU CADZIE database on extreme and deflected snow avalanches presented in Sect. 3. Finally, in Sect. 4, a few cal-culational examples by simple models for practical use illus-trate some potential applications and how increased insight can be gained from the database.
2 The EU programme CADZIE 2000–2003
The EU programme CADZIE (Catastrophic Avalanches: Defence Structures and Zoning in Europe) was estab-lished after the 1999 catastrophic avalanche winter in
Eu-rope. The project is funded by the fifth European
Re-search Framework Programme and conducted by Cema-gref ETNA, Grenoble, France, and comprises altogether ten avalanche research institutions from six European
coun-228 U. Domaas et al.: The EU CADZIE database tries. Additional information is found on the internet address:
http://cadzie.grenoble.cemagref.fr.
The overall objective of the programme is improved snow avalanche risk management by improved avalanche hazard zoning and improved understanding of the interaction be-tween defence structures and avalanches. Both aspects re-quire improved understanding of avalanche release condi-tions and dynamics, which among other enhanced factors, will help to deduce the criteria for extreme events and the physical laws governing momentum and energy dissipation during avalanche/defence structure interaction. This, in turn, constitutes the basis for a new generation of numerical mod-els.
The project is split into five work packages on: (1)
zoning (hazard, probability, risk, model calibration); (2) avalanche/defence structure interaction of powder snow avalanches; (3) avalanche/defence structure interaction and deflection of dense snow avalanches; (4) field data and database; and finally, (5) transfer to end-users (standardised zoning tools, courses, and handbooks for engineers, consul-tants and planners). This paper can be considered a contribu-tion to the last two work packages.
The EU CADZIE programme is a continuation of
the EU SAME (avalanche mapping, model
valida-tion and warning systems) programme 1995–1998,
funded by the fourth European Research Framework Programme and also conducted by Cemagref ETNA. Additional information is found on the internet address: http://same.grenoble.cemagref.fr/private/cdrom/home.htm, where access can also be gained to the deliverables (also available on the CD-ROM “EUR 19069 – Avalanche mapping model validation and warning systems”). In sum-mation, the deliverables of SAME are reports on existing maps and databases, computational models, test sites, and detection systems, as well as a common user interface for model integration, a model comparison that identified cur-rent status and research needs, and finally, a draft proposal for joint European full-scale avalanche experiments. The latter discusses in detail modellers’ needs for experimental and observational data and how to obtain them.
3 The EU CADZIE database
3.1 Objectives
A database on extreme and deflected snow avalanches with data carefully selected to cover the needs of avalanche prac-titioners, researchers and modellers can be used to:
– bring about and ease exchange of empirical knowledge; – increase the understanding of meteorological factors
that originate release of extreme events;
– increase the understanding of the dynamics of extreme and deflected avalanches, and thereby help to deduce the physical laws governing momentum and energy dis-sipation during avalanche/defence structure interaction;
– improve procedures and tools for avalanche hazard zon-ing and design of defence structures by:
– further use, interpretation and development of sta-tistical models;
– verification, validation, and further development of numerical models for simulation of avalanche mo-tion and avalanche/defence structure interacmo-tion; – physically define the range of model parameter values
that allow the models to properly back-calculate certain events;
– identify the uncertainty of the computational models; – increase the understanding of scaling effects (where the
database contains data on events of various scales).
3.2 Limitations on use
The limitations are mainly related to the topographical data, normally provided by the map authorities in each country. Most of the digital maps and terrain models are provided only for research work performed by the CADZIE partners, and in some cases, only for work within the project period. In addi-tion, the owner (given in the database) should be contacted in each case. To ensure that these orders are kept, the database is presently password restricted. Hopefully an agreement can be reached between the project partners and the map own-ers such that the database can be more open, and also that it can be used, maintained and enlarged after the project is concluded.
3.3 Structure and formats
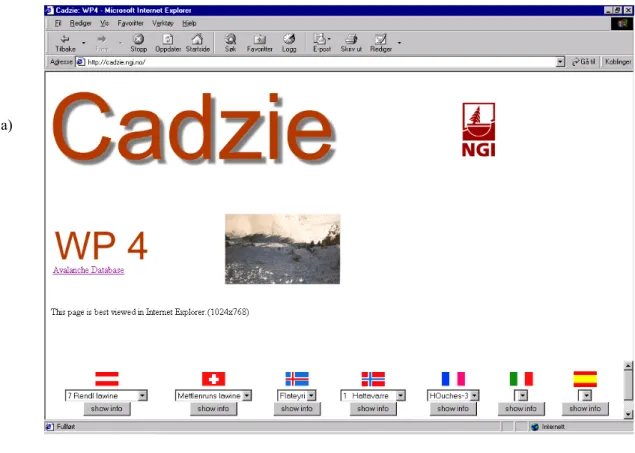
To ensure easy access, the EU CADZIE database is acti-vated from the internet front-page http://cadzie.ngi.no (pass-word restricted), Fig. 1a. To simplify the matter, the front-page presents a list of the included avalanche events in each participating country and a link to the avalanche database
overview, Fig. 1b. To ensure readability, the latter is
presently made in standard MS Excel format. Later on it will be converted to a MS Access file to enable inquiries and extraction.
For each avalanche event on the front-page there is a sub-page with links to pictures and data files of appropriate com-mon formats containing the information listed below, Fig. 2a. The files are given names according to a certain standard, and the formats have been selected based on a questionnaire dis-tributed to all partners.
Special attention has been paid to formats used for dig-ital maps and terrain. The Geographical Information Sys-tem (GIS) tools used by the participants are ArcView/Info, GeoMedia, and Auto-Cad Map. Also used are the numeri-cal tools Grass and Surfer for construction and presentation of digital terrain. All five “terrain tools” apply different in-put/output formats. Finally, the EU CADZIE database con-tains digital vectorised maps for ArcView/Info (.e00 or .shp
U. Domaas et al.: The EU CADZIE database
Figure 1
229a)
b)
230 U. Domaas et al.: The EU CADZIE database Figure 2 Extension of the 1968 Riise event North 500 m a) c) b)
Fig. 2. Example of avalanche event sub-page list (a) with links to pictures (b), maps with observed avalanche extension (c), and other relevant
information. The selected example is for the 1968 Riise avalanche event. The contour line interval is 20 m above 600 m a.s.l. and 5 m below 600 m a.s.l.
format), and digital terrain as rectangular grids in ASCII for-mat, also structured for ArcView/Info. Complementary files to present the extension of the release area and the observed avalanche are also included. A surfer has proved to be conve-nient for production of rectangular grids and vectorised maps from raw terrain data. The Surfer grid files (.grd ) can easily be restructured (mirrored) to ArcView/Info.
3.4 Contents
The goal during the period of CADZIE is to have all rele-vant information on at least five extreme and five deflected avalanche events in each of the participating countries, i.e. altogether data on sixty events collected in the database.
Each avalanche is identified by a specific name and its location (country, region and nearest village), as well as time of occurrence. Map name, general map information, and UTM coordinates follow. The database separates ex-treme avalanches from deflected avalanches. For deflected
avalanches, it is further indicated whether the deflection is caused by a natural or a manmade deflecting dam.
The events are classified as powder snow avalanches, dry dense snow avalanches, and wet dense snow avalanches. Rel-evant information on release area and aspect, avalanche vol-ume, runout (vertical height and horizontal length, runout angle), and entrainment are presented, followed by a brief description of the termination in the valley and the resulting damages. Separate files with digital maps and terrain, also showing the extension of the release area and the observed avalanche, are included as described above. Also, the lon-gitudinal terrain profile is included for computational use, to enable a quick impression of the characteristics of the path.
Additional information, such as photos, historical descrip-tions and reports, are included as separate files, Figs. 2a and b. Special focus is given to detailed photos that show, for example, traces on trees and houses from which the height of the avalanche cloud can be deduced, or thickness of snow from the cloud on house walls, etc. Standard meteorologi-cal data are included to study the release conditions
(direc-U. Domaas et al.: The EU CADZIE database 231
Figure 3
0 200 400 600 800 1000 1200 1400 1600 1800 2000 2200 2400 2600 2800 3000
Horizontal distance [m] (scale 1:15000)
0 200 400 600 800 1000 1200 m a.s.l 0 10 20 30 40 50 60 velocity [m/s] Legend Terrain Beta Alfa-0 Alfa-1 PCM (my 0.13,M/D 1000, Runout 2701.90)
NIS (M= 0.00080,my= 0.28000, Runout 2713.39, Initial flow height=2.0m)
0 0.5 1 1.5 2 2.5
Dimensionless horizontal distance
0 0.2 0.4 0.6 0.8 1 D imens ionl es s hei gh t Legend Length_profile_riise_01 Length_profile_riise_01-Alfa NAKKEF NAKKEF-Alfa PO 97 PO 97-Alfa PO 109 PO 109-Alfa PO 172 PO 172-Alfa SVOROY SVOROY-Alfa a) b) α β α-1
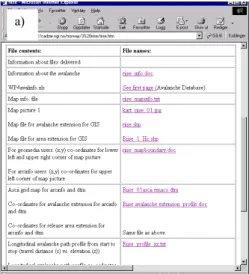
Fig. 3. Computational results for the 1968 Riise avalanche with statistical/topographical and dynamical models (a), and comparative model (b).
tion, speed and duration of wind; precipitation over the last 1, 3 and 5 days; temperature, air humidity, and clouds prior to release). Possible snow profiles (snow height, stratifica-tion, grain type and size, temperature, density, hardness, wa-ter content, etc.) are attached in separate files. Finally, fu-ture analyses, example calculations and simulations related to events in the database will be attached in separate files.
The reliability or uncertainty is quantified for all the rele-vant parameters in the database. Moreover, for each event the providers of maps, (to be contacted for further use) is given, together with correct citation and a contact person for all the data.
4 Applications of the database
4.1 Intention and information on the applied database
events
Most of the possible applications of the database listed in the previous section are meant for later and more thorough anal-yses that can be performed when the EU CADZIE database is more complete. Hence, this section is limited to providing an idea of how the database can be applied to gain empirical knowledge on the dynamics of extreme avalanche runout and deflection.
232 U. Domaas et al.: The EU CADZIE database
Figure 4
0 500 1000 1500 2000 2500 3000 3500 4000
Horizontal distance [m] (scale 1:25000)
0 200 400 600 800 1000 1200 1400 m a.s.l 0 10 20 30 40 50 60 velocity [m/s] Legend Terrain Beta Alfa-0 Alfa-1 PCM (my 0.15,M/D 500, Runout 3759.30) NIS (M= 0.00080,my= 0.28000, Runout 2990.36)
NIS (M= 0.00110,my= 0.26000, Runout 3644.26,Initial Flow height = 3.0 m) The Bleie 1994 Avalanche
Lenght Profile m 100200300400500 Fjord a) b) c) α α-1 β
Fig. 4. Topographic map for the 1994 Bleie avalanche with contour line interval 20 m (a), computational results with statistical/topographical
and dynamical models (b), and picture of damages (c).
All the events discussed below are included in the EU
CADZIE database. However, for statistical/topographical
and comparative models a more comprehensive database on extreme events is needed. Hence, the Norwegian database with path profiles and runout distances for more than 200 events is applied in addition to the EU CADZIE database.
This illustrates the need to include links to other existing databases in the EU CADZIE database.
Statistical/topographical models assume that there are small variations in the physical snow parameters giving the longest runout distance. This assumption is valid only within one climatic region (McClung et al., 1989). Hence, such
U. Domaas et al.: The EU CADZIE database 233 links and/or a more comprehensive EU CADZIE database
would also help to develop statistical/topographical and com-parative models for other regions. Statistical/topographical models have previously been applied also in Austria (Lied et al., 1995), Iceland (J´ohannesson, 1998) and in the Spanish Pyrenees (Furdada and Vilaplana, 1998). The significance of historical records for hazard zoning in terms of conditions influencing the avalanche occurrences is discussed by Kris-tensen et al. (in press), while probability analysis and uncer-tainty in hazard zoning are discussed by Barbolini and Savi (2001) and Harbitz et al. (2001).
As examples of extreme avalanches, the following Norwe-gian events are selected:
– The 1968 Riise avalanche, Ørsta, western Norway,
started at 1250 m a.s.l. and finally travelled 470 m
across the horizontal valley bottom at 15 m a.s.l., Fig. 2c. The travel distance was 3000 m (horizontal projection 2710 m). The inclination of the release area
was 45◦. The avalanche destroyed the forest in the path
down the mountainside and 17 houses around the farm at Riise, Fig. 2b. Three people died and eight survived in the houses. It was snowing the whole week before the accident, causing great avalanche danger in the whole area. Snow observations in the valley indicated a snow depth of approximately 2 m, with a lot of loose snow in the upper parts of the snow cover.
– The 1994 Bleie avalanche, western Norway, has an es-timated return period of 1000 years, based on weather statistics and confirmed by the records of the harvest of the farms (Lied et al., 1998). The horizontal runout distance was about 3600 m, corresponding to a runout
angle of 20◦, Fig. 4a. The avalanche crossed a
gen-tle field of about 800 m before it passed a “shoulder” along the path profile at 300 m a.s.l. and continued to the fjord. Three farms were partly destroyed, Fig. 4c. The measured precipitation during the week prior to the avalanche indicates a snow height in the release area of 3 m. In 1721, an avalanche stopped at Reiseter, located at the “shoulder”.
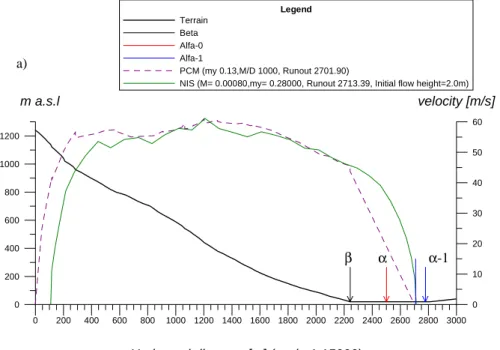
– The 1995 Drevja avalanche, northern Norway, started 600 m a.s.l. and passed a 15–20 m high natural catching dam at 300 m a.s.l., Fig. 5a. The width of the avalanche in the track was about 200–400 m. Between 150 m a.sl. and the valley bottom at 20 m a.sl., the avalanche de-stroyed a dense mixed forest (spruce, pine, and birch). The avalanche crossed the road, and stopped at the other side of the river. The 1995 event was released after heavy snowfall the week before. A similar avalanche occurred in 1921. The story relates further that the local people gathered to collect the broken trees for firewood. As an example of a deflected avalanche, the following is used:
– The 2001 Dryadbreen avalanche, 10 km SW of Spits-bergen, Svalbard. The release area under the moun-tain H˚abergnuten, south of the glacier Dryadbreen in
Fardalen, was about 300 m long with an inclination of
35◦–45◦, Fig. 6a. Beneath the release area there is first
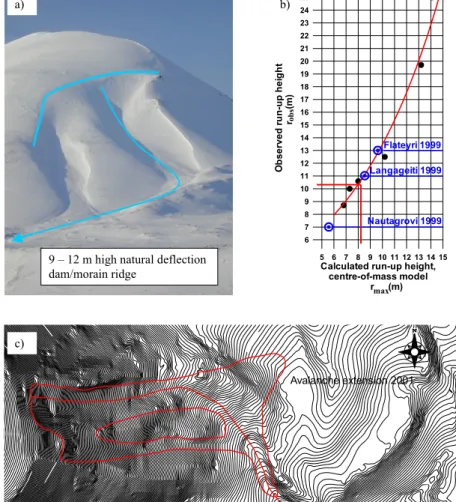
a ridge splitting the avalanche, before the main part of the avalanche is deflected on a secondary moraine ridge with a vertical height of 9–12 m measured in a vertical plane perpendicular to the centre-line of the ridge. Two persons on snow-scooters were killed in the avalanche. However, other avalanches in the same area indicate a natural release after strong winds (wind gusts of 30 m/s). The snow profile shows a layer of coarse depth hoar close to the ground, covered by wind trans-ported snow. Measurements, however uncertain due to wind exposure, revealed 5 mm of precipitation the last two days before the avalanche.
4.2 Computational methods
The computations are made by use of the graphical user inter-face “SKRED”. This interinter-face has been recently developed at the Norwegian Geotechnical Institute (NGI). Basically, the interface is an assembly of avalanche computational models for practical use based on more than twenty years of research. The interface is programmed in Visual Basic and covers:
1. Statistical models: topographical α/β-model and com-parative model;
2. ACCESS database on Norwegian extreme avalanches; 3. Dynamical models: PCM-, PLK-, NIS1- and
NIS2-models;
4. Dynamical/empirical deflecting dam model; 5. Use of terrain profiles from digital maps (GIS); 6. Model descriptions for report appendices, etc.;
7. Link to the Norwegian Building Act Legislation Inter-net pages.
The models embraced in “SKRED” and applied in this study are briefly described in Appendix A. Harbitz (1998) presents a more extended description of the various models.
4.3 Use of databases to study extreme avalanche runout
The 1968 Riise avalanche was considered an “extreme event”. However, the first experience to be gained from the databases is that the observed horizontal travel distance of
2710 m (corresponding to a runout angle αmeasured= 24.6◦),
is less than one standard deviation beyond the mean runout angle calculated by the α/β-model, Fig. 3a. Likewise, re-sults from the dynamical PCM block model are in good agreement with the observations for normal input values
µ = 0.13 and M/D = 1000 m. For the dynamical NIS1
deformable body model, good agreement with the runout dis-tance is achieved with normal shear viscosity and friction
234 U. Domaas et al.: The EU CADZIE database
a)
b)
0 200 400 600 800 1000 1200 1400 1600 1800 2000 2200
Horizontal distance [m] (scale 1:10000)
0 50 100 150 200 250 300 350 400 450 500 550 600 650 700 750 800 m a.s.l 0 5 10 15 20 25 30 35 40 45 50 velocity [m/s] Legend Terrain Beta Alfa-0 Alfa-1 PCM (my 0.15,M/D 500, Runout 1614.90) PCM (my 0.20,M/D 700, Runout 1594.50) NIS (M= 0.00080,my= 0.28000, Runout 1627.84)
Drevja_length_profile 15 m catching dam m 100 200 300 400 500 20 m 15 m c) d) 0 200 400 600 800 1000 1200 1400 1600 1800 2000 2200
Horizontal distance [m] (scale 1:10000)
0 50 100 150 200 250 300 350 400 450 500 550 600 650 700 750 800 m a.s.l 0 5 10 15 20 25 30 35 40 45 50 velocity [m/s] Legend Terrain Beta Alfa-0 Alfa-1 PCM (my 0.15,M/D 500, Runout 1615.80) PCM (my 0.20,M/D 700, Runout 1597.10) Drevja_length_profile dam removed 0 200 400 600 800 1000 1200 1400 1600
Horizontal distance [m] (scale 1:5000)
0 100 200 300 400 500 600 700 m a.s.l 0 10 20 30 40 50 velocity [m/s] Legend Terrain Beta Alfa-0 Alfa-1 PCM (my 0.15,M/D 500, Runout 560.50) PCM (my 0.20,M/D 700, Runout 558.50) NIS (M= 0.00080,my= 0.28000, Runout 846.15)
Drevja_20m_dam
Fig. 5. Topographic map for the 1995
Drevja avalanche with contour line in-terval 20 m above 600 m a.s.l. and 5 m below 600 m a.s.l (a), computational re-sults with statistical/topographical and dynamical models along NE part of track (b), along SW part of track (c) and along NE part of track with natural catching dam artificially removed (d).
U. Domaas et al.: The EU CADZIE database 235 2.0 m. Both the dynamical models give maximum frontal
ve-locity of more than 60 m/s, in agreement with velocities mea-sured for other large avalanches (e.g. Aulta in Switzerland and Ryggfonn in Norway). Hence, the considerable runout distance in flat terrain is easily obtained with normal param-eter values, indicating that such an event is highly relevant for hazard zoning.
For the 1968 Riise avalanche, which had a relatively parabolic path profile, the comparative model has also been used, Fig. 3b. This model calculates an actual runout angle
of 25◦based on observed runout angles in the most similar
paths in the Norwegian database. This is only 50 m shorter than the observed distance, or less than 2% of the horizon-tal runout distance. The Riise path has a vertical height of 1235 m, while the five most similar avalanche paths have a vertical path height of 950–1150 m, and a runout angle
αmeasuredof 25.0–26.0◦. This illustrates the value of the com-parative model and confirms the relevance of such an event for hazard zoning based on “extreme” avalanches.
For the 1994 Bleie avalanche, the observations correspond to one standard deviation beyond the mean runout angle cal-culated by the α/β-model, Fig. 4b. In other words, the sta-tistical/topographical model again indicates that such an “ex-treme” runout distance should be considered for hazard zon-ing, even though the “path shoulder” is located 400 m beyond the mean runout angle α. The dynamical NIS1 model is sen-sitive to the input parameter values and can easily be tuned to agree with the observations. However, reducing the dry friction slightly from µ = 0.28 to µ = 0.26 is enough to re-produce the observations. Again, the statistics based on the databases combined with the simulations reveal that such a runout distance should clearly be considered for hazard zon-ing. This is confirmed by the fact that another avalanche in 1750 continued all the way to the farm, Reiseter, located at the “path shoulder”. This runout distance is reproduced with the normal default values for the NIS1 model, Fig. 4b. Another experience to be gained by back-calculations of the Bleie event is that the PCM block model most probably ac-celerates too quickly over the shoulder, producing an unreal-istic velocity profile in such terrain.
For the 1995 Drevja avalanche, the observations corre-spond to the mean runout angle calculated by the α/β-model, Fig. 5b. In the SW part of the track, where the natural dam is 20 m high, the avalanche is clearly affected, Figs. 5a and c, as opposed to the NE part, where the dam is only 15 m high, Figs. 5a and b. The PCM and NIS1 dynamical models show that the avalanche first reaches a maximum velocity of about 45 m/s above the natural catching dam, at which the velocity is reduced to about 20 m/s, Fig. 5b. Note that the avalanche again reaches a velocity of about 30 m/s further down, be-fore it comes to stop across the river, in agreement with the observations. Recalculations by the PCM model, with the dam artificially removed, reveal the same stopping position, Fig. 5d. The important experience to be gained is that if a dam in the upper track is too low to stop the avalanche, the dam does not affect the runout distance. The avalanche seems to obtain the same maximum velocity below the dam
with or without the catching dam. Another observation is that in the SW part, where the catching dam is 20 m high, the PCM model stops the avalanche at the dam, while the NIS1 model seems to handle the passing of the dam fairly well and returns a stopping position 250 m further down the slope (50 m too short compared to the observations), Fig. 5c. The back-calculations also demonstrate the importance of using several dynamic models in hazard zoning.
4.4 Use of databases to study avalanche deflection
For the 2001 Dryadbreen avalanche, Figs. 6a and c, back-calculations are made by the deflection dam model. The cal-culated centre-of-mass run-up height is 8.0 m, Fig. 6d. To compensate for the limitations of a centre-of-mass considera-tion, the run-up height is subsequently calibrated utilising ob-servations of nine full-scale avalanches influenced by natural or manmade deflecting dams. The calibrated run-up height is about 10.5 m, Fig. 6b, in close agreement with the field obser-vations described above. In spite of the subjective evaluation needed for the energy dissipation at impact, the centre-of-mass model in combination with the calibration procedure seems to reduce the uncertainties in the calculations of run-up heights on deflecting dams. The calibration procedure is a typical example of the benefit of such a database. Impact, en-ergy dissipation and shocks are discussed further by Harbitz et al. (2000), J´ohannesson (2001), and Tai et al. (2001).
5 Concluding remarks
The EU CADZIE database is a contribution to meet the needs for improved avalanche hazard zoning by computa-tional models and improved understanding of the interaction between defence structures and avalanches. The database contains information on well-documented, extreme or de-flected avalanche events in the six countries of the partners of the EU programme CADZIE.
Example calculations of extreme and deflected events made by the NGI user interface “SKRED”, for practical use of avalanche computational models, present applications of the database. The results reveal that dramatic events in large avalanche tracks are not so extreme when analysed by statistical/topographical or dynamical models. All runout lengths are within one standard deviation beyond the mean runout angle of the statistical/topographical model or eas-ily obtained with normal parameter values for the dynamical models. Hence, all these dramatic events are highly relevant for hazard zoning.
The examples also demonstrate the need for more well-documented events to be included in the database for im-proved statistical analyses, as well as validation and calibra-tion of the dynamical models. It is hoped that the database can be open to the public, at least for research use, with links to the other databases in each country. This may be achieved by governmental funding of database development and main-tenance.
236 U. Domaas et al.: The EU CADZIE database
Figure 6
b)
9 – 12 m high natural deflection dam/morain ridge
α
α−1
Avalanche length profile Avalanche extension 2001
Release area
m 100 200 300 400 500
5 6 7 8 9 10 11 12 13 14 15
Calculated run-up height, centre-of-mass model r (m) 6 7 8 9 10 11 12 13 14 15 16 17 18 19 20 21 22 23 24 25 Ob s e rved run-u p he ight r ( m ) Flateyri 1999 Langageiti 1999 Nautagrovi 1999 max ob s a) c) 0 10 20 30 40 50 60 70 80 90 100 110 120 130 horizontal distance along wall
0 2 4 6 8 10 12 14 16 18 20 22 24 height 19 19.5 20 20.5 21 21.5 22 22.5 23 23.5 24 24.5 25 25.5 26 26.5 27 velocity [m/s] Legend r- id1 y- id1 v- id1 d)
Fig. 6. Picture of the 2001 Dryadbreen
avalanche track (a), best-fit line for ob-served vs. calculated run-up heights (b), topographic map with contour line in-terval 2 m (c), and computational results with deflection dam model (d).
U. Domaas et al.: The EU CADZIE database 237 The examples further reveal the importance of focusing on
the probability and uncertainty in hazard zoning, as well as improved models for design and location of deflection dams. In general, the shortcomings of today’s dynamical models are the limited insight into initial conditions and rheological laws, as well as the neglect of snow entrainment and flow regime transitions, including the formation of a suspension layer (“snow cloud”).
The ongoing work on avalanche deflection has shown that energy dissipation during avalanche/dam interaction is not well understood. Important factors determining the deflec-tion rate are snow properties and avalanche speed that in-fluences compression and energy dissipation at impact, as well as the dam geometry. The deflected avalanches in the database will hopefully contribute to an increased under-standing of these processes.
Appendix A Brief description of the models embraced
in “SKRED” and applied in this study
The statistical/topographical α/β-model (e.g. Bakkehøi
et al., 1983) governs maximum runout distance solely as a function of topography. The runout distance equations are found by regression analysis, correlating the longest registered runout distance from more than 200 Norwegian avalanche paths to a selection of topographic parameters. The most usual form of the α/β-model based on the Nor-wegian database is that of a simple linear regression relation:
α =0.96β − 1.4◦, where the runout angle α is the average
gradient of the avalanche path, and β is the average inclina-tion of the avalanche path between the starting point and the
point of 10◦inclination along the path profile. The standard
deviation is 2.3◦and the correlation coefficient is 0.92.
The comparative model (Bakkehøi and Norem, 1993; 1994) computes the runout angle by comparing the actual path profile with more than 200 Norwegian paths with reg-istered avalanche runout. Each avalanche path is described by n characteristic parameters weighted by suitable coeffi-cients. An n-dimensional weighted distance expresses the similarity between the two paths. A small weighted distance indicates a high degree of similarity. The actual runout an-gle is finally calculated as the average of the runout anan-gles of a specified number of the most similar registered avalanche path profiles. The standard deviation of the calculated runout angle from the observed runout angle for all the registered
avalanches is 1.86◦, which is better than the standard
devi-ation of the statistical/topographical α/β-model and the dy-namical NIS1 model. The comparative model also affords the opportunity to study the background material of the most similar registered avalanche events with regard to topograph-ical conditions, region, climate, return period, etc. Hence, it is possible to attach greater importance to selected registered events.
The PCM model (Perla et al., 1980) describes the avalanche as a block moving on a path of varying inclination. The reference point is the initial rest position of the block’s
centre-of-mass. The equation of momentum includes gravity, velocity-independent dry (Coulomb) friction µ, as well as the centrifugal force due to curvature of the path, dynamic drag and inertia-resistive ploughing of snow masses in the front. The three latter contributions are implemented together as the velocity squared, divided by the M/D “mass-to-drag” ratio. The momentum equation is solved by an iterative solution procedure, dividing the slope into small linear segments of different inclination. The usefulness of the model depends on knowledge of the two adjustable parameters (dry friction co-efficient and mass-to-drag ratio) that can vary considerably. These values have been limited to some extent by testing the model statistically.
The NIS1 model (Irgens, in review) describes the avalanche as a deformable body model of which velocity and flow height are a function of both space and time. The snow is described as a visco-plastic material with dispersive pres-sure, (i.e. the normal stresses depend on the shear rate), form-ing a shear flow with or without a basal slip velocity. Varyform-ing inclination produces centrifugal forces. The model is one-dimensional, as the equations are depth-averaged for a veloc-ity profile assumed to be identical in form to the steady shear flow profile. The resulting equations for balance of mass and linear momentum are solved by a Eulerian finite difference mid-point scheme in space and a fourth-order Runge-Kutta procedure in time.
The deflecting dam model (Harbitz et al., 2000) describes the motion of the avalanche centre-of-mass along the side of a retaining dam. Strictly speaking, the centre-of-mass is that of a representative frontal part of the slide projected onto the terrain (the total avalanche centre-of-mass may not even reach the dam). The equations are derived from classi-cal mechanics, including a resistance force represented by a dynamic drag and a dry (Coulomb) friction, and are solved numerically by a fourth order Runge-Kutta procedure. How-ever, a lumped mass consideration does not include any ef-fects of the avalanche extension on the dynamics. Hence, the model results will in any case be encumbered with obvious restrictions. Instead of a sophisticated digital terrain model, the model, therefore, applies a simplified geometry to study the influence of avalanche impact velocity, terrain inclina-tion, dam configurainclina-tion, and dam orientation on avalanche course deflection and run-up height along a deflection dam. An additional advantage of a simplified geometry study is that the deflecting dam does not have to be superimposed on a complex digital terrain. The avalanche impact velocity on the dam is normally found by running the PCM model. The ef-fects of energy loss due to impact may also be investigated by the deflecting dam model. To overcome the model deficien-cies introduced by a lumped mass consideration, a best-fit line between the observed and the calculated run-up heights is applied in practical dam design. At present, the calibrated model is based on nine deflected dense snow avalanches and three powder avalanches.
Acknowledgements. This paper is a contribution to the NGI Strate-gic Institute Programme “200011001–SIP6 snow avalanches”,
238 U. Domaas et al.: The EU CADZIE database
funded by the Research Council of Norway, and the EU programme “Catastrophic Avalanches: Defence Structures and Zoning in Eu-rope”, partly funded by the European Union under the contract no. EVG1-CT-1999-0009. The authors are indebted to Steinar Bakkehøi (NGI) for GIS and WEB design, to R. Opsahl (Telesafe Consulting AS, previously NGI) for his programming of the graph-ical user interface “SKRED”, to T. Gregory (NGI) for revising the manuscript, and to T. J´ohannesson and K. M. H´akonard´ottir (Ice-landic Meteorological Office), M. Maggioni, F. Tiefenbacher and U. Gruber (Swiss Federal Institute for Snow and Avalanche Re-search), T. Tartarotti, K. Kleemayr and S. Wieshofer (IWL-BOKU), N. Mohamed (CEMAGREF), P. Sampl (AVL GmbH), and R. Sailer (Austrian Institute for Torrent and Avalanche Research) for their contributions to the EU CADZIE database.
References
Bakkehøi, S., Domaas, U., and Lied, K.: Calculation of Snow Avalanche Run-out Distance, Annals of Glaciology, 4, 24–29, 1983.
Bakkehøi, S. and Norem, H.: Comparing topographical and dynam-ical run-out models by ideas of “Nearest Neighbour Method”, 2nd Avalanche-Dynamics-Workshop in Innsbruck, Preliminary, 1993.
Bakkehøi, S. and Norem, H.: Sammenlikning av metoder for beregning av maksimal utlpsdistanse for snskred (Comparison of methods for calculation of maximum avalanche runout dis-tance), Norwegian Geotechnical Institute, report 581200-30 (in Norwegian), 1994.
Barbolini, M. and Savi, F.: Estimate of uncertainties in avalanche hazard mapping, Annals of Glaciology, 32, 290–298, 2001. Furdada, G. and Vilaplana, J. M.: Statistical prediction of maximum
avalanche run-out distances from topographic data in the western Catalan Pyrenees, Annals of Glaciology, 26, 285–288, 1998. Harbitz, C. B. (Ed) A survey of computational models for snow
avalanche motion. Deliverable D4 of the EU project SAME, also in: Norwegian Geotechnical Institute, report no. 581220-1, http://same.grenoble.cemagref.fr/, 1998.
Harbitz, C. B., Domaas, U., and Engen, A.: Design of Snow Avalanche Deflecting Dams. Proceedings of the 9th
Inter-praevent 2000 Congress, 26–30 June 2000, Villach, Austria, 1, 383–396, also in: Norwegian Geotechnical Institute, report 589000-4, 2000.
Harbitz, C. B., Harbitz, A., and Nadim, F.: On Probability Anal-ysis in Snow Avalanche Hazard Zoning. Annals of Glaciology, 32, 290–298, also in: Norwegian Geotechnical Institute, report 20001018-1, 2001.
Irgens, F.: in review. Simplified simulation model of snow avalanches and landslides, submitted to Journal of Glaciology. J´ohannesson, T.: Icelandic avalanche runout models compared with
topographical models used in other countries. Proceedings of 25 Years of Snow Avalanche Research at NGI, Anniversary Confer-ence, Voss, Norway, 12–16 May, 1998, Norwegian Geotechnical Institute, publ. 203, 1998.
J´ohannesson, T.: Run-up of two avalanches on the deflecting dams at Flateyri, nortwestern Iceland, Annals of Glaciology, 32, 350– 354, 2001.
Lied, K., Instanes, B., Domaas, U., and Harbitz, C. B: Snow avalanche at Bleie, Ullensvang, January 1994, Proceedings of 25 Years of Snow Avalanche Research at NGI, Anniversary Confer-ence, Voss, Norway, 12–16 May, 1998, Norwegian Geotechnical Institute, publ. 203, 1998.
Lied, K., Weiler, C., Bakkehøi, S. and Hopf, J.: Calculation meth-ods for avalanche run-out distance for the Austrian Alps. Norwe-gian Geotechnical Institute, report 581240-1, 1995.
Kristensen, K., Harbitz, C. B., and Harbitz, A.: Significance of His-torical Records for Avalanche Hazard Zoning in Norway. Pro-ceedings of the International Snow Science Workshop 2000, 4– 8 October 2000, Big Sky, Montana, USA, also in: Norwegian Geotechnical Institute, report 20001018-5, in press, 2002. McClung, D. M., Mears, A. I., and Schaerer, P.: Extreme avalanche
run-out: Data from four mountain ranges, Annals of Glaciology, 13, 180–184, 1989.
Perla R. I., Cheng, T. T., and McClung D. M.: A Two-Parameter Model of Snow-Avalanche Motion, Journal of Glaciology, 26, 94, 197–207, 1980.
Tai, Y. C., Noelle, S., Gray, J. M. N. T., and Hutter, K.: An accurate shock-capturing finite-difference method to solve the Savage-Hutter equations in avalanche dynamics, Annals of Glaciology, 32, 350–354, 2001.