HAL Id: hal-00318006
https://hal.archives-ouvertes.fr/hal-00318006
Submitted on 22 Nov 2005
HAL is a multi-disciplinary open access
archive for the deposit and dissemination of
sci-entific research documents, whether they are
pub-lished or not. The documents may come from
teaching and research institutions in France or
abroad, or from public or private research centers.
L’archive ouverte pluridisciplinaire HAL, est
destinée au dépôt et à la diffusion de documents
scientifiques de niveau recherche, publiés ou non,
émanant des établissements d’enseignement et de
recherche français ou étrangers, des laboratoires
publics ou privés.
Solar activity: nowcasting and forecasting at the SIDC
D. Berghmans, R. A. M. van der Linden, P. Vanlommel, R. Warnant, A.
Zhukov, E. Robbrecht, F. Clette, O. Podladchikova, B. Nicula, Jean-François
Hochedez, et al.
To cite this version:
D. Berghmans, R. A. M. van der Linden, P. Vanlommel, R. Warnant, A. Zhukov, et al.. Solar activity:
nowcasting and forecasting at the SIDC. Annales Geophysicae, European Geosciences Union, 2005,
23 (9), pp.3115-3128. �hal-00318006�
SRef-ID: 1432-0576/ag/2005-23-3115 © European Geosciences Union 2005
Annales
Geophysicae
Solar activity: nowcasting and forecasting at the SIDC
D. Berghmans, R. A. M. Van der Linden, P. Vanlommel, R. Warnant, A. Zhukov, E. Robbrecht, F. Clette, O. Podladchikova, B. Nicula, J.-F. Hochedez, L. Wauters, and S. Willems
Royal Observatory of Belgium, Ringlaan -3- Avenue Circulaire, 1180 Brussels, Belgium
Received: 22 February 2005 – Revised: 14 June 2005 – Accepted: 12 May 2005 – Published: 22 November 2005 Part of Special Issue “1st European Space Weather Week (ESWW)”
Abstract. The Solar Influences Data analysis Center (SIDC)
is the World Data Center for the production and the distribu-tion of the Internadistribu-tional Sunspot Index, coordinating a net-work of about 80 stations worldwide. From this core activity, the SIDC has grown in recent years to a European center for nowcasting and forecasting of solar activity on all timescales. This paper reviews the services (data, forecasts, alerts, soft-ware) that the SIDC currently offers to the scientific com-munity. The SIDC operates instruments both on the ground and in space. The USET telescope in Brussels produces daily white light and Hα images. Several members of the SIDC are co-investigators of the EIT instrument onboard SOHO and are involved in the development of the next generation of Eu-rope’s solar weather monitoring capabilities. While the SIDC is staffed only during day-time (7 days/week), the monitor-ing service is a 24 h activity thanks to the implementation of autonomous software for data handling and analysis and the sending of automated alerts. We will give an overview of re-cently developed techniques for visualization and automated analysis of solar images and detection of events significant for space weather (e.g. CMEs or EIT waves). As part of the involvement of the SIDC in the ESA Pilot Project for Space Weather Applications we have developed services dedicated to the users of the Global Positioning System (GPS). As a Regional Warning Center (RWC) of the International Space Environment Service (ISES), the SIDC produces daily fore-casts of flaring probability, geomagnetic activity and 10.7 cm radio flux. The accuracy of these forecasts will be investi-gated through an in-depth quality analysis.
Keywords. Solar physics, astrophysics, and astronomy
(Flares and mass ejections; Photosphere and chromosphere) – Interplanetary physics (Interplanetary shocks)
Correspondence to: D. Berghmans
1 Introduction
The SIDC, hosted by the Solar Physics Department of the Royal Observatory of Belgium (ROB, Brussels), is best known as the World Data Center of the Sunspot index. It was founded to continue the work of the Z¨urich Observa-tory, when after more than a century (see e.g. Wolf, 1868) this institution decided not to continue the production of the sunspot number. The SIDC started to calculate the Inter-national Sunspot Number in January 1981. The continuity and coherence with the former index of Z¨urich was assured through the use of Locarno (one of the three main stations of the Z¨urich network) as reference station.
In subsequent years, the SIDC has expanded its activities and is developing fast into a major player in Europe’s oper-ational space weather monitoring and forecasting infrastruc-ture. During the annual assembly of International Space En-vironment Services (ISES, a permanent service of the FAGS) in May 2000 (Boulder, US) the SIDC was granted the sta-tus of RWC Brussels. In this function, the SIDC provides daily activity reports and forecasts (URSIGRAMs) of the sta-tus of the space environment. In 2003 the European Space Agency (ESA) launched the Space Weather Applications Pi-lot Project, which was meant to conglomerate space weather services in Europe in one network (SWENET). In this con-text, the SIDC developed services dedicated to the users of the Global Positioning System (GPS). This project results from collaboration between the Royal Observatory of Bel-gium and the Royal Meteorological Institute of BelBel-gium (in-cluding Dourbes Geophysical Center).
Several members of the SIDC are co-investigators of the EIT instrument onboard SOHO, which is one of our best data sources for monitoring flares, coronal holes and CME sig-natures (dimmings, EIT waves, prominence/filament erup-tions). The SIDC is also involved (as PI) in the development of the next generation of Europe’s solar weather monitor-ing capabilities: the EUV imager SWAP and the radiometer LYRA are expected to be launched onboard the ESA satel-lite PROBA2 early in 2007. Much of the older history of
3116 D. Berghmans et al.: Solar activity: nowcasting and forecasting at the SIDC
2 Instrumentation
Space weather forecasting is a new science application. To do it well, one needs to consider in detail many different aspects of solar activity and the various types of consequences of this activity. It is therefore important to take as much data as possible into account. In particular EIT & LASCO instruments onboard SOHO and the measurements made by the ACE satellite and other in situ instruments are important. But there are many more data sources currently in daily use. For an overview of these, see Hochedez et al (2005a, this issue). In addition, the SIDC also contributes its own data, as described below. This involvement in obtaining good-quality solar data is considered an important asset of the SIDC, since it implies a familiarity with the details of instrument specifications and limitations.
2.1 USET Telescopes
The Uccle Solar Equatorial Table (USET) is one of the prime reference stations contributing to the international network of the SIDC. The USET carries three independent refracting telescopes:
• A 150mm white-light telescope that projects a 25cm image of the photosphere on a screen for visual sunspot
drawings
• A 150mm white-light telescope for photospheric CCD imaging (broad spectral band pass in the blue-green, at max=510nm, band: 415-573nm)
• A 110mm H telescope based on a Lyot monochromator with a 0.07nm bandwidth and a CCD detector.
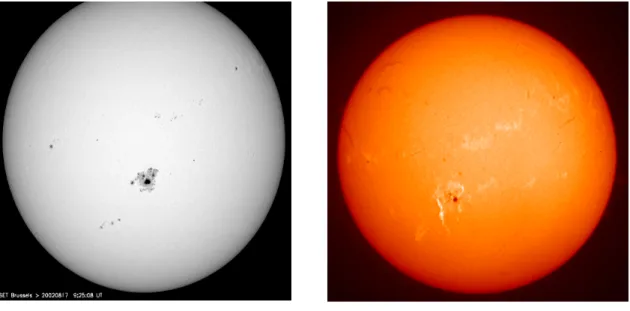
Fig 1: Left: white-light USET image (2002/08/17) featuring the giant sunspot group NOAA10069.
Right: H USET image (2002/08/16) showing an M5.2 two-ribbon flare in active region NOAA10069
The synoptic data from the white-light telescope, combined with similar data from other stations, are intended for quantitative measurements of sunspot properties (area, contrast), and in addition, measurements of faculae and their ill-understood contribution to irradiance changes. Indeed, whereas facular areas were measured in the past, systematic measurements of the spatial distribution of their amplitude (contrast) are also needed to assess their exact role, which dominates the sunspot component over the solar cycle (Walton et al. 2003, Foukal et al. 2004). Since mid-2003, the USET images are made accessible world-wide in near real time via the website of the SIDC (http://sidc.oma.be). The white-light and H imaging systems (Fig.1) are based on DALSA CA-D7 cameras with a 1024x1024 square CCD sensor. Both cameras offer a 12-bit 10MHz digital readout, which provides high images cadences of up to 8.5 images/s in frame-transfer mode (no mechanical shutter). Thanks to those specifications, we implemented an image selection process that allows compensating efficiently the atmospheric turbulence that is unavoidable at the 105m altitude. Image sequences of about 30 images are grabbed in a few seconds. Then, an algorithm measuring the average gradients and contrasts in sunspots and at the limb allows extracting the best images taken during brief moments of stability. Those images can have a resolution close to 2 arcsec, i.e. the present intrinsic limit of the instrument and detector. The CCD
Fig. 1. Left: white-light USET image (17 August 2002) featuring the giant sunspot group NOAA10069. Right: Hα USET image (16 August
2002) showing an M5.2 two-ribbon flare in active region NOAA10069.
the SIDC is described in Berghmans et al. (2002). In what follows we present an update on all the new activities
2 Instrumentation
Space weather forecasting is a new science application. To do it well, one needs to consider in detail many different as-pects of solar activity and the various types of consequences of this activity. It is therefore important to take as much data as possible into account. In particular EIT & LASCO in-struments onboard SOHO and the measurements made by the ACE satellite and other in situ instruments are important. But there are many more data sources currently in daily use. For an overview of these, see Hochedez et al. (2005a, this issue). In addition, the SIDC also contributes its own data, as described below. This involvement in obtaining good-quality solar data is considered an important asset of the SIDC, since it implies a familiarity with the details of instrument specifi-cations and limitations.
2.1 USET telescopes
The Uccle Solar Equatorial Table (USET) is one of the prime reference stations contributing to the international network of the SIDC. The USET carries three independent refracting telescopes:
– A 150 mm white-light telescope that projects a 25 cm
image of the photosphere on a screen for visual sunspot drawings
– A 150 mm white-light telescope for photospheric CCD
imaging (broad spectral band pass in the blue-green, at
λmax=510 nm, band: 415–573 nm)
– A 110 mm Hα telescope based on a Lyot
monochroma-tor with a 0.07 nm bandwidth and a CCD detecmonochroma-tor. The synoptic data from the white-light telescope, com-bined with similar data from other stations, are intended for quantitative measurements of sunspot properties (area, con-trast), and in addition, measurements of faculae and their ill-understood contribution to irradiance changes. Indeed, whereas facular areas were measured in the past, systematic measurements of the spatial distribution of their amplitude (contrast) are also needed to assess their exact role, which dominates the sunspot component over the solar cycle (Wal-ton et al., 2003; Foukal et al., 2004). Since mid-2003, the USET images are made accessible world-wide in near real time via the website of the SIDC (http://sidc.be).
The white-light and Hα imaging systems (Fig. 1) are based on DALSA CA-D7 cameras with a 1024×1024 square CCD sensor. Both cameras offer a 12-bit 10 MHz digital readout, which provides high images cadences of up to 8.5 images/s in frame-transfer mode (no mechanical shutter). Thanks to those specifications, we implemented an image selection pro-cess that allows compensating efficiently the atmospheric turbulence that is unavoidable at the 105 m altitude. Image sequences of about 30 images are grabbed in a few seconds. Then, an algorithm measuring the average gradients and con-trasts in sunspots and at the limb allows extracting the best images taken during brief moments of stability. Those im-ages can have a resolution close to 2 arcsec, i.e. the present intrinsic limit of the instrument and detector. The CCD sys-tems saw first light in June 2002 and have been in continu-ous operation since then. The Hα telescope is currently used in synoptic mode, like the white-light telescope (a few daily images), but it already allowed to capture several flare se-quences. An upgrade in the software will allow using it as a flare patrol instrument, probably by mid-2005.
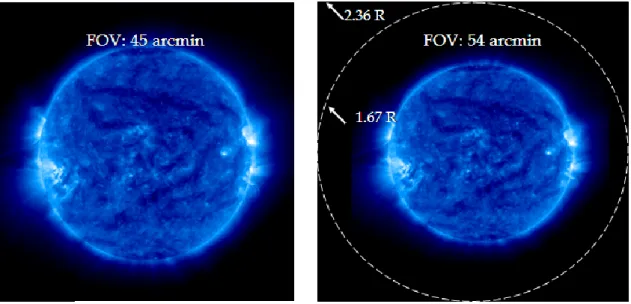
Fig. 2. Demonstration of the SWAP field of view. On the left, a SOHO/EIT image (17.1 nm, 8 July 2004, 19:00 UT). On the right, the same
image, but rescaled to the SWAP field of view.
The archive of visual drawings started in the late 1930. Since 1980 all drawings are digitized. This feeds an archive containing the evolution of each sunspot group (sunspot count, morphological type), which is tracked over multiple returns through the solar rotation. This information is dis-tributed worldwide through the SIDC sunspot bulletins (see Sect. 4.1). The USET is also one of the stations provid-ing the additional information about the North-South sunspot index, leading to the hemispheric sunspot number of the SIDC. Overall, the USET yields synoptic observations on 200 to 220 days per year despite the variable and often humid weather prevailing in Belgium.
2.2 SWAP and LYRA on board PROBA2
The SIDC is also preparing space-borne solar monitoring instruments for the ESA PROBA2 mission. PROBA2 is a follow-up of the successful PROBA (Teston, 2004), in or-bit since October 2001. The spacecraft is a micro-satellite not larger than a domestic washing machine with a weight of 100 kg. Launch will be in early 2007 as a piggy back payload joining the ESA SMOS satellite onboard a Eurockot launcher. A helio-synchronous dawn-dusk polar orbit sta-bilized at 06:00 is foreseen, which guarantees nearly unin-terrupted solar viewing. Besides technology demonstration, PROBA2 is an observatory for studying the UV and EUV variability of the Sun. The SIDC is involved in the two ma-jor components of the scientific payload, which are SWAP (Sun Watcher using APS detectors and image Processing) and LYRA (LYman Alpha Radiometer). Both SWAP and LYRA are developed under the technical management of the Centre Spatial de Li`ege (CSL, Belgium). After launch they will be operated from the SIDC as principle investigator’s in-stitute. Two more instruments are on board for measurement of the local plasma environment of the spacecraft: the
“Ther-mal Plasma Measurement Unit” (TPMU) and the “Dual Seg-mented Langmuir Probe” (DSLP).
LYRA (Hochedez et al., 2005b) is a compact solar UV ra-diometer, equipped with newly developed diamond detectors that are blind to the visible light above 220 nm. These UV sensors should degrade extremely slowly due to their radi-ation hardness and their room-temperature operradi-ation which decreases the risk of molecular contamination and subse-quent polymerization. In addition, their solar-blindness per-mits to use less optical filters resulting in larger effective ar-eas. LYRA will monitor the variability of the solar irradiance in four ultraviolet pass bands, carefully selected for their rel-evance to aeronomy, solar physics, and space weather. Two of the four LYRA channels are in the extreme UV. They are defined by the transmission of metallic filters, namely Alu-minum (17–40 nm) and Zirconium (1–20 nm). These two will give access to the hotter solar atmosphere. The Zr chan-nel is particularly expected to trigger on flares, while the Al channel includes the important HeII line at 30.4 nm and opens a window to the cooler corona around 1 MK. The other two LYRA channels are in the VUV, monitoring the Lyman-alpha irradiance and the important 200–220 nm Herzberg pass band. Both are of high aeronomy relevance; the former controls the formation of the D-region of the ionosphere, and plays an important role in the ozone balance, as the Herzberg flux does. Taking advantage of its concept and design, LYRA will be able to run at a cadence of several tens of Hz.
SWAP (Berghmans et al., 2005) has been proposed as a successor of the Extreme ultraviolet Imaging Telescope (EIT) onboard the SOHO mission (Delaboudini`ere et al., 1995). SWAP will continue the systematic “CME watch” program of the ageing EIT instrument for systematic detec-tion of space weather related solar events. In order to im-prove the observation of the onset of CMEs, SWAP will have a higher image cadence than EIT (1 min versus 12 min) and a
3118 D. Berghmans et al.: Solar activity: nowcasting and forecasting at the SIDC
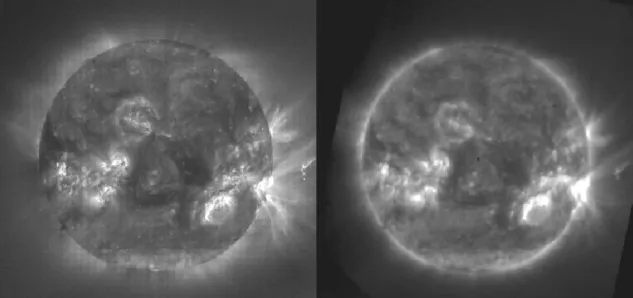
Fig. 3. On the left, a SOHO/EIT image (19.5 nm), showing an eruption above the west limb. On the right, a simultaneous
CORONAS-F/SPIRIT image (17.5 nm). Besides the obvious difference in spatial resolution, the two images show the same features, including the eruption (Slemzin et al., 2004).
20% larger field of view (Fig. 2). SWAP will use an off-axis Ritchey-Chr´etien telescope equipped with an EUV enhanced active pixel sensor detector (coated CMOS-APS). The band pass will be centered on 17.5 nm, which has been chosen for maximal photon flux. Observations by the SPIRIT instru-ment onboard the Russian CORONAS-F mission (Zhitnik et al., 2002) demonstrate (Fig. 3) that this band pass is equally suitable of showing the space weather relevant phenomena, such as solar flares or EIT-waves, as the EIT 19.5 nm band pass. Together with LYRA, SWAP will serve as a high per-formance solar monitoring tool for use in the SIDC daily space weather operations. LYRA as an UV flux monitor and SWAP as an EUV imager will be complementary to the X-ray monitors and the Solar X-X-ray Imager (SXI, Balch, 2002) onboard the GOES satellites. Together they will form the first European deployment in space specifically dedicated to space weather monitoring. The data will be immediately freely available through the SIDC website.
3 Software development
While the SIDC is manned only during day-time (7 days/week), the monitoring service is a 24 h activity thanks to the implementation of autonomous software for the recep-tion and analysis of data and the generarecep-tion and distriburecep-tion of automated alerts. Below, we give an overview of recently developed techniques for the automated analysis and visual-ization of solar images and discuss briefly their performance. 3.1 Computer Aided CME Tracking (CACTus)
The detection of CMEs has traditionally been addressed by visually checking coronagraph data for outward moving fea-tures. Such manual work is in fact quite successful: the
hu-man brain is an excellent pattern recognizer and a huhu-man operator is capable of intelligent interpretation of e.g. par-tially corrupted images. With the future coronagraphs on the STEREO spacecrafts this will however become a big in-vestment of manpower. Meanwhile, near-real-time alerts for halo CMEs are needed by the space weather community. In coronagraphic observations, halo CMEs appear as intensity enhancements surrounding the entire occulting disk (Howard et al., 1982). Although in typical cases halo CMEs take a few days to travel to the Earth, their timely detection is important as CPU-time intensive 3-D MHD simulations are required to estimate their geo-effectiveness. This implies that halo CME alerts should be issued 24 h per day.
For these reasons, we have developed a software pack-age, called CACTus (“Computer Aided CME Tracking”), that detects CMEs in coronagraphic images (Berghmans et al., 2002). CACTus detects CMEs as bright ridges in (time, height) maps (Sheeley, 1999) using the Hough transform. The next step employs clustering and morphological clos-ing operations to mark out different CMEs. The output is a list of events, similar to the classic catalogs, with start-ing time, principle angle, angular width and velocity esti-mation for each CME. Recently (Robbrecht and Berghmans, 2004) the performance was enhanced significantly (Fig. 4) and the near-real-time results are put immediately online (http://sidc.be/cactus, see also Sect. 4.2 for e-mail alerting). 3.2 Solar Weather Browser
As mentioned before, sources of solar data are numerous and diverse. Thanks to an open data policy, they are often publicly available in near-real-time over the internet. To go and look for all the data every time again is a very time-consuming task and often hampered by slow internet access
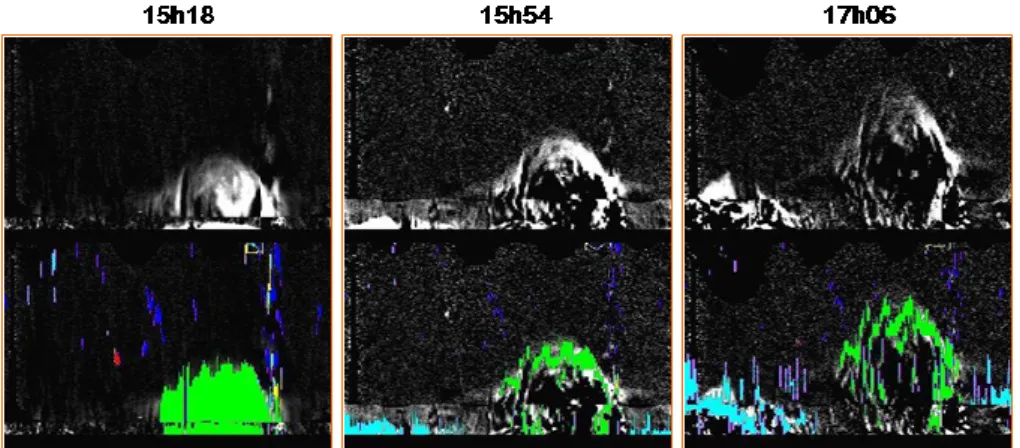
Fig. 4. A sequence of 3 running difference polar images is shown (top row), containing 2 CMEs on 11 November 2003. The bottom row
shows the CME detections by CACTus (from Robbrecht and Berghmans, 2004). The method is very successful, 96% of all CMEs detected by human operators were recovered (based on a data-set of 6 days in November 2003). However, the method also found many more events. Some of these were genuine CMEs missed by the operators, but in most cases the software discovered features that the operators disregarded for various reasons although they fulfill the formal definition (outward moving bright features). These include events that were felt to be too small or too narrow (called spikes, surges) or too much alike the background wind (called gusty outflow).
Fig. 5. Screenshots of the SWB.
during periods of high activity (just when they are needed most). It was felt therefore that forecasters need an easier access to data, without having to worry about formats and locations. Our response to that is the Solar Weather Browser (SWB, Fig. 5).
The SWB is a software tool developed by the SIDC for easy visualization of solar images in combination with any space weather relevant context information that can be over-laid on the images. The SWB consists of 3 developments: (1) the SWB back-end server (SWB-server), (2) the SWB user interface and (3) the SWB download and user support web-site. The server side preprocesses a wide variety of solar im-ages and context data into a highly compressed format that is accessed by the client side on the user machine. A newly
de-veloped compression technique (Nicula et al., 2005) is used for achieving its scalability goals. On the client side the user can interactively combine background images (e.g. EIT) with overlays (e.g. sunspot or filament locations). This allows an enormous number of image/overlays combinations (cur-rently on the order of 1000) which would not be feasible in a non-interactive set-up. This feature is particularly useful for the presentation of the results of automated solar image recognition/processing chains.
Given its highly optimized image compression and trans-mission, the SWB is also potentially useful in the context of distributed solar image archives where it could play the role of quicklook viewer. The SWB is an open-source develop-ment, readily downloadable for all major platforms.
3120 D. Berghmans et al.: Solar activity: nowcasting and forecasting at the SIDC
13:59UT 10/05/97 05:05UT 12/05/97 14:33UT 25/05/97 19:11UT 26/05/97
t
sk
ewness
kurtosis
0 -100 0 100 2x10 4x10 3 3Fig. 6. Illustration of 4 EIT waves and dimming signatures in May 1997. The upper panel plots the skewness (or asymmetry) of the difference
images versus time; the lower panel shows the kurtosis (sharpness of the peak). Moments are constructed for the distribution of the intensity difference of subsequent images.
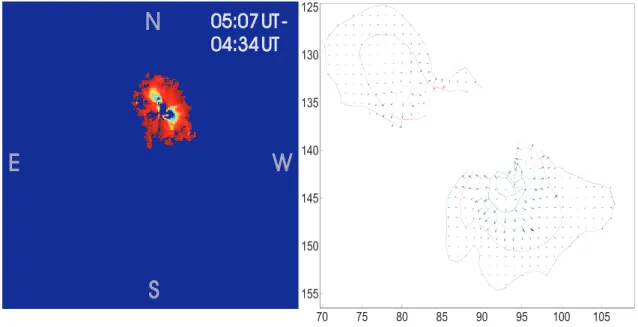
Fig. 7. Left shows extracted dimming. Right panel shows dimming structure map. Lines show equipotential levels of intensity, arrows show
the direction of intensity gradients.
3.3 The EIT wave and dimming detector
After the discovery of EIT waves (Thompson et al., 1998) it was soon realized that this phenomenon is strongly as-sociated with earth-directed CMEs (Plunkett et al., 1998, Biesecker et al., 2002). A dimming is usually observed be-hind the EIT wave and is most likely due to the evacuation of mass during the CME. Detecting EIT waves is a hard problem given their large variety in physical appearance and weak intensity variation. To by-pass this problem, the detec-tion is done without using the spatial informadetec-tion in the im-ages. Instead the detection is based on the characteristics of the histogram-distribution of running difference images. The presence of large-scale coherent structure, such as dimmings & EIT waves strongly influences the higher order moments (skewness, kurtosis) of the distribution. The deviations in the skewness and kurtosis (Fig. 6) can be used as triggers for the occurrence of an EIT wave and associated dimming.
In a next step we determine the location and size of the dimming. This is done by applying a region growing method that starts from the most dimmed pixels and using the as-sumption that the dimming is a simply connected region. Figure 7 (left) shows the resulting dimming. At the right hand side of Fig. 7 we show the structure map of dimming intensity.
We also determine automatically the location, timing, structure and dynamics of the EIT wave in a so-called ring & sector analysis, but this is beyond the scope of the present paper (see Podladchikova and Berghmans, 2005). A spiral-like motion of the wave has been detected and radial velocity and dimming characteristics determined automatically. More characteristics can be detected according to model develop-ment.
4 Scientific services
4.1 International sunspot index
The sunspot number is the oldest solar activity index. In 1849, R. Wolf of the Z¨urich Observatory proposed the now widely used formula: R=K (10 G+S) in which S represents the number of observed sunspots and G the number of ob-served sunspot groups. The “quality factor” K was intro-duced later on to compare results from different observers, sites and telescopes. The first task of the SIDC consists in collecting the observations from a worldwide network of sta-tions (including, of course, our own), to determine the ap-propriate K-factor for each of them and to extract an overall “international sunspot number” from all these observations in a good statistical sense. In this procedure, the coefficient of the reference station Locarno is fixed at the value K=0.6 to provide continuity with the earlier series. This is in fact the secular conversion factor of 3 Swiss stations to the for-mer sequence of observations made by Wolf and Br¨unner after 1820. As some observing stations have faster commu-nication possibilities (e-mail) than others (regular mail), this task is split in two stages: first a provisional value is calcu-lated and later on, when all observations have been received, a definitive value is adopted. At the current time, about 40 stations contribute to the provisional sunspot numbers and typically twice as many to the definitive values. Approxi-mately a quarter of these are professional observatories. In total, more than 220 stations have at least once contributed observations to the SIDC.
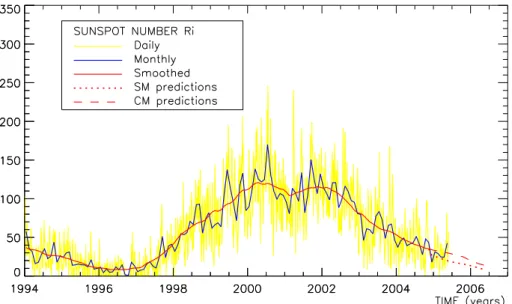
The SIDC calculates sunspot indices with different time-frames: daily sunspot number, monthly and monthly smoothed sunspot number and yearly sunspot number (see Fig. 8). Thus, we provide reference information for both short-term and long-term variation of solar activity. The daily sunspot number also highlights the non-uniform lon-gitudinal distribution of solar active regions. Since 1992, we also provide hemispheric sunspot numbers, since there is growing evidence of an asymmetry in the activity cycle be-tween north and south solar hemisphere. Finally, the SIDC also computes once a year central zone sunspot numbers and averaged spotted areas and publishes these in the Quarterly Bulletin on Solar Activity. Based on spotted area data, a daily Prompt Photometric Sunspot Index is also computed. For more information on the procedure used, see Vanlommel et al. (2005).
Besides performing the routine calculations for the dif-ferent sunspot indices, the SIDC also generates forecasts of the future evolution of the smoothed monthly index (up to 12 months ahead) using the procedures described in Denkmayr and Cugnon (1997) and participates in ad hoc committees for the forecasts of the expected evolution of the solar cycle on the longer term (e.g. to estimate the height of the next solar cycle). At regular intervals, quality checks are performed on the data generated to detect possible long term discrepancies (for example systematic drifts) in the
Interna-tional Sunspot Number. For these studies, only data from a subset of very reliable stations is used.
4.2 Space weather reporting and forecasting
As a free service to the community, the SIDC distributes a number of different mail messages. To receive these e-messages, one can register at the SIDC website http://sidc.be. In order of timeliness we have:
– Fast threshold alerts: automated alerts for flares and
geomagnetic activity. Timeline analysis software has been developed that automatically sends an alert when-ever a flare (>M5.0) is detected, when the local K-measurements (Dourbes Geophysical Center) are above K>5 or when strong perturbations to the RTK-GPS po-sitioning are expected or observed.
– Fast alert messages (so-called PRESTOs): fast alert of
significant space weather events. The PRESTO mes-sage is typically on the order of 10 lines, describing a re-cently occurred event, its expected further evolution and the effect it might have. PRESTOs are issued as soon as possible for shocks in the solar wind speed/density, for large flares (>X1.0), for (partial) halo CMEs, for sud-den increases in the geomagnetic activity (K>5) and in case proton flux levels trespass the 10pfu threshold.
– CACTus message: (partial) halo CME alerts. The above
described CACTus software sends out an alert for every CME it discovers in the last 3 days of SOHO/LASCO data with an angular width of more than 180 degrees. The message includes the time of first appearance in LASCO/C2, the principal angle, angular width and ra-dial velocity. The CACTus software is run every 3 h. Notifications are sent afterwards in case of a false alert (e.g. due to corrupted data).
– Daily Space Weather Report (URSIGRAM): daily
fore-cast and review of solar and geomagnetic activity. The “Daily solar weather report” contains a daily report and a forecast for the coming hours and days of a variety of parameters that characterize the solar activity (10.7 cm radio flux, provisional sunspot number, sunspot/active regions and their flaring history and future probability, coronal hole location and expected influence on solar wind, CME occurrence,. . . ). This message is partly in plain text for human readability and partly encoded for computer processing. It is issued at 12:30 UT.
– Weekly bulletins: review of past week’s solar and
geo-magnetic activity. The weekly SIDC Bulletin gives de-tailed report of solar activity (including sunspot number, solar flares, filament eruptions and CMEs, 10.7 cm radio flux), interplanetary environment (solar wind plasma and magnetic fields, energetic protons) and geomag-netic conditions (A and K indices, maggeomag-netic storms) during the past week. The success of daily predictions is estimated.
3122 D. Berghmans et al.: Solar activity: nowcasting and forecasting at the SIDC
Fig. 8. The last 12 years of sunspot data published by the SIDC, showing the most relevant sunspot numbers and medium-term forecast
produced.
– Monthly SIDC bulletin: provisional values and
fore-casts of the international sunspot index. Our monthly SIDC bulletin starts from diverse information about the sunspots (e.g. calculated international sunspot number, hemispheric sunspot numbers etc.). Predictions of the sunspot index for the coming months are given and ex-pected returning sunspot groups are reported. The bul-letin also incorporates the combined data from weekly bulletins to form a monthly report on solar and geomag-netic activity.
– Quarterly SIDC news: Definitive values of the
interna-tional sunspot index.
Besides those listed above, a few more dedicated messages (often a specialized version or an extraction of one of the above) are sent to a limited number of registered users (see Berghmans et al., 2002, for a complete list)
4.3 GPS services
In the frame of the ESA Space Weather Pilot Project, the SIDC is also involved in the development of services dedi-cated to the users of the Global Positioning System (GPS): this project results from a collaboration between the Royal Observatory of Belgium (GPS section) and the Royal Mete-orological Institute of Belgium (Dourbes Geophysical Cen-ter). GPS is a unique low-cost tool which allows to measure positions for many different applications. The level of preci-sion that can be reached depends on the type of application and on the positioning technique used: navigation (10–20 m), precise navigation (1–4 m), surveying or field geodesy (a few cm), high precision geodesy (a few millimeters). In practice, the effect of the Earth’s ionosphere on the radio waves emit-ted by GPS satellites is the main factor that limits the preci-sion and the reliability of this positioning system. This effect
depends on the wave frequency and on the Total Electron Content (TEC), which is the integral of the ionosphere free electron concentration on the receiver-to-satellite path. The TEC depends on many parameters and it is therefore very difficult to predict using simple models.
Disturbed Space Weather conditions are often the source of strong variability in the ionospheric plasma (TEC). For example, severe geomagnetic storms lead to ionospheric storms, which themselves strongly degrade GPS precision. In the GPS user community, there is a demand to be informed in real time and to have forecasts about the influence of Space Weather on precision and on the reliability of the differ-ent types of GPS applications. Since the beginning of the nineties, the Royal Observatory of Belgium (ROB) is con-ducting a research program dedicated to the study of iono-spheric effects in space geodesy. The goal of this project is to assess, in real time, to forecast, a few hours in advance, and to mitigate the effect of Space Weather and of the ionosphere on GPS applications. Based on the experience gained in this field, we decided to develop Space Weather related products for GPS users. At the present time, our services are mainly dedicated to 2 types of applications: precise navigation us-ing the so-called DGPS technique and surveyus-ing with the so-called Real Time Kinematic (RTK) technique. Both are differential positioning techniques. The principle of differ-ential positioning is the following: a fixed reference station of which the position is well-known broadcasts information, called “differential corrections”. These corrections improve the precision of a mobile user position. The closer the mo-bile user is to the reference station, the more efficient the differential correction is. Indeed, the “basic” measurement made by a GPS receiver is a range between a satellite of which the position is known and a GPS antenna of which the position is unknown. This range measurement is called
“pseudo-range” as it is affected by satellite and receiver clock errors, atmospheric propagation delays, etc. As both the ref-erence station and the mobile user are observing the same satellites, the differential technique is based on the assump-tion that both pseudo-range measurements are affected in the same way by the different error sources. This assumption is valid as long as the separation distance between the user and the reference station remains “short enough”. The expres-sion “short enough” has a different meaning depending on the application:
– Real Time Kinematic (RTK) allows to reach a
cm-precision on distances up to 10 km; the ionospheric ef-fect on this application depends on small-scale (10 km) gradients in the ionosphere.
– DGPS allows to reach a meter-precision on distances up
to 1000 km; the ionospheric effect on this application depends on large-scale (500–1000 km) TEC gradients. The strategy we are using to compute our GPS products is the following: in a first step, we measure both types of gradi-ents in the TEC using GPS measuremgradi-ents. Indeed, GPS dual frequency observations can be combined in order to recon-struct the TEC (Warnant 1998; Warnant and Pottiaux, 2000). In a second step, the effect of the measured TEC gradients on DGPS and RTK applications is assessed and published on the SIDC web site. In the case of DGPS, this informa-tion is directly expressed in terms of posiinforma-tioning error when, for RTK, the ionospheric effect is assessed using a system of colours (green: no degradation of RTK precision due to the ionosphere, orange: small degradations, red: strong degra-dations, black: extreme degradations or even impossible to measure positions). At the present time, we are doing re-search in order to be able to replace this system of colours with a direct assessment in terms of RTK positioning error. As severe geomagnetic storms are the origin of strong or even severe degradations, we also make forecasts: when we expect that the Kp geomagnetic index will reach a value larger or equal to 8 in the next few hours, we send a warning message to our registered users stating that the positioning conditions could be strongly or even severely degraded (red or black conditions) in the next few hours.
5 Recent results
It is still premature to speak about the prediction, several days in advance, of the detailed characteristics of a geomagnetic storm, i.e. its onset time and the profiles of e.g. the Dst and Kp indices. However, significant progress has been made during the last decade in understanding the solar sources of this complicated phenomenon. It is now well established that CMEs play a key role in producing geomagnetic storms (Gosling et al., 1990; Kahler, 1992). To be geo-effective, a CME or CME-associated disturbance (e.g. a post-shock sheath) should arrive to the Earth and contain specific netic field orientation: the north-south interplanetary
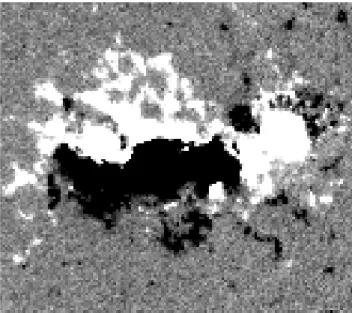
mag-Fig. 9. A part of a SOHO/MDI magnetogram obtained at 17:35 UT
on 7 November showing the NOAA AR 0696.
netic field (IMF) component Bz should be negative (south-ward), strong enough and long-lasting (Burton et al., 1975; Gonzalez and Tsurutani, 1987). The research performed at the SIDC aims at understanding possible early signatures of CME geo-effectiveness and their verification in the process of daily operational space weather forecasting.
Of particular interest are halo CMEs (propagating towards or away from the Earth). They are now routinely registered by LASCO coronagraph onboard SOHO. Solar disk obser-vations in EUV provide means to identify the front-sided CMEs (i.e. the ones that can be directed to the Earth) among all full and partial halos. The EIT instrument has excel-lent capabilities for the search of front-sided CME signa-tures, especially in its FeXII band pass centered at 19.5 nm. CMEs have a variety of signatures that can be seen by EIT: coronal dimmings, EIT waves, post-eruption arcades, filament/prominence eruptions and diverse limb signatures (e.g. Zhukov, 2005). It is rare that a CME has all of these sig-natures, and the dimmings seem to be the most frequent and reliable CME counterpart in the low corona (Zhukov, 2004). It has been demonstrated (Zhukov, 2005) that the dimmings can sometimes be identified more easily than CMEs – when a CME is weak (and thus hardly registered by LASCO be-cause of its insufficient sensitivity), the corresponding dim-ming can still be clearly visible.
An interesting question is the location of geo-effective CME source regions. It is clear that there is a concentra-tion of the source regions around the disc center, but dif-ferent opinions exist concerning the presence (e.g. Zhang et al., 2003) or absence (e.g. Cane et al., 2000) of shift of the source regions distribution to the west. The role of East-limb partial halos (Zhang et al., 2003) is still controversial (Zhukov, 2005). Although there is a strong concentration of geo-effective CMEs’ source regions close to the disc center, even CMEs originating at the limb can arrive to the Earth
3124 D. Berghmans et al.: Solar activity: nowcasting and forecasting at the SIDC
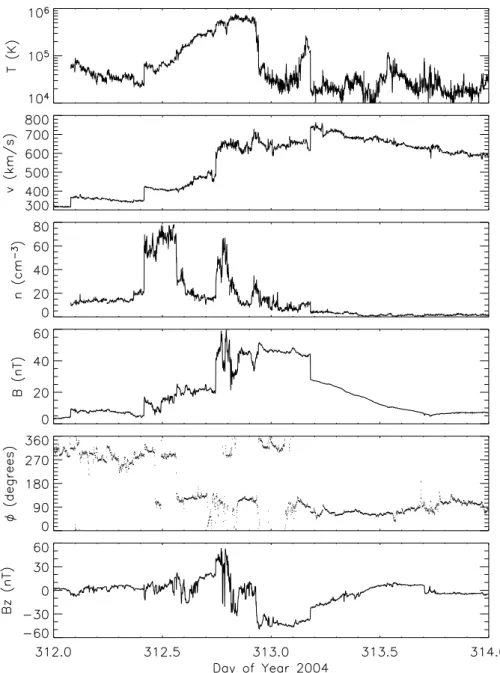
Fig. 10. ACE MAG and SWEPAM data showing the compound ICME structure on 7–8 November (DOY 312–313). From top to bottom:
proton temperature, solar wind speed, proton number density, magnetic field, longitudinal angle 8, magnetic field Bz component (in GSE coordinate system).
(provided they are wide enough) and produce geomagnetic storms. In most of such cases, however, only an interplan-etary shock is observed (e.g. Manoharan et al., 2004) as the angular extent of the shock is larger than that of a correspond-ing CME. Once the CME is observed, its arrival time to the Earth can be estimated on the base of the measured plane-of-the-sky speed (Brueckner et al., 1998; Gopalswamy et al., 2001; Cane and Richardson, 2003). However, to assess the strength of a possible storm, not only the CME arrival, but also the IMF Bz component has to be predicted. Moreover, a big challenge is to predict the CME before it actually hap-pened, so precursors of eruptions have to be identified.
A recent hot topic of possible use for CME predictions is the study of sigmoids. Sigmoids represent the S- or reverse
S-shaped regions (therefore with highly non-potential mag-netic configurations) observed in soft X-rays. It has been suggested (Canfield et al., 1999) that sigmoidal active re-gions are more likely to erupt provided that they are truly (not projected) sigmoidal (Glover et al., 2000). EIT observa-tions demonstrate, however, that almost all of the sigmoidal active regions are collective features, i.e. a sigmoid cannot be represented as a single magnetic flux tube or S-shaped loop, but exhibits an assembly of many small-scale structures (Zhukov et al., 2003). This uncertainty of the observational definition of a sigmoid does not allow us to use sigmoids effi-ciently in the operational space weather forecast as different works give different statistics on the probability of eruption (Canfield et al., 1999; Glover et al., 2000). Moreover, the
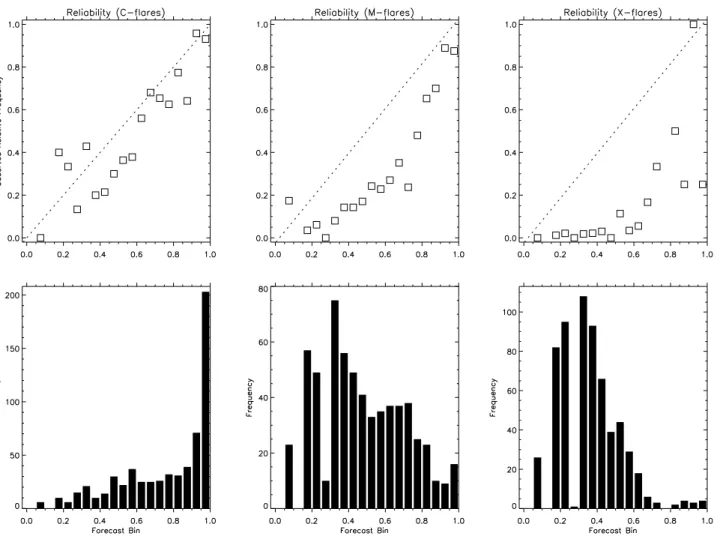
Fig. 11. Reliability of flare forecasts. The top panel plots the observed relative frequency of C, M or X flare days against their corresponding
forecasts, grouped in 5% bins. The red dashed line represents the perfect correspondence. Points below this diagonal indicate an overestima-tion, points above the diagonal indicate an underestimation. The lower panel shows the number of the forecasts in each bin. The data covers the period from April 2003 until now.
sigmoids can also appear right after the eruption (Glover et al., 2001; Zhukov et al., 2003) – a fact that does not seem to agree with the kink-unstable twisted flux tube eruption sce-nario. Finally, nothing indicates when the eruption of a sig-moidal active region will occur.
Although the eruption time cannot be predicted reliably now, one can obtain an indication on the resulting IMF ori-entation (in particular, on its Bz component which is crucial for the assessment of the strength of a possible geomagnetic disturbance). The idea was first reported in the 1970s, when the key role of CMEs in producing geomagnetic storms was not yet established. Pudovkin and Chertkov (1976) proposed that the magnetic field after an interplanetary shock is deter-mined by the magnetic field in the flare region. This idea was strongly critisized (e.g. Wright and McNamara, 1982; Gosling, 1995), partly because the method of Pudovkin and Chertkov (1976) was based on the analysis of rather scarce observational data available at that time.
Now, with more detailed observations of the Sun and of the solar wind at our disposal and with the advance of new theoretical concepts, it became possible to reelaborate this
idea. If the photospheric magnetic field of the CME source region has a bipolar configuration (it is often the case), one can determine the orientation of a neutral line and thus get an idea about the inclination of the axis of the ejected in-terplanetary flux rope (Marubashi, 1997; Yurchyshyn et al., 2001; McAllister et al., 2001; Bothmer, 2003). If the shear of the magnetic field can be determined (looking e.g. at the post-eruption arcade in the EIT data), the direction of the magnetic field in the flux rope can be reasonably estimated.
The real-time forecasting using such a method can be illus-trated by an example of a partial halo CME on 4 November 2004. The main neutral line in the NOAA AR 0696 (the CME source region) was stretched in the east-west direc-tion during its whole passage of the solar disc (see a pho-tospheric magnetogram in Fig. 9), with the positive polarity to its northern side. On the base of the magnetogram we de-termined that the erupting flux rope will have a south-north orientation of its large-scale magnetic field (e.g. Bothmer and Schwenn, 1998). Here is an excerpt of the presto issued by the SIDC forecaster on 5 November, 09:06 UT: “. . . The
3126 D. Berghmans et al.: Solar activity: nowcasting and forecasting at the SIDC
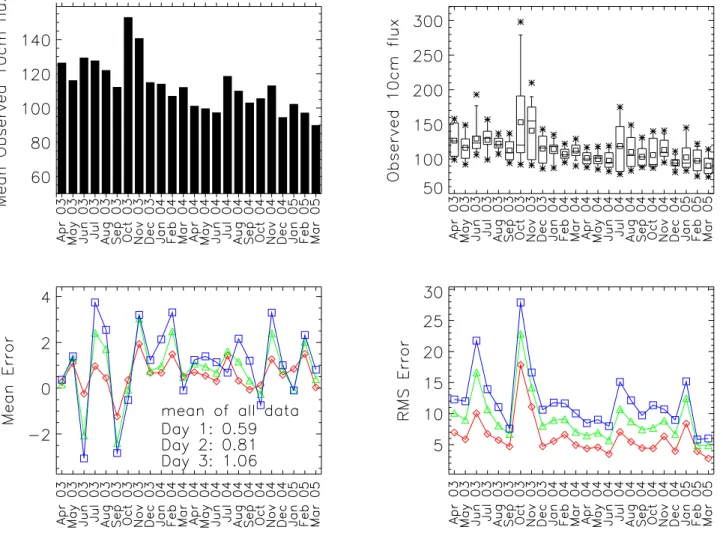
Fig. 12. 10.7 cm radio flux forecast. The top left panel shows the mean observed flux for each month. The top right graph is a box plot of
the monthly distribution. Stars indicate the minimum and maximum value, the small square the mean observed value and the horizontal line within the box indicates the median. The box contains the observed values from the lower quartile (25%) to the upper quartile (75%) of the distribution. The lower panel concerns the forecast: in the left panel the monthly mean error is plotted, the right panel shows the monthly root mean square error. The red curve represents the forecast for the same day (day 1), the green curve the forecast for the next day (day 2) and the blue curve for two days ahead (day 3).
CMEs is expected on 7–8 November. The occurrence of a strong geomagnetic storm is possible, as the ejected inter-planetary flux rope will probably have the leading southward magnetic field.”. Indeed, the resulting magnetic cloud that
started around 22:00 UT on 7 November and ended around 17:00 UT on 8 November (Fig. 10) was of the SEN type (see Bothmer and Schwenn, 1998, for the classification), thus be-ing in agreement with our prediction. We note, however, that such a procedure of forecasting the flux rope orientation is still tentative, as a statistical study using a large data set still has to be performed.
6 Quality control
The SIDC developed an extended list of space weather ser-vices, which includes sending alerts and daily forecasts. We reach industrial, commercial, scientific entities, amateur as-sociations, as well as the general public. For most, if not
all, our forecasts should be reliable as it can be crucial for the well functioning of the technology or services of the companies and organizations involved. In this sense, the evaluation of our forecast is a core product as it gives infor-mation about the capability and limitations. In this section, we present some statistics concerning the global flare proba-bility and the 10.7 cm radio flux forecast for the period from April 2003 up till December 2004.
6.1 Reliability of flare forecast
For every sunspot group with Catania numbering, we fore-cast a daily C, M, X-flare probability. A forefore-cast is done in bins with 10% width (0–9%, 10–19%, . . . , 90–99%). From the C, M and X forecast per group, the global percentage is calculated taking into account the predicted upper limits of the bin. To calculate the next-day C, M and X flare forecast reliability, we group all days with a predicted chance in the corresponding 5% bin. We divide the number of days in that
bin on which a C, M or X flare actually occurred by the total number of days in a bin. Points falling below the diagonal indicate a tendency of overestimating the occurrence of C, M or X flares, while points above the diagonal indicate underes-timation. From Fig. 11 we see a global trend to overestimate the occurrence of flares. This is partly due to the fact that the calculation of the global percentage is based on the up-per limit of the 10% bin. This explains why we don’t have forecasts in the lowest 5% bin. We still have to keep in mind that our data-set is rather limited to make a proper statistical investigation about the prediction of large events (X flares), which are more rare to happen.
6.2 The 10.7 cm radio flux
We investigate the prediction of the 10.7 cm radio flux on a scale of one month in Fig. 12. Per month, we calculate the mean error and the root mean square (rms) error of the fore-cast. The error is defined as the difference of the predicted and the observed flux. The peaks in the graph presenting the rms error coincide with an increased value of the mean served 10.7 cm radio flux of that particular month. The ob-served peak in October–November 2003 coincides with an active period referred to as the Halloween storms. Besides this, there is a correlation between the spread of the observed 10.7 cm radio flux (see the box plot in Fig. 12 and the rms error: October 2003 had the biggest spread of 206 sfu as the minimum/maximum observed value was 92/298.
7 Conclusions
The SIDC is a quickly growing center for solar monitor-ing. From the original service of World data Center for the Sunspot Index, the SIDC has grown into a European center for solar monitoring on all timescales. Based on solar ob-servations on the ground and in space, advanced automated software and the scientific support from the Solar Physics Department of the Royal Observatory of Belgium, we can now offer a variety of services to the community involved with space weather. Meanwhile a continuous quality control of our outgoing forecasts is implemented and systematic de-viations are fed back to the team of forecasters. Thanks to the generous support from various funding agencies (see below) we can offer the services free of any charges. All the results, services and software discussed in this paper can be accessed at the SIDC webpage at http://sidc.be.
Acknowledgements. The activities of the SIDC are supported
by the Royal Observatory of Belgium (ROB), the FAGS, the ESA/PRODEX SIDC Telescience project and the ESA Pilot Project for Space Weather Applications (contract 16913/03/NL/LvH) with the SWENET network. In addition, the SIDC also benefits from the presence of the various solar physics activities (EIT, SWAP, LYRA, STEREO/SECCHI) at the Department of Solar Physics of the ROB that are supported by the Belgian Science Office through the ESA/PRODEX program. Data from virtually all instruments onboard SOHO are regularly used. SOHO is a project of interna-tional cooperation between ESA and NASA. We thank the ACE
SWEPAM and MAG instrument teams and the ACE Science Cen-ter for providing the ACE data.
Topical Editor R. J. Forsyth thanks D. Boteler and H. Lundstedt for their help in evaluating this paper.
References
Balch, C. C., Hill, S. M., Pizzo, V. J., and Wilkinson, D. C.: First Forecast Products from The GOES-12 Solar X-ray Imager, in 82nd AMS Annual Meeting, Sixth Symposium on Integrated Ob-serving Systems, Orlando, Florida, 2002.
Berghmans, D., Foing, B. H., and Fleck, B.: Automated detection of CMEs in LASCO data, in: Proceedings of the SOHO 11 Sym-posium From Solar Min to Max: Half a Solar Cycle with SOHO, edited by: Wilson, A., 11–15 March 2002, Davos, Switzerland, ESA SP-508, 437–440, 2002.
Berghmans, D., Clette, F., Cugnon, P., Gabryl, J.-R., Hochedez, J.-F., Van der Linden, R. A. M., and Verwichte, E.: The solar influences data analysis centre, J. Atmos. Solar-Terr. Phys., 64, 5–6, 757–761, 2002.
Berghmans, D., Hochedez, J. F., Defise, J. M., Lecat, J. H., Nicula, B., Slemzin, V., Lawrence, G., Katsyiannis, A. C., Van der Lin-den, R., Zhukov, A., Clette, F., Rochus, P., Mazy, E., Thibert, T., Nicolosi, P., Pelizzo, M.-G., and Sch¨uhle, U.: SWAP on board PROBA2, a new EUV imager for solar monitoring, Adv. Space Res., accepted, 2005.
Biesecker, D. A., Myers, D. C., Thompson, B. J., Hammer, D. M., and Vourlidas, A.: Solar Phenomena Associated with EIT waves, Astrophysical Journal, 569, 1009–1015, 2002.
Bothmer, V. and Schwenn, R.: The structure and origin of magnetic clouds in the solar wind, Ann. Geophys., 16, 1–24, 1998,
SRef-ID: 1432-0576/ag/1998-16-1.
Bothmer, V.: Sources of magnetic helicity over the solar cycle, in: Proc. ISCS 2003 Symposium, Solar Variability as an Input to the Earth’s Environment, edited by: Wilson, A., ESA SP-535, p. 419, 2003.
Brueckner, G. E., Delaboudini`ere, J.-P., Howard, R. A., Paswaters, S. E., St. Cyr, O. C., Schwenn, R., Lamy, P., Simnett, G. M., Thompson, B., and Wang, D.: Geomagnetic storms caused by coronal mass ejections (CMEs): March 1996 through June 1997, Geophys. Res. Lett., 25, 3019–3022, 1998.
Burton, R. K., McPherron, R. L., and Russell, C. T.: An empirical relationship between interplanetary conditions and Dst, J. Geo-phys. Res., 80, 4204–4214, 1975.
Cane, H. V., Richardson, I. G., and St. Cyr, O.C.: Coronal mass ejections, interplanetary ejecta and geomagnetic storms, Geo-phys. Res. Lett. 27, 3591, 2000.
Cane, H. V. and Richardson, I. G.: Interplanetary coronal mass ejec-tions in the near-Earth solar wind during 1996–2002, J. Geophys. Res. 108(A4), SSH 6–1, 2003.
Canfield, R. C., Hudson, H. S., and McKenzie, D. E.: Sigmoidal morphology and eruptive solar activity, Geophys. Res. Lett. 26(6), 627–630, 1999.
Delaboudini`ere, J.-P., Artzner, G. E., Brunaud, J., et al.: EIT: Extreme-Ultraviolet Imaging Telescope for the SOHO Mission, Sol. Phys., 162, 291, 1995.
Denkmayr, K. and Cugnon, P.: About Sunspot Number Medium-Term Predictions, in: Solar-Terrestrial Prediction Workshop V, edited by: Heckman, G., Maruboshi, K., Shea, M. A., Smart, D. F., and Thompson, R., Hiraiso Solar Terrestrial Research Cen-ter, Japan, 103, 1997.
3128 D. Berghmans et al.: Solar activity: nowcasting and forecasting at the SIDC Foukal, P., Bernasconi, P., Eaton, H., and Rust, D.: Broadband
Mea-surements of Facular Photometric Contrast Using the Solar Bolo-metric Imager, Astrophysical Journal, 611, L57–l60, 2004. Glover, A., Ranns, N. D. R., Harra, L. K., and Culhane, J. L.: The
magnetic topology of a sigmoid, Geophys. Res. Lett. 27, 14, 2161–2164, 2000.
Glover, A., Harra, L. K., Matthews, S. A., Hori, K., and Culhane, J. L.: Long term evolution of a non-active region sigmoid and its CME activity, Astron. Astrophys. 378, 239, 2001.
Gonzalez, W. D. and Tsurutani, B. T.: Criteria of interplanetary parameters causing intense magnetic storms (Dst<−100 nT), Planet. Space Sci. 35, 1101, 1987.
Gopalswamy, N., Lara, A., Yashiro, S., Kaiser, M. L., and Howard, R. A.: Predicting the 1-AU arrival times of coronal mass ejec-tions, J. Geophys. Res. 106, 29 207–29 217, 2001.
Gosling, J. T., Bame, S. J., McComas, D. J., and Phillips, J. L.: Coronal mass ejections and large geomagnetic storms, Geophys. Res. Lett. 17, 901, 1990.
Gosling, J. T.: Reply. J. Geophys. Res., 100, 7921–7923, 1995. Hochedez, J.-F., Zhukov, A., Robbrecht, E., Van der Linden, R.,
Berghmans, D., Vanlommel, P., Theissen, A., and Clette, F.: So-lar weather monitoring, Ann. Geophys., 23, 3149–3161, 2005a. Hochedez, J.-F., Schmutz, W., Stockman, Y., et al.: LYRA: The
Solar UV radiometer aboard the ESA PROBA2, Adv. Space Res., accepted, 2005b.
Howard, R. A., Michels, D. J., Sheeley Jr., N. R., and Koomen, M. J. L.: The observation of a coronal transient directed at earth, Astrophysical Journal, 263, L101, 1982.
Kahler, S. W.: Solar flares and coronal mass ejections, Ann. Rev. Astron. Astrophys. 30, 113, 1992.
Manoharan, P. K., Gopalswamy, N., Yashiro, S., Lara, A., Michalek, G., Howard, R. A., J. Geophys. Res. 109, A06109, doi:10.1029/2003JA010300, 2004.
Marubashi, K.: Interplanetary magnetic flux ropes and solar fila-ment, in: Coronal Mass Ejections, edited by: Crooker, N., Jose-lyn, J. A., and Feynman, J., AGU Geophys. Monogr. Ser., vol. 99, p. 147, 1997.
McAllister, A. H., Martin, S. F., Crooker, N. U., Lepping, R. P., and Fitzenreiter, R. J., A test of real-time prediction of magnetic cloud topology and geomagnetic storm occurrence from solar signatures, J. Geophys. Res., 106, 29 185, 2001.
Nicula, B, Berghmans, D., and Hochedez, J. F.: Poisson recording of solar images for enhanced compression, Solar Physics, 228, 253–264, 2005.
Podladchikova, O. V. and Berghmans, D.: Automated detection of EIT waves and dimmings, Solar Physics, 228, 265–284, 2005. Plunkett, S. P., Thompson, B. J., Howard, R. A., Michels, D. J.,
St. Cyr, O. C., et al.: LASCO observations of an Earth-directed coronal mass ejection on 12 May 1997, Geophys. Res. Lett. 25, 2477–2480, 1998.
Pudovkin, M. I. and Chertkov, A. D.: Magnetic field of the solar wind, Solar Physics, 50, 213, 1976.
Robbrecht, E. and Berghmans, D.: Automated recognition of coro-nal mass ejections (CMEs) in near-real-time data, Astronomy and Astrophysics, 425, 1097–1106, 2004.
Slemzin, V., Zhitnik, I. A., Ignatiev, A. P., Kuzin, S. V., Pertsov, A. A., Oparin, S. N., Grechnev, V. V., Cher-tok, I. M., and Lisin, D. V.: EUV Observations of CME-Associated Eruptive Phenomena with the CORONAS-F/SPIRIT Telescope/Spectroheliograph, in: IAU Symposium 226 “Coro-nal and Stellar Mass Ejections”, 13–17 September 2004, Beijing, China, p. 18, 2004.
Sheeley, N. R., Walters, H. H., Wang Y. M., and Howard, R. A.: Continuous tracking of coronal outflows: Two kinds of coronal mass ejections, J. Geophys. Res. 104, 24 739, 1999.
Teston, F., Bernaerts, D., and Gantois, K.: Proba, an ESA technol-ogy demonstration mission, results after 3 years in orbit, in: Pro-ceedings of the 4S Symposium: Small Satellites, Systems and Services (ESA SP-571), 20–24 September 2004, La Rochelle, France, edited by: Warmbein, B., published on CD-ROM, p. 7.1, 2004.
Thompson, B. J., Plunkett, S. P., Gurman, J. B., Newmark, J. S., St. Cyr, O. C., et al.: SOHO/EIT observations of an Earth-directed coronal mass ejection on 12 May 1997, Geophys. Res. Lett., 25, 2465–2468, 1998.
Vanlommel, P., Cugnon, P., Van der Linden, R. A. M., Berghmans, D., and Clette, F.: The SIDC, World Data Centre for the Sunspot Index, Solar Physics, 224, 113–120, 2005.
Walton, S. R., Preminger, D. G., and Chapman, G. A.: The Con-tribution of Faculae and Network to Long-Term Changes in the Total Solar Irradiance, Astrophysical Journal, 590, 1088–1094, 2003.
Warnant, R.: Detection of irregularities in the TEC using GPS mea-surements. Application to a mid-latitude station, Acta Geodaet-ica et GeophysGeodaet-ica HungarGeodaet-ica, 33(1), 121–128, 1998.
Warnant, R. and Pottiaux, E.: The increase of the ionospheric ac-tivity as measured by GPS, Earth, Planets and Space, 52, 11, 1055–1060, 2000.
Wolf, R.: Sonnenflecken-Beobachtungen von Herrn Professor Rud. Wolf in Z¨urich, Astronomische Nachrichten, 72, 203, 1868. Wright, C. S. and McNamara, L. F.: Flare induced geomagnetic
ac-tivity and orientation of the photospheric magnetic field, Nature, 299, 42–44, 1982.
Yurchyshyn, V. B., Wang, H., Goode, P. R., and Deng, Y.: Orien-tation of the Magnetic Fields in Interplanetary Flux Ropes and Solar Filaments, Astrophysical Journal, 563, 381, 2001. Zhang, J., Dere, K. P.. Howard, R. A., and Bothmer, V.:
Identifi-cation of Solar Sources of Major Geomagnetic Storms between 1996 and 2000, Astrophysical Journal, 582, 520, 2003.
Zhitnik, I. A. , Bougaenko, O. I., Delaboudini`ere, J.-P., et al.: SPIRIT X-ray telescope/spectroheliometer results, in: “Solar variability: from core to outer frontiers”, Proc. of the 10th Eu-ropean Solar Physics Meeting, ESA SP-506, 915–918, 2002. Zhukov, A. N., Veselovsky, I. S., Clette, F., Hochedez, J.-F.,
Dmitriev, A. V., Romashets, E. P., Bothmer, V., Cargill, P.: Solar Wind Disturbances and Their Sources in the EUV Solar Corona, in: SOLAR WIND TEN: Proceedings of the Tenth International Solar Wind Conference, Pisa, Italy, 17–21 June 2002, edited by: Velli, M., Bruno, R., and Malara, F., AIP Conference Proceed-ings, volume 679, Melville, New York, p. 711–714, 2003. Zhukov, A.: CME initiation observed in four SOHO/EIT
band-passes, Geophys. Res. Abstr., vol. 6, 2004.
Zhukov, A. N.: Solar sources of geoeffective CMEs: a SOHO/EIT view, in: Coronal and Stellar Mass Ejections, edited by: Dere, K. P., Wang, J., and Yan, Y., Proceedings IAU Symposium 226, Cambridge University Press, pp. 437–447, 2005.