HAL Id: hal-00297586
https://hal.archives-ouvertes.fr/hal-00297586
Submitted on 14 Dec 2006
HAL is a multi-disciplinary open access
archive for the deposit and dissemination of
sci-entific research documents, whether they are
pub-lished or not. The documents may come from
teaching and research institutions in France or
abroad, or from public or private research centers.
L’archive ouverte pluridisciplinaire HAL, est
destinée au dépôt et à la diffusion de documents
scientifiques de niveau recherche, publiés ou non,
émanant des établissements d’enseignement et de
recherche français ou étrangers, des laboratoires
publics ou privés.
Sea
S. W. A. Naqvi, H. Naik, A. Pratihary, W. d’Souza, P. V. Narvekar, D. A.
Jayakumar, A. H. Devol, T. Yoshinari, T. Saino
To cite this version:
S. W. A. Naqvi, H. Naik, A. Pratihary, W. d’Souza, P. V. Narvekar, et al.. Coastal versus
open-ocean denitrification in the Arabian Sea. Biogeosciences, European Geosciences Union, 2006, 3 (4),
pp.621-633. �hal-00297586�
www.biogeosciences.net/3/621/2006/ © Author(s) 2006. This work is licensed under a Creative Commons License.
Biogeosciences
Coastal versus open-ocean denitrification in the Arabian Sea
S. W. A. Naqvi1, H. Naik1, A. Pratihary1, W. D’Souza1,*, P. V. Narvekar1, D. A. Jayakumar1,**, A. H. Devol2, T. Yoshinari3, and T. Saino41National Institute of Oceanography, Dona Paula, Goa 403 004, India
2School of Oceanography, University of Washington, Seattle, WA 98195, USA
3Wadsworth Center, New York State Department of Health, P.O. Box 509, Albany, New York 12201, USA
4Hydrospheric Atmospheric Research Center, Nagoya University, Furo-cho, Chikusa-ku, Nagoya, 464-8601, Japan *now at: National Centre for Antarctic and Ocean Research, Headland Sada, Vasco da Gama, Goa 403 804, India **now at: Department of Geosciences, Princeton University, Goyet Hall, Princeton, NJ 98544, USA
Received: 4 April 2006 – Published in Biogeosciences Discuss.: 19 June 2006
Revised: 27 November 2006 – Accepted: 4 December 2006 – Published: 14 December 2006
Abstract. The Arabian Sea contains one of the three major
open-ocean denitrification zones in the world. In addition, pelagic denitrification also occurs over the inner and mid-shelf off the west coast of India. The major differences be-tween the two environments are highlighted using the avail-able data. The perennial open-ocean system occupies two orders of magnitude larger volume than the seasonal coastal system, however, the latter offers more extreme conditions (greater nitrate consumption leading to complete anoxia). Unlike the open-ocean system, the coastal system seems to have undergone a change (i.e., it has intensified) over the past few decades presumably due to enhanced nutrient loading from land. The two systems also differ from each other with regard to the modes of nitrous oxide (N2O) production: In the open-ocean suboxic zone, an accumulation of secondary nitrite (NO−2) is invariably accompanied by depletion of N2O whereas in the coastal suboxic zone high NO−2 and very high N2O concentrations frequently co-occur, indicating, respec-tively, net consumption and net production of N2O by den-itrifiers. The extents of heavier isotope enrichment in the combined nitrate and nitrite (NO−3+NO−2) pool and in N2O in reducing waters appear to be considerably smaller in the coastal region, reflecting more varied sources/sinks and/or different isotopic fractionation factors.
1 Introduction
Being a polyvalent element, the speciation, transformations and fluxes of nitrogen in aquatic environments are greatly Correspondence to: S. W. A. Naqvi
(naqvi@nio.org)
affected by the ambient oxygen (O2)concentration. As sea-water is generally oxygenated, fixed nitrogen in the ocean largely ends up in the most oxidized (+5) state, viz. ni-trate ions (NO−3), and it is only in sediments and in parts of the water column in a few well-demarcated regions that dissolved O2 gets almost completely depleted to allow mi-crobial conversion of NO−3 to molecular nitrogen (N2); this process, denitrification, is the most important pathway of losses of fixed nitrogen, and thus a key player in the ni-trogen budget (Deuser, 1975; Hattori, 1983; Codispoti and Christensen, 1985). In the Atlantic and Pacific Oceans, such O2-deficient zones (ODZs) occur at mid-depths beneath the productive tropical eastern boundary upwelling zones. What distinguishes the Indian Ocean from the two other oceans is that the most intense ODZ here is located in the northern re-gion, especially in the Arabian Sea. This anomaly, like other distinguishing features of the Indian Ocean, arises from its unusual geography, i.e. mainly the presence of Asian land-mass that restricts its northern expanse to the tropics and, to a smaller extent, a porous eastern boundary (openings be-tween the Indonesian islands) which allows exchange of wa-ter with the Pacific Ocean at low latitudes. The resultant cir-culation is not conducive for the development of biologically productive upwelling centres off the coasts of Myanmar and Australia similar to those found off the west coasts of Africa and the Americas. Instead, the most intense upwelling and consequently the highest rates of primary production (PP) at the surface and associated remineralization at depth occur along the northwestern boundary of the Indian Ocean (the Somali and Arabian coasts). Moreover, despite some pro-duction of intermediate waters in the Persian Gulf and the Red Sea, subsurface water renewal in the Indian Ocean oc-curs largely through advection from the south. The waters
60 E 70 E 10 N 20 N 3204 3939 3201 TN039/18 CATS (
(a)
o o o o 0 500 1000 1500 200 150 100 50 0Distance from Oman coast (km)
(b)
NO3-( M)μ 0.5 μM NO2 -Pakistan India Goa D e p th (m)Fig. 1. (a) Geographical limits of the offshore suboxic zone as demarcated by the 0.5 µM NO−2 contour (redrawn from Naqvi, 1991). Also shown are the stations (marked by crosses) worked during the U.S. JGOFS cruise TN050 (August–September 1995), whose data have been used to construct the NO−3 section shown in (b), as well as some other stations (marked by circles) mentioned elsewhere in the paper. Isopleths in (b) and Figs. 2–4 were drawn using Surfer® for Windows version 8 by Golden Software, Inc.
derived from the Southern Hemisphere gradually lose O2and accumulate products of metabolism (CO2, nutrients) during their northward flow. Thus, a lower supply and an enhanced O2demand combine to produce very intense O2deficiency (Winkler O2<0.1 mL L−1; ∼4 µM) within a very wide depth range (∼100/150 to 1000 m) in the north, particularly in the Northwestern Indian Ocean (Wyrtki, 1971; Sen Gupta and Naqvi, 1984; Naqvi, 1987).
Due to the semi-enclosed nature of the North Indian Ocean, the OMZ impinges upon a very large area of the continental margin: bottom waters with O2<0.5 mL L−1 (22 µM) and <0.2 mL L−1 (9 µM), are estimated to cover about 1.15×10⁶ and 0.76×10⁶km2, respectively, of the marginal seafloor in the region, which amount to as much as 59 and 63%, of the corresponding global areas (Helly and Levin, 2004). Moreover, littoral countries of the North Indian Ocean approximately account for a quarter of the world’s human population, which in conjunction with the ongoing rapid economic growth makes the region’s coastal environ-ments experiencing O2-deficiency highly vulnerable to hu-man impact. Despite this vulnerability, most previous stud-ies on nitrogen transformations in suboxic waters focused on the open ocean (Bange et al., 2005 and references therein), and it is only in recent years that significance of coastal pro-cesses is increasingly being appreciated (Naqvi et al., 2000, 2006a). We describe here factors that differentiate the open-ocean and coastal suboxic zones making use of a variety of new and some published data.
2 Processes of formation of coastal and open-ocean sub-oxic1zones
As stated above, the most intense ODZ, as inferred from the occurrence of a secondary nitrite (NO−2)maximum (SNM), is located in the generally most productive northwestern part of the Indian Ocean. However, within the Arabian Sea it-self, suboxic conditions are not associated with the upwelling systems off Somalia and Arabia; instead, the SNM zone ex-tends toward the southwest into the central Arabian Sea from the northwestern Indian shelf, a region of relatively low PP (Fig. 1a; Naqvi, 1991). This is believed to arise from a more effective subsurface water renewal along the Arabian Sea’s western boundary through advection from the south (given that the cross-equatorial exchange of subsurface wa-ters is largely confined in the western Indian Ocean – Swal-low, 1984) as well as from the Red Sea and the Persian Gulf. Moreover, the dominance of upper-layer flow by meso-scale eddies, which account for the bulk of the kinetic energy (Flagg and Kim, 1998) and extend to the core of the suboxic zone, may facilitate greater downward diffusion of O2from the surface in the west. In contrast, the SNM coincides with the zone of the lowest kinetic energy and reduced vertical penetration of the eddy field (Kim et al., 2001). In addition to these physical factors, the availability and utilization of nutrients by phytoplankton and the subsequent vertical flux of organic matter must also contribute to the observed O2 1We consider “suboxic” to be synonymous with “denitrifying”,
operationally defined by the existence of the SNM. In the Arabian Sea, as in the eastern Pacific, the SNM is confined to the depth range where colorimetric O2is below ∼0.015 mL L−1(∼0.7 µM)
(Winkler O2<∼0.1 mL L−1(∼4 µM); Cline and Richards, 1972; Morrison et al., 1999).
distribution. Kim et al. (2001) opined that the route of off-shore transport of the nutrient-rich upwelled water (occurring predominantly through filaments and plumes) is such that the denitrification zone receives more nutrients/organic matter than the region located to its south and west. They empha-sized the importance of the Ras al Hadd Jet that transports upwelled water first along the northeast Omani coast and then away from the coast off the cape it has been named after. Nutrient distributions during the upwelling season (e.g. for NO−3; Fig. 1b) do indeed indicate long-distance (≥1000 km) transport of the upwelled water reaching well within the re-gion of the most intense O2 deficiency, but the generally-observed gradual offshore decrease in surface nutrient con-centration is not supportive of this view. Moreover, the sed-iment trap data clearly show that the flux of particulate or-ganic matter to the deep sea is higher in the western Arabian Sea than in the central and eastern Arabian Sea (Rixen et al., 2005).
Recent results of modeling (Wiggert et al., 2006) as well as observations (Naqvi et al., unpublished manuscript) sug-gest that, contrary to the prevalent belief, PP in the west-ern Arabian Sea might sometimes be limited by iron instead of nitrogen during the southwest (SW) monsoon. Aerosol analysis during the SW monsoon also revealed very low (be-low detection limit) concentrations of the labile-Fe(II) off the central Omani coast, presumably because the air masses dur-ing this season come from the pristine southern hemisphere (Sierfert et al., 1999). These results have important impli-cations for the composition of phytoplankton and the ver-tical scale of organic matter degradation. Iron deficiency has been known to cause an increase in ratio of Si:N up-take by diatoms (Hutchins and Bruland, 1998) facilitating greater offshore transport of NO−3. A more rapid depletion of silicate is expected to cause a shift in phytoplankton com-munity structure with increasing abundance of smaller au-totrophs offshore, which is in accordance with observations (Garrison et al., 1998). During the northeast (NE) monsoon the central Arabian Sea experiences convective mixing that penetrates, at the most, to a depth of 125 m (Banse, 1984, 1987). The depthwise nutrient distribution in the region is such that vertical mixing brings up substantial amounts of NO−3 to the euphotic zone but not much silicate, thereby lim-iting diatom productivity (Naqvi et al., 2002). Thus, PP in the open central Arabian Sea seems to be dominated by small, non-diatomaceous autotrophs during both the SW and NE monsoons. The organic matter produced by these organisms would be degraded at shallower depths relative to that pro-duced by diatoms. Therefore, one would expect the average depth of remineralization of material exported from the sur-face layer to shoal up with increasing distance from the coast, such that more material is degraded close to the core of the O2minimum zone in the offshore region. This is consistent with the observed O2distribution (Naqvi et al., unpublished manuscript).
It must, however, be pointed out that despite the absence of the SNM in the western Arabian Sea, high concentrations of elements that are more soluble in the reduced states (e.g. Fe and Mn) and of the reduced species (such as I−)can still oc-cur within the core of the O2minimum (Saager et al., 1989; Farrenkopf et al., 1997; Farrenkopf and Luther, 2002). Far-renkopf et al. (1997) and FarFar-renkopf and Luther (2002) as-cribed the elevated I−levels, at least in part, to heterotrophic iodate (IO−3)reduction and Bange et al. (2001) postulated that the associated thermodynamically-feasible oxidation of ammonium (NH+4)by IO−3 could produce N2O. N2O is prob-ably also formed through nitrifier denitrification in these wa-ters (Shailaja et al., 2006). However, it is unlikely that the production of N2and N2O through canonical denitrification is quantitatively very important outside the SNM zone.
The development of suboxic conditions over the Indian shelf is related in a general way to the prevalence of large-scale, mesopelagic, open-ocean O2 deficiency, because the latter is the source of water that upwells over the Indian shelf during the SW monsoon. Nevertheless, the open-ocean and coastal suboxic zones are not contiguous. This is due to the presence of the West India Undercurrent (WIUC) that flows northward while the surface flow is toward the south. The WIUC may be identified just off the continen-tal shelf/slope from the distribution of temperature (upward sloping of isotherms at the top of this feature and down-ward tilt close to its bottom; Fig. 2a), and even more clearly from those of salinity and O2 (Figs. 2b, c). Note that the water derived from the south has lower salinity and slightly higher O2 content. As judged by the 35 400 salinity con-tour, the influence of the undercurrent, at its peak, extends vertically down to approximately 400 m depth and horizon-tally up to 200 km from the continental slope at 15◦N
lati-tude (Fig. 2b). Even though seasonally variable, the WIUC is very important for determining the redox status of subsur-face waters since it is a source of O2to the otherwise suboxic mesopelagic zone that prevents the water from turning den-itrifying off the continental margin probably as far north as 17◦N latitude. Consequently, as reflected by the distribu-tion of NO−2 (Fig. 2d), denitrification intensifies away from the coast. This pattern is opposite to that observed in the two other major oceanic suboxic zones, especially off Peru-Chile, where the poleward undercurrents, in fact, support bulk of the denitrification (Codispoti et al., 1989). This difference probably owes to a lower respiration rate within the WIUC, which, in turn, may be caused by two factors. Firstly, un-like its counterpart off Peru-Chile the WIUC does not occur over the shelf but along the continental slope, and secondly, except in the most southern part, upwelling along the west coast of India is by and large confined to a narrow strip over the inner shelf such that surface waters directly overhead of the WIUC are not very productive. As the water upwells and moves shoreward, rapid increase in respiration depletes its already low O2 content, culminating in the seasonal devel-opment of reducing conditions (denitrification followed by
1000 900 800 700 600 500 400 300 200 100 0 D e p th (m) 1000 800 600 400 200 0
Distance from coast (km)
1000 900 800 700 600 500 400 300 200 100 0 D e p th (m) 1000 800 600 400 200 0
Distance from coast (km)
(a)
(b)
(c)
(d)
64 76 12 24 Temperature ( C)o Salinity Oxygen (μM) Nitrite (μM) 35.2 35.4 N D A I IFig. 2. Variations in (a) temperature, (b) salinity, (c) O2, and (d) NO−2 in the upper 1 km off Goa (see inset in (b) for station locations) during
1–6 December 1998. Modified from Naqvi et al. (2006a).
sulphate (SO2−4 )reduction) over the mid- and inner-shelf re-gions (e.g. Fig. 3) covering a wide latitudinal range (between at least 12 and 20◦N, probably extending further north to the Pakistani coast).
3 Seasonality of O2deficiency
The main difference between the open-ocean and coastal suboxic zones is that while the former is perennial, the lat-ter occurs only during and shortly aflat-ter the SW monsoon. The open-ocean suboxic zone is also influenced by mon-soonal changes, albeit to a smaller extent, that should be related to both the O2 supply and consumption within the ODZ. For example, surveys carried out during consecutive SW and NE monsoon seasons (1987 to 1988) led Naqvi et al. (1990) to suggest a more vigorous denitrification (inferred from higher NO−2 concentrations) during the latter season, a finding subsequently supported by the observations of de Sousa et al. (1996) made in 1996. Morrison et al. (1998, 1999) also found substantial variability in the depth profiles of NO−2 but without a clear seasonal trend within 100 to
600 m at stations occupied repeatedly during the U.S. JGOFS expedition in 1994–1995. In any case, the substantial short-term changes evident in these data sets imply that the inter-mediate waters in the Arabian Sea must be quickly renewed (Swallow, 1984; Naqvi, 1987; Somasundar and Naqvi, 1988; Naqvi and Shailaja, 1993).
The temporal evolution of suboxic conditions over the western Indian shelf is intimately linked to the seasonal re-versal of surface circulation. During the NE monsoon, the West India Coastal Current (WICC) carries warmer, fresher waters of equatorial origin toward the north. The low con-centrations of nutrients coupled with downwelling associated with this flow result in low productivity and relatively deep mixed layers so that the shelf waters are generally well oxy-genated. In contrast, circulation during the SW monsoon is characterized by an equatorward surface current, the above-mentioned poleward WIUC and coastal upwelling typical of oceanic eastern boundaries. However, upwelling along the Indian west coast is nowhere as vigorous as along the coasts of Somalia, Yemen and Oman in the western Arabian Sea. Moreover, due to the presence of a warm, low-salinity lens – formed through intense precipitation in the coastal zone –
150 100 50 Temperature (oC) 100 50 O2 ( M)
Distance from coast (km)
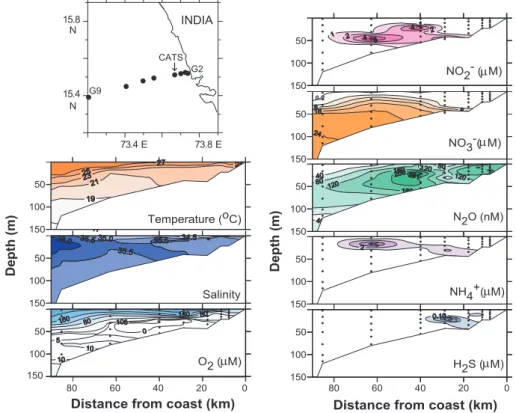
150 100 50 Salinity G2 CATS G9 μ 150 100 50 150 100 50 150 NO2- ( M) 150 100 50 NO3-( M) N2O (nM) 150 100 50 NH4+( M) 80 60 40 20 0
Distance from coast (km)
150 100 50 H2S ( M) 5 0.5 0.2 D e p th (m ) μ μ μ μ D e p th (m ) 80 60 40 20 0 73.4 E 73.8 E 15.4 15.8 INDIA k N N
Fig. 3. Vertical sections of temperature, salinity, O2, inorganic nitrogen species and hydrogen sulphide off Goa during 9 to 10 October 1999.
Station locations are shown in the accompanying map for this frequently-sampled, shallower part of the Goa transect also shown in Fig. 2. These data are hitherto unpublished.
the upwelled water rarely comes in contact with the atmo-sphere, and the resultant strong thermohaline stratification contributes to the sustenance of very severe O2-depletion very close (within few metres) to the sea surface. The O2 deficiency begins with the advent of upwelling sometime in April–May and intensifies gradually with time. Off Goa, where sufficient data exist due to quasi-time series monitor-ing of a station (the Candolim Time Series, CATS) over the inner shelf since 1997, near-bottom O2concentrations reach suboxic levels in August as evident by the accumulation of NO−2 and the depletion of NO−3 (Fig. 4). Complete loss of the oxidized nitrogen species is followed by the SO2−4 reduction in September–October. With the reversal of surface currents, oxic conditions are re-established in November–December. When the reducing conditions are at their peak in September– October, the cross-shelf sections north of about 12◦N lati-tude (e.g. Fig. 3) show the classical sequence of utilization of electron acceptors: O2 over and beyond the outer shelf, NO−3 over the mid-shelf and SO2−4 over the inner shelf. This is perhaps the only known region along an open coast where all three types of redox environments are found on the same shelf segment in such an organized manner.
4 Denitrification rates
Rates of water-column denitrification in the Arabian Sea have been determined recently by Devol et al. (2006a) through on-deck and in-situ incubations of water samples spiked with 15NO−3 and measuring the production of15 N-labelled N2. As expected, the rates for the offshore sub-oxic zone (8.8±3.8 nmol N L−1d−1; n=15) are lower than those for the shallower system (21.6±46.8 nmol N L−1d−1; n=15). Although the overall rate for the offshore suboxic zone (∼41 Tg N y−1)derived from these data is within the range (10 to 44 Tg N y−1) of previous estimates for deni-trification in the region based on stoichiometric calculations (Naqvi, 1987; Mantoura et al., 1993) and electron transport system (ETS) activity (Naqvi and Shailaja, 1993), it still suf-fers from considerable uncertainty for the following reasons. Firstly, recent research has demonstrated that, in addition to canonical denitrification, the anaerobic ammonium oxidation (anammox; the reaction of NH+4 with NO−2)is an important process of N2formation; in fact, in most of the cases exam-ined so far, the latter pathway has been found to be dom-inant (Kuypers et al., 2003, 2005; Thamdrup et al., 2006). Thus, incubations with15NO−3 alone might lead to an un-derestimation of N2production. Secondly, measurements of the N2/Ar ratio in seawater have yielded estimates of “ex-cess” N2that are up to twice the corresponding NO−3 deficits
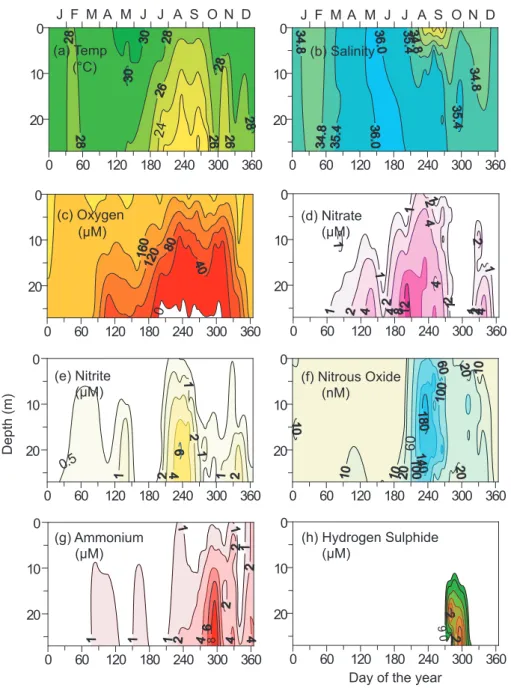
0 60 120 180 240 300 360 20 10 0 0 60 120 180 240 300 360 20 10 0 0 0 60 120 180 240 300 360 20 10 0 0 60 120 180 240 300 360 20 10 0 0.5 0 60 120 180 240 300 360 20 10 0 0 60 120 180 240 300 360 20 10 0 0 60 120 180 240 300 360 20 10 0 J F M A M J J A S O N D J F M A M J J A S O N D 0 .6 8 D e p th (m)
Day of the year
0 60 120 180 240 300 360 20 10 0 60 24 (a) Temp (°C) (b) Salinity (c) Oxygen (μM) (d) Nitrate(μM) (μM) (e) Nitrite (μM) (g) Ammonium (μM) (h) Hydrogen Sulphide (nM) (f) Nitrous Oxide
Fig. 4. Monthly-/fortnightly-averaged records showing annual cycle of (a) temperature, (b) salinity, (c) oxygen, (d–g) inorganic nitrogen
species, and (h) hydrogen sulphide at the Candolim Time Series (CATS) site (15◦31′N, 73◦39′E; Fig. 3) based on observations from 1997 to 2004. Modified from Naqvi et al. (2006a).
(the deficiency in NO−3 with reference to the concentration expected from the Redfield stoichiometry; Codispoti et al., 2001; Devol et al., 2006a, b; Fig. 5). Although it is possible that sedimentary denitrification contributes to some extent to the observed N2excess, the two potentially more important processes causing the discrepancy are anammox and min-eralization within the OMZ of organic matter produced by nitrogen fixers that has non-Redfieldian elemental composi-tion (N:P≫16) (Codispoti et al., 2001; Devol et al., 2006a, b; Codispoti, 2006). It would thus appear that the current estimates for N2production in the open-ocean suboxic zone
should be conservative. This is probably also true, perhaps even more so, for estimates from the coastal suboxic zone. The upwelled water has a NO−3 content in excess of 20 µM, and it takes about a month for the NO−3 to be completely lost after the onset of denitrification, indicating that the ac-tual NO−3 consumption rate should be far in excess of that measured by the15NO−3 incubation method. Repeat observa-tions at several sites over the inner shelf off the central west coast of India suggested an average NO−3 consumption rate of 0.83 µmol L−1d−1, and applying this rate to an estimated
volume of 1.2 to 3.6×10¹²m3yields an overall loss of 1.3 to 3.8 Tg N y−1(Naik, 20032). This is only 3 to 9% of the denitrification rate estimated for the perennial suboxic zone of the open Arabian Sea.
It is very likely that even the relatively modest rate over the Indian shelf has been anthropogenically enhanced over the past few decades. Sulphate (SO2−4 )reduction has been found to recur every year at the CATS site ever since the monitoring began in 1997. The data show substantial intra-seasonal as well as inter-annual variations, the latter with-out a clear secular trend. However, there is no indication of occurrence of this process in the historical data sets from anywhere along the Indian west coast. For example, an ex-tensive set of hydrocast data for salinity, temperature and O2along numerous cross-shelf sections was generated un-der the UNDP/FAO-sponsored Integrated Fisheries Project (IFP) during 1971–1975 covering different seasons. In the region off Karwar (just south of Goa), a comparison of the O2data from these cruises with those generated by us from 1997 to 2004 shows a significant decrease in near-bottom O2 over the inner- and mid-shelf (depth <60 m) for the period August–October (Naqvi et al., 2006a). Even though hydro-gen sulphide (H2S) was not measured on the IFP cruises, the absence of zero Winkler oxygens in the IFP data set indi-cates that it was probably not present. Other data taken sub-sequently also suggest that the subsurface environment was denitrifying, but not SO2−4 reducing, at least until the 1980s (Naqvi et al., 2000). Thus, the subsurface O2deficiency over the Indian shelf seems to have intensified significantly since the 1970s. Although the cause of this change cannot be pin-pointed with absolute certainty, it is most likely related to an increased nitrogen loading from land (Naqvi et al., 2000). Indeed, fertilizer consumption in the region has undergone an order of magnitude increase over the past few decades, and this is expected to have affected river runoff. However, the available data suggest a modest riverine flux (0.1 Tg N y−1) of dissolved inorganic nitrogen (DIN) to the Arabian Sea (Naqvi et al., 2006b). The deposition rate from the at-mosphere is perhaps relatively more important. Bange et al. (2000) estimated a total DIN deposition of ∼1.6 Tg y−1 for the region north of 6◦N latitude, and although this is based on observations offshore, the flux density is expected to be higher over the Indian shelf. It would be reasonable to assume that most of the aeolian and riverine inputs are of anthropogenic origin, which could account for a significant fraction of denitrification rate over the shelf estimated above, and the shift from natural suboxic to anthropogenic anoxic conditions. This is because the stoichiometries of primary production (C:N=6.6) and denitrification (C:N=1.1) are such that new inputs of DIN into suboxic waters get amplified by 2Naik, H.: Benthic nitrogen cycling with special reference to
nitrous oxide in the coastal and continental shelf environments of the eastern Arabian Sea, Ph.D. thesis, Goa University, unpublished, 147 pp., 2003.
-10 0 10 20 30 NO3 Def., Excess N2 ( g-at/l)
10 0 -10 -20 -30 N* ( M) 0 1 2 3 NO2 ( M) 0 20 40 60 80 N2O (nM) 0 10 20 30 40 NO3 ( M) 3000 2000 1000 0 0 O2 ( M)100 200 (a) (b) (c) μ μ μ μ μ D e p th (m )
Fig. 5. Vertical profiles of properties at 19◦N, 67◦E (all data ex-cept for N2/Ar collected on TN039 cruise of U.S. JGOFS (Sta. 18;
Fig. 1) on 1–2 October 1994). (a) O2(circles) and NO−3
(trian-gles); (b) N2O (circles) and NO−2 (triangles); (c) NO−3 deficit
ac-cording to Codispoti et al. (2001) (dots connected by the solid line), N* according to Gruber and Sarmiento (2002) (small filled trian-gles connected by the dashed line), and “excess N2” calculated from the N2/Ar ratio (larger unconnected symbols – crosses for
data collected on two different cruises from this station and triangles for those from other stations also located within the denitrification zone). N2/Ar data are from Devol et al. (2006a).
a factor of up to 6 (Codispoti et al., 2001). That is, for each unit of DIN added to the surface waters up to 6 units of NO−3 can be removed at depth if the additional organic matter pro-duced is oxidized by NO−3, thereby making subsurface deni-trification very sensitive to the external DIN loading.
5 Nitrous oxide cycling
The distribution pattern of N2O in the water column in the open Arabian Sea is similar to that observed in other ar-eas containing intense ODZs: Within the denitrifying zone N2O concentrations are invariably below ∼10 nM with peak values exceeding 40 nM occurring at the oxic-suboxic inter-faces; outside the denitrification zone a single broad N2O maximum is associated with the O2 minimum (Law and Owens, 1990; Naqvi and Noronha, 1991; Bange et al., 2001, 2005). The N2O minimum associated with the SNM can only result from the conversion of N2O to N2by denitrifiers; in contrast, there are several possible pathways – nitrification, denitrification and a coupling between the two processes – that can produce the greatly elevated N2O concentrations at the peripheries of the SNM zone. The natural isotope abun-dance of nitrogen and oxygen provide a measure of the rela-tive importance of these various possibilities. These data re-veal minima in both δ15N and δ18O3that are coincident with
3Nitrogen and oxygen isotope ratios of N
2O throughout this
pa-per are expressed as pa-per mil deviations from atmospheric N2and O2, respectively. In the case of oxygen the values against air can
δ18O δ15N 0 200 400 600 800 1000 1200 1400 1600 0 10 20 30 40 50 60 δ15N, δ18O(N 2O) 0 75 150 225 O2 (μM) (b) (c) (d) (a) 0 1 2 3 NO2 (μM) (e) 0 30 60 90 N2O (nM) 5 10 15 20 δ15N (NO 3) δ N o f tro p o sp h e ri c N O δ O o f tro p o sp h e ri c N O 1 5 2 1 8 2 D e p th (m )
Fig. 6. Vertical profiles of δ15N and δ18O (‰ relative to air; see footnote #3) of N2O (a), δ15N of NO−3 (b), and concentrations of N2O
(c), NO−2 (d) and O2(e) at stations SS 3201 (17◦N, 68◦E; filled circles, joined by dotted lines) and SS 3204 (19.75◦N, 64.62◦E; filled
triangles, joined by continuous lines). The shaded region represents the secondary NO−2 maximum at SS 3201. Vertical lines give δ15N and
δ18O of tropospheric N2O. Station locations shown in Fig. 1. After Naqvi et al. (1998a).
the upper N2O concentration peak (Fig. 6). Such minima, also reported from the Pacific Ocean, are consistent with the nitrification being the major production pathway (Dore et al., 1998). Incidentally, this is the only level where the dissolved N2O is isotopically lighter, both for nitrogen and oxygen, than the tropospheric N2O. The values are understandably heavy – indeed the heaviest reported yet from any oceanic setting - within the SNM zone due to fractionation associated with denitrification (i.e., lighter N2O is preferentially utilized by denitrifiers). Intriguingly, the δ15N values for N2O exceed those for NO−34, going against the trend exhibited by cultures of Paracoccus denitrificans grown under steady-state condi-tions (Barford et al., 1999), which suggested greater fraction-ation during the reduction of NO−3 to N2O (∼16‰) than of N2O to N2(∼13‰). The higher δ15N of N2O seems to im-ply that the natural bacterial populations should have a larger isotopic effect for the final reduction sequence. Moreover, as this trend persists also in the N2O-rich waters below the SNM (Fig. 6), it necessitates the involvement of denitrifica-tion at least in channeling the lighter nitrogen isotope to N2, if not in N2O production, well outside the SNM. Based on the analysis of N2O isotopomer ratios (site preference of15N in the linear N2O molecule), Yamagishi et al. (2005) also identified denitrification to be the dominant process respon-sible for N2O production in the O2 minimum zone of the North Pacific. However, since nitrification and denitrifica-tion involve common intermediates and occur in close prox-imity of each other in O2-depleted waters, both in the spatial and temporal domains, the exchange of these intermediates
be converted to the more commonly used SMOW (standard mean ocean water) scale utilizing the equation (Kim and Craig, 1990):
δ18OAIR=−23.0+δ18OSMOW/1.0235
4Analysis of isotopic composition of nitrate generally involves
its chemical reduction to NH+4, during which process nitrite, if present, is also similarly reduced. The data being reported here, as in all previous studies, thus pertain to the combined NO−3 and NO−2 pool, but will still be denoted by δ15N of NO−3 for conve-nience hereafter.
(nitrification-denitrification coupling) are expected to greatly affect the isotopic composition of N2O.
The coastal suboxic zone in the Arabian Sea is distin-guished by much higher concentrations of N2O (reaching up to ∼0.8 µM) as compared to the open ocean. The highest val-ues are unexpectedly associated with very high NO−2 (reach-ing up to 16 µM) and low (near exhaustion) NO−3 levels of-ten at mid-depths. This trend, observed in most cross-shelf sections (e.g. Fig. 3), has also been recurring at the CATS site (Fig. 4) where peak N2O values invariably coincide with rapidly declining NO−3 and the build-up of NO−2. The N2O concentrations decrease rapidly as the system turns sulphate reducing. This indicates that the observed high concentra-tions cannot be due to inhibition of N2O reductase activity by H2S (Senga et al., 2006). The oxygen concentrations are too low for nitrification to occur in these waters, leaving denitrification as the principal pathway of N2O production. These results are completely different from those from the open ocean SNM (Fig. 6). Incubations of water samples col-lected from the Indian shelf, that were O2-poor but not den-itrifying to begin with, revealed transient N2O accumulation at micromolar levels once the system turned reducing, and it was hypothesized that frequent aeration due to turbulence in shallow, rapidly-denitrifying systems might suppress the activity of N2O-reductase leading to a large fraction of nitro-gen undergoing bacterial reduction ending up as N2O (Naqvi et al., 2000). Because such production occurs within a few metres of the sea surface, the observed surface N2O concen-trations (5 to 436 nM, mean 37.3 nM, n=241) and the com-puted emission to the atmosphere (0.05 to 0.38 Tg N2O y−1) are unusually high (Naqvi et al., 2006a).
In spite of the more extreme redox conditions prevailing in the coastal suboxic zone, the ranges of isotopic values for N2O are relatively narrow (−2 to 13‰ for δ15N and 17 to 60‰ for δ18O) over the shelf as compared to the open ocean (3 to 81‰ for δ15N and 17 to 95‰ for δ18O) (Yoshi-nari et al., 1997; Naqvi et al., 1998a, b). This is exemplified by data from a typical coastal site presented in Fig. 7. The
isothermal, isohaline sub-pycnocline waters at this site had lost most of the oxidized nitrogen (especially in the deepest sample where the loss was almost complete). However, de-spite large vertical gradient in N2O concentration (decrease from the pronounced maximum from the top of the sub-oxic zone to near-zero concentration close to the sea floor), the δ15N and δ18O values did not vary greatly. While, the aforementioned exchange of intermediates between nitrifi-cation and denitrifinitrifi-cation, which is expected to occur to a much larger degree in the more spatially and temporally vari-able coastal environment, makes the interpretation of iso-topic data from the coastal region less straightforward with regard to the pathways of N2O cycling, it is quite likely that the observed differences arise from a different fractionation pattern from that observed in the open ocean suboxic zone, as in the case of NO−3, as we shall see in the following section.
6 Nitrogen isotopic fractionation during denitrification
Water column distributions of δ15N in NO−3 and N2 in the open Arabian Sea exhibit large changes brought about by the microbial consumption/production of these species (Brandes et al., 1998; Naqvi et al., 1998a, b; Altabet et al., 1999). Denitrification has been known to involve pronounced mass-dependent fractionation (preferential reduction of 14NO−3 over 15NO−3) in seawater (Cline and Kaplan, 1975), lead-ing to an enrichment of15N in the NO−3 pool and its deple-tion in the N2pool. In the central Arabian Sea, the δ15N of NO−3 increases from ∼6‰ in deep waters (2500 to 3000 m), comparable with values from other areas (Wu et al., 1997; Sigman et al., 1997), to 15 to 18‰ within the core of the denitrifying layer (Fig. 6; Brandes et al., 1998; Altabet et al., 1999); the δ15N of N2concurrently decreases from ∼0.6‰ to ∼0.2‰ (Brandes et al., 1998). Brandes et al. combined their isotopic data with NO−3 deficits (computed from the re-lationship between the tracer “NO” with potential tempera-ture) and used advection-reaction (Rayleigh distillation) and diffusion-reaction models to compute the isotope fractiona-tion factor (ε) of 22‰ and 25‰, respectively. Altabet et al. (1999) obtained a somewhat higher (∼30‰), value for ε using −N* (cf. Gruber and Sarmiento, 1997) and Rayleigh fractionation. The estimates of ε are about the same for the suboxic zones of the Arabian Sea and the eastern tropical North Pacific (Brandes et al., 1998; Altabet et al., 1999), implying relative constancy of isotopic fractionation in the open ocean. These estimates are also well within the range of those obtained earlier through laboratory cultures of het-erotrophic denitrifiers (ε=17 to 29‰; Delwiche and Steyn, 1970; Mariotti et al., 1981; Barford et al., 1999). One impor-tant implication of these results is that for anammox to be a major producer of N2in the open ocean, its effect on isotopic composition of NO−3, about which not much is known at present, should not be too different from that of heterotrophic denitrification. δ18O δ15N T S O2 NO2 NO3 N2O 18O 15N 22 24 26 30 20 10 0 30 32 34 0 100 200 0 2 4 32 36 40 44 48 10 15 0 250 500 δ δ D e p th (m)
Temperature (ºC) Oxygen (μM) δ O, δ N (per mil vs air)18 15
Salinity Nitrate, Nitrite (μM) Nitrous oxide (nM)
Fig. 7. Vertical profiles of temperature, salinity, dissolved O2,
in-organic nitrogen species and δ15N and δ18O of N2O at Sta. SK 137/39 (9.950◦N; 76.017◦E; Fig. 1) sampled on 8 August 1998. These data are hitherto unpublished.
The isotopic distribution pattern observed in the coastal suboxic zone is quite different, and more variable, from that described above, even though the data are rather limited. These data come from two sets of observations – in August 1997 off Mangalore (Sta. SS 3939; isotopic analysis car-ried out following Brandes et al., 1998) and in September 2000 off Goa (Stas. G3, G4 and G5; isotopic analysis car-ried out following Tanaka and Saino, 2002). On both occa-sions the water column had experienced significant losses of NO−3. Hydrographic and chemical data at Sta. SS 3939 along with the δ15N-NO−3 values are plotted against depth in Fig. 8. Temperatures and salinity profiles are typical of this region for the survey period, showing strong near-surface thermo-haline stratification and isothermal and isothermo-haline conditions below the shallow pycnocline. Similarly, the two deepest samples experienced near-complete O2depletion that is char-acteristic of the sampling period. The NO−3 profile exhib-ited a mid-depth maximum below which concentrations de-creased while the NO−2 concentrations showed a concomi-tant increase with depth. NO−3 deficit was calculated as the difference between the expected and observed NO−3 concen-trations (the former was approximately quantified by divid-ing the apparent oxygen utilization (AOU) with 8.65, the ratio between O2 consumption and NO−3 regeneration for aerobic respiration; Richards, 1965). This deficit increased with depth reaching the peak value of just under 15 µM in the deepest sample. While all the above parameters exhib-ited expected depthwise changes, the profile of δ15N-NO−3 deviated greatly from the one expected in a closed system where Rayleigh distillation may be assumed to apply. That is, given the high NO−3 deficit in subsurface waters, the δ15 N-NO−3 values should have ranged between 17 and 26‰ if the
24 26 28 Temperature (˚C) 30 20 10 0 34 34 35 35 36 36 Salinity 0 40 80 120 Oxygen (µM) 22 23 24 25 Sigma-t 0 1 2 3 4 5 Nitrite (µM) 0 5 10 15 Nitrate (µM) 6 8 10 12 14 16 Nitrate deficit (µM) 30 20 10 0 0 100 200 300 Nitrous oxide (nM) 0 10 20 30 δ N(nitrate, ‰ vs air) Temperature Salinity O2 Sigma-t NO3 NO2 N2O Observed Expected Ocean Avg Dept h (m) Dept h (m) ΔN (a) (b) (c) (d) (e) 15
Fig. 8. Vertical profiles of temperature, salinity, density, dissolved O2, inorganic nitrogen species and δ15N of NO−3 (observed as well as
expected from the computed NO−3 deficits and the reported fractionation factor for the open ocean) at Sta. SS 3939 (13.126◦N; 74.631◦E; Fig. 1) sampled on 30 August 1997. These data are hitherto unpublished.
-2.5
-2.0
-1.5
-1.0
-0.5
0.0
0
5
10
15
20
25
Y = -7.70 X + 6.36r = 0.91
2 Y = -7.21 X + 3.32 r 2 = 0.44ln
f
NO3-δ
N
-N
O
15 3 −Fig. 9. δ15N of NO−3 versus natural log of fraction of the original NO−3 remaining for samples from Sta. SS 3939 (open circles) and Stas. G3–G5 (filled circles). The two regression lines with slopes of −7.70 and −7.21 are for data from Stas. G3–G5 only and those from all stations, respectively. Station locations are shown in Fig. 1. These data are hitherto unpublished.
isotopic fractionation factor reported for the open ocean oxic zone (∼25‰) was also applicable to the shallow
sub-oxic zone. The values measured were consistently lower. In fact, all the four samples taken from within or below the pyc-nocline yielded δ15N-NO−3 values (6.65 to 7.41‰) that were quite close to the oceanic average with no depthwise vari-ability. NO−3 in the only sample taken from the surface layer was distinctly lighter (3.43‰).
Several possibilities could be invoked to explain the above observations: (1) Processes responsible for the observed NO−3 losses in the coastal suboxic zone may be different from those in its open ocean counterpart. A likely scenario is that a substantial fraction of the loss may occur within the sediments, and the much smaller isotopic fractionation as-sociated with sedimentary denitrification (Brandes and De-vol, 2002) could then account for the low δ15N-NO−3 val-ues. The few data on sedimentary denitrification, measured mostly during the upwelling period following the acetylene block technique, have yielded values ranging from 0.23 to 1.25 mmol NO−3 m−2d−1, which are generally within the range of values from other areas (Naik and Naqvi, 2002). Estimates based on the isotope pairing method are compa-rable with these values (Naqvi et al., 2006c5). These rates by themselves appear to be inadequate to account for the observed NO−3 loss in the water column. The other pro-cesses that may bring about NO−3 removal are anammox, 5Naqvi, S. W. A., Naik, H., Lavik, G., and Kuypers, M. M. M.:
Sedimentary denitrification rates over the western Indian continen-tal shelf, in preparation, 2006c.
dissimilatory reduction of NO−3 to NH+4 (which may also be coupled to anammox) and/or autotrophic denitrification (e.g. reduction of NO−3 by species such as S2−/HS−, Fe2+ and Mn2+; Luther et al., 1997). Of these at least anammox is ex-pected to be quite important in view of the above-mentioned results from other regions, more so over the Indian shelf where very high NO−2 concentrations (maximum 16 µM) are expected to be matched by a high rate of diffusive supply of NH+4 from the sediments (Naqvi et al., 2000). (2) Apparently low δ15N-NO−
3 relative to the NO −
3 deficit could be produced by mixing of waters. In order to illustrate this possibility the following hypothetical scenario may be considered: A parcel of water is subjected to complete denitrification, thereby re-sulting in the removal of both15NO−3 and14NO−3, followed by rapid 1:1 mixing with the freshly-upwelled water having a NO−3 content and δ15N of, say, 24 µM and 7‰, respectively. The resultant mixture would possess the isotopic character-istics of the upwelled water (δ15N=7‰), but it would show a NO−3 deficit of 12 µM. Alternatively, continuous mixing (the open system behaviour) could also result in an underestima-tion of the fracunderestima-tionaunderestima-tion factor. (3) It has been found recently that the reduction of NO−3 to NO−2 involves huge isotopic dis-crimination, such that δ15N of NO−
2 in the suboxic zone of the eastern tropical North Pacific is quite low (K. Casciotti, personal communication). As pointed out, the procedures followed by us actually yields the isotopic composition of NO−3 plus NO−2, and so the measured values would be depen-dent on the ratio between concentrations of the two species. The NO−2: NO−3 ratio is generally much higher in the coastal zone than in the open ocean, and that could contribute to lower δ15N of the combined NO−3 and NO−2 pool. (4) Finally, it is also possible that if and when the NO−3 loss is through heterotrophic denitrification, the fractionation factor associ-ated with the process may not be the same in the coastal and offshore regions. There is some experimental evidence sug-gesting that the degree of isotopic discrimination may indeed vary with denitrification rate (K.-K. Liu, personal communi-cation).
Unlike the above-mentioned observations off Mangalore, isotopic data off Goa do reveal substantial enrichment of the heavier isotope in residual NO−3 (Fig. 9). For these sam-ples the fractionation factor was computed using a simple advection-reaction model that ignores mixing. As the sam-pling sites were located very close to each other along a coast-perpendicular transect, and the NO−3 loss occurred in the upwelled water as it ascended over the shelf, this assump-tion seems justifiable. The isotopic distribuassump-tion could thus be modelled with a simple Rayleigh equation (Bender, 1990):
δ15N−NO3=103(α−1) logefNO3+(δ15N−NO3)init where fNO3 is the ratio between the observed and expected NO−3+NO−2 concentrations, the latter equaling AOU/8.65, and (δ15N-NO3)initgives the isotopic composition of the ini-tial (unaltered) material.
The plot of δ15N-NO3versus logefNO3(Fig. 9) indicates a good linear correlation (r2=0.91) with the slope of the re-gression line (value for εdenit) being −7.70. Inclusion of data from Sta. SS 3939 leads to a little change in the slope (−7.21), but the correlation is deteriorated (r2=0.44). At the first glance these results appear to support the notion of lower fractionation factor in the coastal suboxic zone. However, as discussed above, the possibility of other factors being also re-sponsible for pulling down the δ15N value of NO−3 of coastal waters cannot be ruled out. In fact, it is quite likely that all the factors mentioned above may be in operation, their relative importance varying in space and time. Such a dynamic en-vironment which contrasts the relatively more stable condi-tions of the open ocean system offers both challenges and op-portunities to gain further insights into pathways of oceanic nitrogen cycling.
Acknowledgements. The authors wish to thank their colleagues
especially M. D. George, M. D. Kumar, V. V. S. S. Sarma, M. S. Shailaja, D. M. Shenoy and H. S. Dalvi for their contributions to the generation of some of the data presented in this article. Financial support for the establishment of CATS came from the Department of Ocean Development, New Delhi, which is now being sustained under a CSIR Network Project CMM0009. The paper has been substantially benefited by thorough reviews by H. Bange, M. Voss and an anonymous referee.
Edited by: J. Middelburg
References
Altabet, M. A., Murray, D. W., and Prell, W. L.: Climatically linked oscillations in Arabian Sea denitrification over the past 1 m.y.: Implications for the marine N cycle, Paleoceanography, 14, 732– 743, 1999.
Bange, H., Naqvi, S. W. A., and Codispoti, L. A.: The nitrogen cycle in the Arabian Sea, Progr. Oceanogr., 65, 145–168, 2005. Bange, H. W., Rapsomanikis, S., and Andreae, M. O.: Nitrous oxide
cycling in the Arabian Sea, J. Geophys. Res., 106, 1053–1065, 2001.
Bange, H. W., Rixen, T., Johansen, A. M., Siefert, R. L., Ramesh, R., Ittekkot, V., Hoffmann, M. R., and Andreae, M. O.: A re-vised nitrogen budget for the Arabian Sea, Global Biogeochem. Cycles, 14, 1283–1297, 2000.
Banse, K.: Overview of the hydrography and associated biological phenomena in the Arabian Sea off Pakistan, in: Marine Geology and Oceanography of Arabian Sea and Coastal Pakistan, edited by: Huq, B. U. and Milliman, J. D., Van Nostrand Rheinhold, New York, 271–304, 1984.
Banse, K.: Seasonality of phytoplankton chlorophyll in the central and northern Arabian Sea, Deep-Sea Res., 34, 713–723, 1987. Barford, C. C., Montoya, J. P., Altabet, M. A., and Mitchell, R.:
Steady-state nitrogen isotope effects of N2and N2O production
in Paracoccus denitrificans, Appl. Environ. Microbiol., 65, 989– 994, 1999.
Bender, M. L.: The delta18O of dissolved O2in seawater: A unique
tracer of circulation and respiration in the deep sea, J. Geophys. Res., 95, 22 243–22 252, 1990.
Brandes, J. A. and Devol, A. H.: A global marine-fixed nitrogen iso-topic budget: Implications for Holocene nitrogen cycling, Global Biogeochem. Cycles, 16, 1120, doi:10.1029/2001GB001856, 2002.
Brandes, J. A., Devol, A. H., Yoshinari, T., Jayakumar, A., and Naqvi, S. W. A.: Isotopic composition of nitrate in the cen-tral Arabian Sea and eastern tropical North Pacific: A tracer for mixing and nitrogen cycles, Limnol. Oceanogr., 43, 1680–1689, 1998.
Cline, J. D. and Richards, F. A.: Oxygen deficient conditions and ni-trate reduction in the eastern tropical North Pacific Ocean, Lim-nol. Oceanogr., 17, 885–900, 1972.
Cline, J. D. and Kaplan, I. R.: Isotopic composition of dissolved nitrate during denitrification in the eastern tropical North Pacific Ocean, Mar. Chem., 3, 271–299, 1975.
Codispoti, L. A.: An oceanic fixed nitrogen sink exceeding 400 Tg N a−1vs the concept of homeostasis in the fixed-nitrogen inven-tory, Biogeosciences Discuss., 3, 1203–1246, 2006,
http://www.biogeosciences-discuss.net/3/1203/2006/.
Codispoti, L. A. and Christensen, J. P.: Nitrification, denitrification and nitrous oxide cycling in the eastern tropical South Pacific Ocean, Mar. Chem., 16, 277–300, 1985.
Codispoti, L. A., Barber, R. T., and Friederich, G. E.: Do nitro-gen transformations in the poleward undercurrent off Peru and Chile have a globally significant influence?, in: Poleward Flows on Eastern Boundaries, edted by: Neshyba, J., Mooers, C., and Barber, R., Springer-Verlag, New York, 281–310, 1989. Codispoti, L. A., Brandes, J. A., Christensen, J. P., Devol, A. H.,
Naqvi, S. W. A., Paerl, H. W., and Yoshinari, T.: The oceanic fixed nitrogen and nitrous oxide budgets: Moving targets as we enter the anthropocene?, Sci. Mar., 65, 85–105, 2001.
de Sousa, S. N., Kumar, M. D., Sardesai, S., Sarma, V. V. S. S., and Shirodkar, P. V.: Seasonal variability in oxygen and nutrients in the central and eastern Arabian Sea, Curr. Sci., 71, 847–851, 1996.
Deuser, W. G.: Reducing environments, in: Chemical Oceanogra-phy, vol. 3, edited by: Riley, J. P. and Skirrow, G., Academic Press, 1–37, 1975.
Delwiche, C. C. and Steyn, P. L.: Nitrogen isotope fractionation in soils and microbial reactions, Environ. Sci. Technol., 4, 929–935, 1970.
Devol, A. H., Uhlenhopp, A. G., Naqvi, S. W. A., Brandes, J. A., Jayakumar, A., Naik, H., Gaurin, S., Codispoti, L. A., and Yoshi-nari, T.: Denitrification rates and excess nitrogen gas concentra-tions in the Arabian Sea oxygen deficient zone, Deep-Sea Res. I, 53, 1533–1547, 2006a.
Devol, A. H., Naqvi, S. W. A., and Codispoti, L. A.: Nitrogen cycling in the suboxic waters of the Arabian Sea, in: Past and Present Water Column Anoxia. NATO Science Series, IV. Earth and Environmental Sciences – Vol. 64, edited by: Neretin, L., Springer, 283–310, 2006b.
Dore, J. E., Popp, B. N., Karl, D. M., and Sasone, F. J.: A large source of atmospheric nitrous oxide from subtropical North Pa-cific surface waters, Nature, 396, 63–66, 1998.
Farrenkopf, A. and Luther III, G. W.: Iodine chemistry reflects pro-ductivity and denitrification in the Arabian Sea: evidence for flux of dissolved species from sediments of western India into the OMZ, Deep-Sea Res. II, 49, 2303–2318, 2002.
Farrenkopf, A., Luther III, G. W., Truesdale, V. W., and van der
Weijden, C. H.: Sub-surface iodide maxima: evidence for. bi-ologically catalysed redox cycling in in the Arabian Sea OMZ during the SW intermonsoon, Deep-Sea Res. II, 44, 1391–1409, 1997.
Flagg, C. N. and Kim, H. -S.: Upper ocean currents in the northern Arabian Sea from shipboard ADCP measurements collected dur-ing the 1994–1996 U.S. JGOFS and ONR programs, Deep-Sea Res. II, 45, 1917–1959, 1998.
Garrison, D. L., Gowing, M. M., and Hughes, M. P.: Nano- and microplankton in the northern Arabian Sea during the southwest monsoon, August–September 1995: a US JGOFS study, Deep-Sea Res. II, 45, 2269–2299, 1998.
Gruber, N. and Sarmiento, J. L.: Global patterns of marine nitro-gen fixation and denitrification, Global Biogeochem. Cycles, 11, 235–266, 1997.
Gruber, N. and Sarmiento, J. L.: Biogeochemical/physical interac-tions in elemental cycles, in: The Sea, Vol. 12, edited by: Robin-son, A. R., McCarthy, J. J., and Rothschild, B. J., John Wiley & Sons, New York, 337–399, 2002.
Helly, J. J. and Levin, L. A.: Global distribution of naturally oc-curring marine hypoxia on continental margins, Deep-Sea Res. I, 51, 1159–1168, 2004.
Hattori, A.: Denitrification and dissimilatory nitrate reduction, in: Nitrogen in the Marine Environment, edited by: Carpenter, E. J. and Capone, D., Academic Press, New York, 191–232, 1983. Hutchins, D. A. and Bruland, K. W.: Iron-limited diatom growth
and Si:N uptake ratios in a coastal upwelling regime, Nature, 393, 561–564, 1998.
Kim, K. -R. and Craig, H.: Two isotope characterization of N2O
in the Pacific Ocean and constraints on its origin in deep water, Nature, 347, 58–61, 1990.
Kim, H.-S., Flagg, C. N., and Howden, S. D.: Northern Arabian Sea variability from TOPEX/Poseidon altimetry data: An extension of the US JGOFS shipboard ADCP study, Deep-Sea Res. II, 48, 1069–1096, 2001.
Kuypers, M. M. M., Sliekers, A. O., Lavik, G., Schmid, M., Jørgensen, B. B., Kuenen, J. G., Sinninghe Damste, J. S., Strous, M., and Jetten, M. S. M.: Anaerobic ammonium oxidation by anammox bacteria in the Black Sea, Nature, 422, 608–611 , 2003 Kuypers, M. M. M., Lavik, G., W¨obken, D., Schmid, M., Fuchs, B. M., Amann, R., Jørgensen, B. B., and Jetten, M. S. M.: Massive nitrogen loss from the Benguela upwelling system through anaer-obic ammonium oxidation, Proc. Nat. Acad. Sci., 102, 6478– 6483, 2005.
Law, C. S. and Owens, N. J. P.: Significant flux of atmospheric ni-trous oxide from the northwest Indian Ocean, Nature, 346, 826– 828, 1990.
Luther III, G. W., Sundby, B., Lewis, B. L., Brendel, P. J., and Sil-verberg, N.: Interactions of manganese with the nitrogen cycle: Alternative pathways to dinitrogen, Geochim. Cosmochim. Acta, 61, 4043–4052, 1997.
Mantoura, R. F. C., Law, C. S., Owens, N. J. P., Burkill, P. H., Woodward, E. M. S., Howland, R. J. M., and Llewellyn, C. A.: Nitrogen biogeochemical cycling in the northwestern Indian Ocean, Deep-Sea Res. II, 40, 651–671, 1993.
Mariotti, A., Germon, J. C., Hubert, P., Kaiser, P., Letolle, R., Tardieux, A., and Tardieux, P.: Experimental determination of nitrogen kinetic isotope fractionation: some prinicples; illustra-tion for the denitrficaillustra-tion and nitrificaillustra-tion processes, Plant Soil,
62, 413–430, 1981.
Morrison, J. M., Codispoti, L. A., Gaurin, S., Jones, B., Mangh-nani, V., and Zheng, Z.: Seasonal variation of hydrographic and nutrient fields during the US JGOFS Arabian Sea Process Study, Deep-Sea Res. II, 45, 2053–2101, 1998.
Morrison, J. M., Codispoti, L. A., Smith, S. L., Wishner, K., Flagg, C., Gardner, W. D., Gaurin, S., Naqvi, S. W. A., Manghnani, V., Prosperie, L., and Gundersen, J. S.: The oxygen minimum zone in the Arabian Sea during 1995, Deep-Sea Res. II, 46, 1903– 1931, 1999.
Naik, H. and Naqvi, S. W. A.: Sedimentary nitrogen cycling over the western continental shelf of India, EOS – Trans. Amer. Geo-phys. Union, 83(4) OSM Suppl., Abs. OS12I-05, 2002. Naqvi, S. W. A.: Some aspects of the oxygen-deficient conditions
and denitrification in the Arabian Sea, J. Mar. Res., 49, 1049– 1072, 1987.
Naqvi, S. W. A.: Geographical extent of denitrification in the Ara-bian Sea in relation to some physical processes, Oceanolog. Acta, 14, 281–290, 1991.
Naqvi, S. W. A. and Noronha, R. J.: Nitrous oxide in the Arabian Sea, Deep-Sea Res., 38, 871–890, 1991.
Naqvi, S. W. A. and Shailaja, M. S.: Activity of the respiratory electron transport system and respiration rates within the oxygen minimum layer of the Arabian Sea, Deep-Sea Res. II, 40, 687– 695, 1993.
Naqvi, S. W. A., Noronha, R. J., Somasundar, K., and Sen Gupta, R.: Seasonal changes in the denitrification regime of the Arabian Sea, Deep-Sea Res., 37, 693–711, 1990.
Naqvi, S. W. A., Yoshinari, T., Jayakumar, D. A., Altabet, M. A., Narvekar, P. V., Devol, A. H., Brandes, J. A., and Codispoti, L. A.: Budgetary and biogeochemical implications of N2O isotope
signatures in the Arabian Sea, Nature, 394, 462–464, 1998a. Naqvi, S. W. A., Yoshinari, T., Brandes, J. A., Devol, A. H.,
Jayaku-mar, D. A., Narvekar, P. V., Altabet, M. A., and Codispoti, L. A.: Nitrogen isotopic studies in the suboxic Arabian Sea, Proc. In-dian Acad. Sci. (Earth Planet. Sci.), 107, 367–378, 1998b. Naqvi, S. W. A., Jayakumar, D. A., Narvekar, P. V., Naik, H., Sarma,
V. V. S. S., D’Souza, W., Joseph, S., and George, M. D.: In-creased marine production of N2O due to intensifying anoxia on
the Indian continental shelf, Nature, 408, 346–349, 2000. Naqvi, S. W. A., Sarma, V. V. S. S., and Jayakumar, D. A.: Carbon
cycling in the northern Arabian Sea during the northeast mon-soon: Significance of salps, Mar. Ecol. Progr. Ser., 226, 35–44, 2002.
Naqvi, S. W. A, Naik, H., Jayakumar, D. A., Shailaja, M. S., and Narvekar, P. V.: Seasonal oxygen deficiency over the western continental shelf of India, in: Past and Present Water Column Anoxia. NATO Science Series, IV. Earth and Environmental Sci-ences – Vol. 64, Springer, 195–224, 2006a.
Naqvi, S. W. A., Naik, H., D’ Souza, W., Narvekar, P. V., Parop-kari, A. L., and Bange, H. W.: Carbon and nitrogen fluxes in the North Indian Ocean, in: Carbon and Nutrient Fluxes in Con-tinental Margins: A Global Synthesis, edited by: Liu, K. K., Atkinson, L., Quinones, R., and Talaue-McManus, L., Springer-Verlag, Berlin, in press, 2006b.
Richards, F. A.: Anoxic basins and fjords, in: Chemical Oceanog-raphy, Vol. 1, edited by: Riley, J. P. and Skirrow, G., Academic Press, London, 611–643, 1965.
Rixen, T., Guptha, M. V. S., and Ittekkot, V.: Deep ocean fluxes and
their link to surface ocean processes and the biological pump, Prog. Oceanogr., 65, 240–259, 2005.
Saager, P. M., de Baar, H. J. W., and Burkill, P. H.: Manganese and iron in Indian Ocean waters, Geochim. Cosmochim. Acta, 53, 2259–2267, 1989.
Senga, Y., Mochida, K., Fukumori, R., Okamoto, N., and Seike, Y.: N2O accumulation in estuarine and coastal sediments: the
in-fluence of H2S on dissimilatory nitrate reduction, Estuar. Coast.
Shelf Sci., 67, 231–238, 2006.
Sen Gupta, R. and Naqvi, S. W. A.: Chemical oceanography of the Indian Ocean, north of the equator, Deep-Sea Res., 31, 671–706, 1984.
Shailaja, M. S., Narvekar, P. V., Alagarsamy, R., and Naqvi, S. W. A.: Nitrogen transformations as inferred from the activities of key enzymes in the Arabian Sea oxygen minimum, Deep-Sea Res. I, 53, 960–970, 2006.
Siefert R. L., Johansen, A. M., and Hoffmann, M. R.: Chemical characterization of ambient aerosol collected during the south-west Monsoon and inter-Monsoon seasons over the Arabian Sea: Labile Fe(II) and other trace metals, J. Geophys. Res., 104, 3511–3526, 1999.
Sigman, D. M., Altabet, M. A., Michener, R., McCorkle, D. C., Fry, B., and Holmes, R. M.: Natural abundance-level measurement of the nitrogen isotopic composition of oceanic nitrate: an adapta-tion of the ammonia diffusion method, Mar. Chem., 57, 227–242, 1997.
Somasundar, K. and Naqvi, S. W. A.: On the renewal of the deni-trifying layer in the Arabian Sea, Oceanolog. Acta, 11, 167–172, 1988.
Swallow, J.: Some aspects of the physical oceanography of the In-dian Ocean. Deep-Sea Res., 31, 639–650, 1984.
Tanaka, T. and Saino, T.: Modified method for the analysis of nitro-gen isotopic composition of oceanic nitrate at low concentration, J. Oceanogr., 58, 539–546, 2002.
Thamdrup, B., Dalsgaard, T., Jensen, M. M., Ulloa, O., Farias, L., and Escribano, R.: Anaerobic ammonium oxidation in the oxygen-deficient waters off northern Chile, Limnol. Oceanogr., 51, 2145–2156, 2006.
Wiggert, J. D., Murtugudde, R. G., and Christian, J. R.: Annual ecosystem variability in the tropical Indian Ocean: Results of a coupled bio-physical ocean general circulation model, Deep-Sea Res. II, 53, 644–676, 2006.
Wu, J., Calvert, S. E., and Wong, C. S.: Nitrogen isotope variations in the subarctic northeast Pacific: relationships to nitrate utiliza-tion and trophic structure, Deep-Sea Res. I, 44, 287–314, 1997. Wyrtki, K.: Oceanographic Atlas of the International Indian Ocean
Expedition, National Science Foundation, Washington, D.C., 531 pp, 1971.
Yamagishi, H., Yoshida, N., Toyoda, S., Popp, B. N., Westley, M. B., and Watanabe, S.: Contributions of denitrification and mixing on the distribution of nitrous oxide in the North Pacific, Geophys. Res. Lett., 32, L04603, doi:10.1029/2004GL021458, 2005. Yoshinari, T., Altabet, M. A., Naqvi, S. W. A., Codispoti, L. A.,
Jayakumar, A., Kuhland, M., and Devol, A. H.: Nitrogen and oxygen isotopic composition of N2O from suboxic waters of the
eastern tropical North Pacific and the Arabian Sea - measurement by continuous-flow isotope ratio monitoring, Mar. Chem., 56, 253–264, 1997.