HAL Id: hal-00022561
https://hal-insu.archives-ouvertes.fr/hal-00022561
Submitted on 11 Apr 2006HAL is a multi-disciplinary open access
archive for the deposit and dissemination of sci-entific research documents, whether they are pub-lished or not. The documents may come from teaching and research institutions in France or abroad, or from public or private research centers.
L’archive ouverte pluridisciplinaire HAL, est destinée au dépôt et à la diffusion de documents scientifiques de niveau recherche, publiés ou non, émanant des établissements d’enseignement et de recherche français ou étrangers, des laboratoires publics ou privés.
Physical volcanology of the 2050 BP caldera-forming
eruption of Okmok Volcano, Alaska.
Alain Burgisser
To cite this version:
Alain Burgisser. Physical volcanology of the 2050 BP caldera-forming eruption of Okmok Volcano, Alaska.. Bulletin of Volcanology, Springer Verlag, 2005, 67, pp.497-525. �10.1007/s00445-004-0391-5�. �hal-00022561�
PHYSICAL VOLCANOLOGY OF THE 2050 BP
CALDERA-FORMING ERUPTION OF OKMOK
VOLCANO, ALASKA
ALAIN BURGISSER
[email protected], Phone +1 907 474 5713, Fax +1 907 474 7290
Alaska Volcano Observatory, Geophysical Institute, University of Alaska Fairbanks, Fairbanks, AK 99775-7320 USA
Word count: Abstract 250, Main text 9373
2 Tables, 23 Figures, 5 Equations Revised for: Bulletin of Volcanology
ABSTRACT
In the Aleutian volcanic chain (USA), the 2050 ± 50 BP collapse of Okmok caldera generated pyroclasts that spread over 1000 km2 on Umnak Island. After expelling up to 0.25 km3 DRE of rhyodacitic Plinian air fall and 0.35 km3 DRE of andesitic
phreatomagmatic tephra, the caldera collapsed and produced the 29 km3 DRE Okmok II scoria deposit, which is composed of valley-ponding, poorly sorted, massive facies and over-bank, stratified facies with planar and cross bedding. Geological and
sedimentological data suggest that a single density current produced the Okmok II deposits by segregating into a highly concentrated base and an overriding dilute cloud. The dense base deposited massive facies, whereas the dilute cloud sedimented
preferentially on hills as stratified deposits. The pyroclastic current spread around Okmok in an axisymmetric fashion, encountering topographic barriers on the southwest, and reaching Unalaska Island across an 8-km strait on the east, and reaching the shoreline of Umnak in the other directions. The kinematic model by Burgisser and Bergantz (2002, Earth Planet. Sci. Lett. 202:405-418) was used to show how decoupling of the pyroclastic current was triggered by both sea entrance and interaction with the topography. In the former case, the dense part of the current and the lithics transported by the dilute cloud went underwater. In the latter case, topographical barriers noticeably decelerated both parts of the decoupled current and favored sedimentation by partial or complete blocking. The resulting unloading of the dilute current drastically reduced the runout distance by triggering an early buoyant lift-off.
INTRODUCTION
Okmok volcano forms the northeastern part of Unmak Island, which lies in the middle of the Aleutian volcanic chain (Alaska, USA). With a volume of 400-500 km3, the Okmok shield is among the largest volcanic centers in the Aleutian arc. Okmok’s predominantly basaltic eruptive style was punctuated by catastrophic silicic-magma-bearing eruptions (Okmok I and II) that produced two nested, 10-km diameter calderas at the summit (Black 1975; Miller and Smith 1987). Intracaldera activity following the younger Okmok II caldera event formed numerous basaltic cones and lava flows. On-going deformation of the caldera floor has been recognized by SAR interferometry (Lu et al. 2000), and the most recent eruption was in 1997. Although numerous geologic (Byers, 1959) and geochemical observations (Byers, 1961) have been collected at Okmok, most were aimed at the questions of arc petrogenesis (e.g., Kay and Kay 1994) and physical processes of specific volcanic events to date have not been explored systematically.
The focus of this study is on the latest caldera-forming eruption, Okmok II, with the goal of establishing the physical parameters related to this volcanic event. The eruption has been dated at 2050 ± 50 BP (Wolfe 2001) and its deposits covered some 1000 km2 of Umnak Island (Fig. 1). The products of this eruption consist of minor fall tephra overlain by voluminous, non-welded pyroclastic density current deposits. The bulk composition changes dramatically from rhyodacite in the first part of the fall deposits to basaltic andesite throughout the rest of the eruptive sequence (Larsen and Nye in review).
In this study, geological and sedimentological data of the fall deposits are utilized to reconstruct the eruptive dynamics of the earliest phase of the eruption, whereas data from the two facies of the pyroclastic density current deposits constrain the nature of the
current. Interactions between the pyroclastic current and its surroundings (hills and sea) elucidate important characteristics of the current, such as internal particle concentration and thickness. These characteristics can be best explained by the kinematic model by Burgisser and Bergantz (2002), and this model is employed to infer the mean speed of the current at a given location and to determine whether the current was in sub- or
supercritical regime.
METHODS AND THEORY
The topographic map was based on the 10-m resolution DEM of the USGS, and the geologic map of Byers (1959) was used for reference. Samples were localized by GPS (Fig. 1). In the fall deposits and stratified facies, most samples were bulk samples over the entire thickness of the unit, and some samples were of individual layers. The coarsest clast sizes of the stratified facies are much smaller than the sampling volume and are thus properly represented in the sieve data. In the massive facies, the sample volume was 10×10×10 cm. Because the sampling area was limited, the 3 largest clasts within a 2 m2 area around the sampling area were also measured to ensure that the sampling properly represented the coarsest sizes. For all samples, the average diameter of those clasts is at most 1 φ size larger than the maximum clast size within the sampled material.
Most samples were dry-sieved and counted in the field for the coarsest fraction (> -2 φ). The remainder of the material was wet-sieved in the laboratory to 4.5 φ in intervals of 0.5 φ. The finer fraction (<4.5 φ) was collected in 2-gallon water buckets and dried. The size distributions of the fine fraction were determined to 7 φ using a Spectrex ILI-1000 laser particle counter. Although the particle counter gives wt.% between 4.5 and 10 φ,
those values were normalized to sizes between 4.5 and 7 φ because the distilled water used to dilute the fine fraction contained impurities below 7 φ. Particle counter and sieve data were combined to obtain normalized grain size distributions. The error in the weight of each size fraction is estimated to less than 5 g for the field-sieved fraction and less than 0.1 g for the finer sizes. The error in the weight percent is thus estimated to 0.2% for the field-sieved fraction and 0.1% for the finer sizes. Grain sizes are given in φ units (-log2(mm)) and the parameters used in this study are the Inman median size Md (50 wt.%) and sorting σ (Inman 1952; Cas and Wright 1987). Those parameters are accurate to ±0.1 φ. The componentry of samples was obtained by manually separating and weighing a statistically significant number of the different clast types for sizes coarser than 0 φ, and by counting 500 particles per class size with a binocular microscope for the smaller sizes down to 2 φ (4 φ for some samples). Conversion to weight fraction was done using the average weight of each particle type. Errors on the normalized proportions are on the order of 0.1%. For each sample, the mean particle density is calculated to the nearest 100th of kg m-3 using the bulk component data with 1000, 2500, 2000 and 2500 kg m-3 being the respective densities of scoria, lithic, glass and crystal.
A brief summary of the model by Burgisser and Bergantz (2002) follows because it was used to derive dynamic parameters of the pyroclastic density current. In this kinematic template, the multiphase interactions of particles within the dilute part of the current are characterized with two dimensionless numbers: the Stokes (ST) and stability
(ΣT) numbers. The Stokes number measures the coupling between gas and particles and is
the ratio of the response time of particles (UT/g, particle reaction to unsteady forcing by
i i T T gδ ∆U U S = (1)
where UT is the particle terminal fall velocity, g the acceleration of gravity, δι is the eddy diameter, and ∆Ui is the eddy rotation speed. ∆Ui can be related to both the
root-mean square of the gas velocity Urms and the mean current speed U by (Pope 2000):
U e U e Ui 2 rms 2 4 88 88 ≅ = ∆ (2)
The stability number assesses the steady gravitational forcing on particles and is a measure of the particle residence within an eddy:
i T
Τ ∆U
U
Σ = (3)
The combination of ST and ΣΤ defines three main particle behaviors within the cloud: sedimentation (ST >1 and ΣΤ > 10-0.5), where particles are not sustained by turbulence and fall out; transport (ST < 1 and ΣΤ < 100.5), where particles are well mixed within the flow; and transient (other cases), where particles gather and disperse in a transient way. The buoyancy frequency (π ∆Ui /δι), which controls the rotation time of the most energetic eddies, can be combined with current height H and speed U to frame the Froude number FR of the current: i i R U H U F ∆ π δ = 4 (4)
STRATIGRAPHY OF THE OKMOK II ERUPTION
The stratigraphy of the latest caldera-forming activity in Okmok shows that there were two major eruptive phases. The first phase produced three tephra fall sequences (A, B,
and C, Fig. 2), whereas the second generated a voluminous ignimbrite. Enough locations were found to reconstruct the distribution of the fall deposits, although the fall deposits are often buried underneath the pyroclastic current deposits. The initial fall sequence mostly covers the northern sector of the volcano (Fig. 3), whereas the two other sequences occur east, extending to the nearby Unalaska Island (Figs. 4 and 5). The method of Pyle (1989) was used to estimate tephra volumes, and two type sections were used to reconstruct the fall stratigraphy. The first type section is located ~9 km north of the caldera rim near the shore (star symbol in Fig. 3) and the second is located ~12 km east of the caldera rim (star symbol in Fig. 4). Each fall sequence has been divided into several units (A1-2, B1-2, and C1-3) illustrated in Fig. 2. This eruption produced both scoria and pumice with distinct compositions. Tan pumices, composing the bulk part of the fall deposits, are rhyodacitic in bulk composition, whereas black scoria, composing the pyroclastic current deposits, are basaltic andesite (Larsen and Nye, in review).
Fall deposits
Fall sequence A is the lowermost unit of the Okmok II eruptive sequence and consists of tan pumice lapilli with rare lithics. It commonly overlies a thick (>30 cm) soil with carbonized plant remains at the contact. Some carbonized weeds were in their original living position within unit A1. Sequence A is up to 114 cm thick at the reference section (Fig. 3) and it can be subdivided into a reversely graded layer (A1, Fig. 2) varying from fine ash (median grain size Md=0 φ) to coarse lapilli (Md=-4.3 φ), and an ungraded layer of lapilli A2 (Md=-1 φ). Both units are well sorted (σ=0.6), and are separated by a fine ash deposit (Md=3.8 φ) that is only present near the reference locality. The distribution map of A1 and A2 indicates a NNW dispersal axis (Fig. 3) with a total volume of ~0.4
km3. Median grain sizes of unit A1 are indicated at four localities, and density measurements reveal that the coarsest pumices average 500 kg m-3.
Fall sequence B is finely stratified and consists of brown pumice lapilli. The sequence is up to 21 cm thick with Md=0.5 φ at the reference section (Fig. 4) and two groups of layers can be recognized based on pumice morphologies. The basal group of layers (unit B1) contains vesicular pumices with irregular shapes, similar to the ones from sequence A, whereas the upper group (unit B2) consists of poorly vesicular pumices with blocky shapes (Fig. 2). Up to 50 wt.% of these blocky pumices is vesicle-free glass. The
distribution map of B1 and B2 indicates an easterly dispersal axis with a volume of ~0.05 km3 (Fig. 4). A small amount of erosion or reworking exists between the sequences A and B, but there is little evidence for a significant time break at this horizon, such as would be marked by soil development or abundant reworking by water.
Fall sequence C can be found on the northeast part of Umnak Island and on most of Unalaska Island, but it has been eroded from many exposed locations. The sequence is up to 20 cm thick at the reference section (Fig. 4), where up to 10 layers can be recognized, with grain sizes that vary from fine ash (Md=3 φ) to fine lapilli (Md=-0.5 φ). Although sequence C consists mainly of black scoria lapilli layers, one layer contains vitric and blocky pumice ash. All layers have rare lithics. The pumice-bearing layer delimits three groups of layers within sequence C: 8 layers of scoria at the base (unit C1), the pumice layer (unit C2), and a scoria layer atop (unit C3, Fig. 2). The distribution map of C1, C2, and C3 indicates an easterly dispersal axis and a volume of ~0.4 km3 (Fig. 5).
Pyroclastic current deposits
Pyroclastic current deposits from the Okmok II eruption blanket the northeast part of Umnak Island, forming plateau surfaces around the volcano that are cut by modern stream channels (Fig. 6). These black, scoria-rich deposits generally overlie fall sequences with a sharp contact, and occasionally present an erosive contact with
underlying soil or older deposits. Most of the deposits are several tens of meters thick and present a massive, poorly sorted facies. Another facies with low angle cross-stratification or planar bedding, and improved sorting occurs on hills and paleohighs (e.g., Idak
plateau), where deposits are only up to a few decimeters. A similar stratified facies is systematically found on Unalaska Island, where deposits vary in thickness from one meter on the western shore to a few centimeters inland (Fig. 6). Clasts composing the pyroclastic deposits can be divided into four types: juvenile scoria, lithics, crystals and glass. Black scoria is the most abundant type. Lithics comprise mostly aphyric basalt, minor basement clasts, hydrothermally altered clasts, and red oxidized scoria lithics that are frequently found in the pre-caldera stratigraphic sequence. Crystals are mostly plagioclase, with minor olivine and pyroxene. Most crystals are unbroken, and some crystals have adhering glass. Glass is mostly juvenile, but also includes some aphyric basalt, from which the distinction is difficult.
The total volume of pyroclastic deposits on land is estimated at 24 km3, and the massive facies accounts for >99.8% of the total volume. Assuming a Dense Rock Equivalent of 2500 kg m-3, and a deposit average density of 1450 kg m-3 from the massive facies componentry, this volume translates into ~14 km3 DRE. Preliminary surveys of the Okmok I deposits and the intra-caldera geology suggest that the volume of
the preexisting caldera left by Okmok I is similar to the volume of infillings by post-caldera basalt and tephra. It is thus reasonable to assume that the post-Okmok II infillings balance the volume of the pre-Okmok II caldera, and that the current volume of the caldera (40 to 60 km3) is representative of the total volume of erupted material during Okmok II. Okmok II thus erupted ~50 km3 (~29 km3 DRE), half of which was deposited on land.
Massive facies of the pyroclastic current deposits
The thickness of the massive facies varies greatly, but the integration of visual estimates and tape measurements suggests that the thickness averages from ~ 60 m proximally to ~ 30 m at shore, at about 10 km from the caldera rim (Fig. 6 reports tape measurements). The top surface of the deposits forms a gently inclined plateau (Fig. 7), whereas the base is more irregular, revealing the jagged nature of the paleorelief. Thus, most thickness variations of the massive deposit result from the wavy paleotopography. Deposits are primary, with the exception of two regions that have been reworked (Fig. 6). The first region is located east of the caldera and features thick outcrops with rounded scoria, over-sized (>1 m) rounded lithic boulders, and numerous crude planar
stratifications. These outcrops and several localities with thin (<1 m)
volcano-sedimentary deposits suggest a subsequent reworking of the pyroclastic deposits with water on the eastern part of the island. The second region lies northwest of the caldera, where deposits display abundant red oxidized scoria with a few lithic pipes. These regions were avoided for the reconstruction of the eruptive dynamics. Although the massive facies is mostly structureless, occasional crude stratifications are observed where thickness variations are important. Common accumulations of coarse scoria occur where
the deposit thins to about one meter, and scarce occurrences of a thin (<10 cm) lithic-rich unit at the base were found on the lee side of paleohighs. On average, the massive facies consists of 69 wt.% juvenile scoria, 26 wt.% lithics, and 5 wt.% glass and crystals (Fig. 2), with median grain sizes ranging between –2.5 and 0 φ and poor sorting (σ~3, Fig. 8). Crystals are generally smaller than 1 φ and glass becomes more abundant below 0 φ, whereas scoria and lithics occur at all grain sizes.
Local vertical variations of the massive facies were characterized by determining grain-size distributions and components of samples from the base and the top of various localities around the volcano (Fig. 1). Median grain sizes usually decrease by 1 φ size towards the top of the deposit with no change in sorting (Fig. 8). Bulk lithic contents vary by up to 20 wt.%, regardless of stratigraphic position (Fig. 9). To examine if a particular size class is responsible for these bulk variations, the difference in normalized lithic proportion between two neighboring samples are plotted for each grain size. By
convention, the component data of the sample appearing to the right is always subtracted from the component data of the sample to the left of the diagram. For example, the bulk componentry of the sample AOK98 at the base of the deposit contains 17 wt.% more lithics than the sample AOK97 at the top (Fig. 9). The line labeled ‘lithics’ between these two samples indicates the arithmetic difference in lithic content for each grain size
indicated on the x-axis (i.e. lithic wt.% in AOK98 minus lithic wt.% in AOK97 for each size class). This graphic representation shows that the difference in lithic bulk content between these two samples is caused by a higher lithic content of AOK98 between -5 and –1 φ (Fig. 9). From the four localities represented on Fig. 9, it is apparent that the vertical variations of lithic content within the deposit are caused by the coarsest clast fraction
(above -2 φ). Vertical variations of crystal and glass proportions are small regardless of grain size.
Twenty-six samples taken at various azimuths around the caldera, 8 to 12 km from the rim, were analyzed to study radial variations of the massive facies. Six representative samples located at regular intervals of azimuth around the caldera were selected for component determination (triangle symbols on Fig. 1). Sorting and median sizes display weak variations around the volcano (Fig. 10A). As in the vertical sections, small
componentry changes are due to the coarse fraction (Fig. 10B). Lithic proportions vary between 9 and 38 wt.%, with smallest values on the west of the volcano. Note that the lowest lithic content occurs at a locality (AOK164) that displays depletion in lithics regardless of grain size. Both this depletion and the improved sorting (σ=2.4) of this thin (2.5 m) locality reflect a frequent pattern occurring when deposits thin because of
important paleo-relief. There is indeed a general correlation between thinness and the presence of very crude stratification, and locally some strata feature better sorting in size and density than others.
Eleven samples from three longitudinal sections around the volcano were analyzed to study proximal-to-distal variations of the massive facies (sections Ia-c on Fig. 1). In the northern section Ia, median grain sizes decrease by 2 φ units with distance from source with no change in sorting (Fig. 11a). Lithic contents increase by 20 wt.% with distance because of the coarse fraction, and glass contents rise slightly (Fig. 11b). In the
northeastern section Ib, there is a modest decrease in median grain sizes by 1 φ unit (Fig. 11a). Whereas the proximal sample is moderately sorted (σ=1.9), more distal samples display the characteristic poor sorting of the massive facies. Bulk lithic contents decrease
markedly (50 wt.%) with distance and the variations are mostly concentrated in the coarsest fraction (Fig. 11c). In the southern section Ic, median grain sizes decrease by 2 φ units, with no change in sorting (Fig. 11a). Bulk lithic contents vary by less than 25 wt.% with no systematic trend and the variations are mostly concentrated in the coarsest fraction (Fig. 11d). In all sections, crystal and glass proportions do not significantly vary.
In summary, the characteristics of the massive facies have similar trends regardless of azimuth despite its variable thickness. On a local scale, the base of the deposit is coarser and more variable than the top (Fig. 8), whereas in all sections there is a decrease in median grain size with distance from source without significant change in sorting. Lithic contents vary by about 20 wt.%, with most of the variation concentrated in the coarsest sizes (>-2 φ) of the distribution, which creates a general trend of coarse-tail grading, with lithic-rich base and scoria-rich top. Changes in components between intermediate and distal locations are irregular and often less pronounced than vertical variations recorded at a given location.
Stratified facies of the pyroclastic current deposits
The thickness of the stratified facies varies between 30 and 70 cm proximally and averages about 20 cm at ~20 km from the caldera rim (Fig. 6). The stratified facies is found only on tops of hills, such as Kettle Cape to the south, or elevated plateaus, such as Idak to the northeast (Fig. 1), and many locations display evidence of erosion. These areas are exposed to the high winds common in the Aleutian Islands, and the loose nature of these relatively thin deposits accounts for their low preservation potential. Although many thickness measurements are minimum values because of erosion, it is likely that the
stratified facies thins with distance. The thickness of the stratified facies is more uniform than that of the massive facies.
The stratified facies can generally be divided in two units based on components. The basal unit is richer in lithics, with an average of 60 wt.% scoria, 35 wt.% lithics, and 5 wt.% glass and crystals, whereas the upper unit is richer in scoria with an average of 79 wt.% scoria, 15 wt.% lithics, and 6 wt.% glass and crystals (Fig. 2). Scoria and lithics occur at all grain sizes, whereas crystals are generally smaller than 1 φ and glass becomes more abundant below 0 φ.
The basal unit is generally massive and poorly sorted (σ=2) around the volcano, and varies little in grain size with distance (Fig. 12a). Grain size distributions show that it is generally coarser and better sorted than the upper unit (Fig. 12b). Differences in
componentry with size between the two units show that fractions coarser than –0.5 φ are the source of lithic enrichment (up to 30 wt.%) of the basal unit (Fig. 12c).
The upper unit exhibits alternating planar stratification, absence of stratification, and low-angle cross bedding with gradational or sharp transitions between individual beds. No systematic variations, either vertically or horizontally, between these various patterns could be found, most likely because of the paucity of outcrops. The stratified nature of the deposits implies a large local variability of sorting and median size that depends on the exact size and position of the bulk sample. This variability can be illustrated by the change in median size of individual layers within the upper unit at Kettle Cape (Fig. 12b). The componentry between individual layers from the same locality does not vary
Relationship between massive and stratified facies
The transition between massive and stratified facies systematically occurs at the flanks of prominent ridges. The massive deposit usually thins uphill from tens of meters to meters with the occasional appearance of crude stratifications and laterally changes to stratified facies within meters. Stratigraphic correlations on the south side of Idak plateau (Fig. 13a) and at Hourglass Pass indicate that massive and stratified facies are a lateral variation of the pyroclastic deposits, rather than a vertical succession (see composite cross section in Fig. 13b). A lithic-rich unit is often present at the base of the stratified facies, but more rarely at the base of the massive facies, where it is preserved only on the lee side of paleohighs (e.g., north of Kettle Cape). Accumulations of coarse scoria are regularly found around the volcano where the deposit thins to about one meter while remaining massive in texture. These accumulations display a sharp peak of coarse scoria (Fig. 13b), whereas the fine tail has a componentry similar to the main body of the massive facies. Importantly, a scoria accumulation near Hourglass Pass occurs at the facies transition between massive and stratified (AOK100, Fig. 1).
Southwestern Ridges
Okmok peninsula is linked to the southwest part of Umnak Island by an isthmus with rugged topography, where altered Tertiary volcanic rocks form a succession of
northwestward ridges (Byers 1959). To study the relationship between pyroclastic current deposits and topography across these ridges, two transects were collected within massive (IIa) and stratified (IIb) facies, respectively (Figs. 1 and 14a).
The massive facies is thicker than 20 m before and after the first ridge, and thins rapidly to a few meters after the second ridge. The median grain size decreases with
distance at the same rate before and across the two ridges, with similar poor sorting (Fig. 14b). Componentry changes little with distance: lithic contents oscillate by less than 10 wt.% because of the coarse fraction (Fig. 14c).
The stratified facies has a variable thickness of about a decimeter across the three first ridges, but thins to a few centimeters after the fourth ridge (Fig. 14a). The median grain size decreases slowly with distance across the first three ridges, and diminishes rapidly after the fourth ridge, whereas the sorting remains good (σ~1.5) regardless of distance (Fig. 14b). The componentry does not change across the two first ridges (NE-SW), but lithics of all sizes increase by 20 wt.% across the third ridge and glass clasts of all sizes (i.e. <0.5 φ) considerably increase by 35 wt.% across the fourth ridge, at the most distal locality (Fig. 14d).
In summary, the proximal rate of decrease in grain size is similar in both facies. Interestingly, size distributions of stratified facies at a given location match the coarse half of massive facies at the same location (Fig. 14b). This relationship seems true in general, because it is also verified on the north side of the Idak plateau and at Kettle Cape.
Unalaska Island
Pyroclastic deposits cover over half of the western part of Unalaska Island, which is separated from Umnak Island by an 8-km wide strait (Umnak Pass, Fig. 1). They occupy the same stratigraphic position as the ones on Umnak, directly overlying the fall deposits. These deposits vary from ~70 cm proximally to ~10 cm distally and they are generally structureless with discontinuous crude planar bedding. Unlike on Umnak Island, these
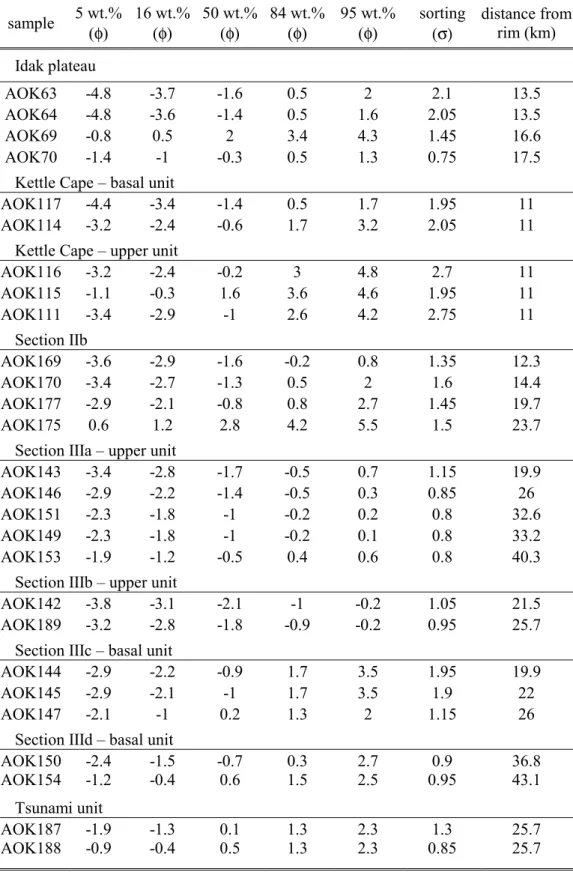
stratified facies can generally be divided into a thin lithic-rich upper layer (78 wt.% scoria, 14 wt.% lithics, and 8 wt.% glass and crystals) and a lithic-poor basal layer (88 wt.% scoria, 5 wt.% lithics, and 7 wt.% glass and crystals). The distinction between the two layers is only apparent from the component data and cannot be ascertained in the field. Taking in account that the respective thickness of each layer is only constrained by the sampling interval, the upper layer forms about a third of the total thickness. Some outcrops present slight post-depositional disturbances probably linked with the high void fraction of the basal layer that may favor downward migration of small, denser lithics from the upper layer. To compare trends between localities with similar path history (land or water), the localities on the plateau inland (sections IIIa and c, Fig. 1) were separated for each layer from the ones directly at the shore (sections IIIb and d, Fig. 1).
The thickness of the basal layer decreases rapidly on the western coast (section IIIa) and thins gently across the plateau (Fig. 6). Grain size distributions are unimodal and the sorting improves slightly with distance (Table 1). Grain sizes decrease gently with distance both along the shore and across Unalaska’s plateau (Fig. 15a). Interestingly, grain sizes sharply decrease between equidistant localities at shore (section IIIa) and on the highlands (section IIIb). The componentry of the basal layer remains remarkably constant over all locations (Fig. 15b).
The thickness of the upper layer is hard to survey because it has been partially reduced by erosion. The basal layer is always present below the upper layer except at one locality (AOK145), where only the upper layer crops out. Size distributions are bimodal near the shoreline, causing large sorting coefficients (Table 1), but the bimodality diminishes away from shore (Fig. 16). After remaining constant near the coast (section IIIc), median
grain sizes decrease sharply inland (Fig. 17a). The componentry of the upper layer significantly varies across all grain sizes regardless of distance or location (Fig. 17b).
Some localities near the shore, generally below 15 m in altitude, exhibit erosion of the stratified deposit, which is overlain by a decimeter of fine sand in turn capped by a meter of a similar sand layer (Fig. 18, Table 1). The two sandy units are separated by an erosive contact. The lower sand unit is well sorted (σ = 0.85) with a median size of 0.5 φ,
whereas the upper unit is bimodal with the same mode as the lower layer plus a coarser mode of -1 φ. Both sandy units contain clast types similar to the stratified deposits: 80 wt.% lithics, 14 wt.% scoria, and 6 wt.% glass and crystals.
DISCUSSION Eruption dynamics
The thick soil underlying the fall deposits suggests that the 2050 BP Okmok II eruption occurred after a multiyear period of quiescence because soil formation is slow in Arctic regions like the Aleutians Islands (J. Beget, pers. comm. 2000). Both the charred
vegetation in its living position within the fall unit A1 and the preservation of the reverse grading of this unit suggest that the ground was mostly free of snow at the time of the eruption. The eruption started as an increasingly vigorous Plinian column of rhyodacitic fall tephra, the umbrella of which was diverted to the NNW by strong winds. The distribution map of the associated fall deposits shows that the vent was located in the northern part of the caldera. After a second steady pulse that produced unit A2, the column faded and the eruption stopped as indicated by the small amount of reworking between fall sequences A and B. Interruption of the eruptive activity was long enough to
gently rework the fresh deposit, but not sufficient to develop significant water drainage, suggesting an interval of days to months.
The second part of the eruption started from a vent located in the eastern part of the caldera with the wind blowing to the east. Unfortunately, the distribution map of the associated fall deposits is not sufficient to indicate whether the various fall sequences originate from one or several source vents. High proportions of glassy and blocky clasts, the internal discontinuous layering of the deposit, and the likely presence of abundant water within the caldera left by Okmok I, suggest that unsteady phreatomagmatic explosions generated these deposits. As the explosive venting suddenly changed composition from dacitic to andesitic, fewer phreatomagmatic events occurred, but the wind continued to blow eastward. Interestingly, the drastic compositional shift from rhyodacite to basaltic andesite occurred without noticeable changes in eruptive style or vent location. The presence of a short phreatomagmatic dacitic event is noted within the sequence C (pumice-bearing unit C2). After expelling up to 0.5 km3 of dacite (~0.25 km3 DRE) and 0.35 km3 of andesite (~0.17 km3 DRE), the eruptive regime dramatically increased, three orders of magnitude in volume, and generated deposits that completely covered the northeast part of Umnak Island. Most likely, the pyroclastic current deposits are responsible for the charred vegetation buried underneath the fall deposits because the fall deposits were not hot enough to char vegetation when they were deposited (Thomas and Sparks 1992). The pyroclastic deposits, however, were not hot enough to cause welding or scoria oxidation, which suggests that their temperature was between 200 and 600 °C (Riehle 1973).
The climactic phase expelled about 50 km3 (~29 km3 DRE) of material, half of which was deposited on Umnak as a massive facies, and a fraction of which was deposited as a stratified facies on Unalaska and some hills of Umnak. The dramatic increase in both eruptive strength and lithic content suggests a temporal link between the emplacement of these deposits and the initiation of caldera collapse. Unfortunately, the style of caldera collapse cannot be inferred from the present sedimentological study because the
characteristics of the massive facies have similar trends regardless of azimuth despite its variable thickness. The wavy nature of the bottom contact and the flat surface defined by its top (Fig. 7a) indicate that the massive facies filled in previous topography, which was probably a rugged plateau with deeply incised gullies. The poor sorting, massive
appearance, and distribution of the massive facies suggest that it formed by deposition from a dense, ground-hugging pyroclastic flow (Sparks 1976; Druitt 1998; Freundt et al. 2000). The valley-ponding deposition probably favored larger variations in grain sizes at the base of the deposits. Crude stratifications where the topography is rugged probably result from the interfingering of multiple lobes within the moving pyroclastic flow. Along the same line, the weak coarse-tail grading is also probably caused by variations of the local conditions of sedimentation. Overall, grain size analyses suggest that the spreading of the pyroclastic flow was axisymmetric, which is helpful to address the emplacement dynamics of the current, because it allows direct comparison of locations equidistant from the caldera rim.
Although one might think that such a large pyroclastic flow would significantly erode a rugged topography, evidence of erosion is scarce: the only erosive base was found at the proximal eastern locality AOK138 (Fig. 1). In addition, the high aphyric basalt content of
the base at location AOK124 (Fig. 9) is probably derived from the nearby north-trending ridge, where outcrops of the same basalt abound. This indirect evidence suggests that the current eroded part of the northward ridge along section Ia, directly north of the caldera (Fig. 1).
Less than 0.2% of the volume of the density current deposits is stratified. Nevertheless, the correct interpretation of the topology of this scarce facies is essential to understand the parent density current. The bedding pattern and the variable distribution of this facies suggest that it formed by deposition from dilute, turbulent pyroclastic surge(s) (Fisher 1965; Valentine and Fisher 2000).
The distribution of the stratified facies to paleohighs and the massive facies within depressions suggest that they can be characterized as over-bank and paleovalley facies (Schumacher and Schmincke 1990). In this view, scoria accumulations at the facies transition are likely remnants of pumice levees, and their presence where the massive facies thins out suggests that the paleorelief was not high enough at these locations to cause the deposition of the stratified facies. The fact that the stratified facies is a lateral variation of the massive facies implies their simultaneous deposition. Both the
synchronous and axisymmetric nature of the deposits favor the interpretation of the Okmok II deposits to have been produced by a single density current. The apparent contradiction of coexisting pyroclastic flow and surge within the same current can best be explained by a segregated pyroclastic density current. In this hypothesis, the current consists of a highly concentrated base that produces massive deposits and an overriding dilute cloud that sediments stratified deposits preferentially on hills (Fisher 1965;
Denlinger 1987; Valentine, 1987; Fisher 1990; Baer et al. 1997; Burgisser and Bergantz 2002).
Interactions of the density current with topography
To the southwest of Hourglass Pass (Fig. 1), the pyroclastic density current traveled over successive ridges, leaving both stratified and massive facies in the small valleys that separate these ridges. The pumice levee situated on a hill four kilometers before the first ridge (AOK100, Fig. 1) indicates that the transition between dense part and dilute cloud occurred at 70 m above the lowlands before the ridge. Considering that similar transitions exist between the other massive and stratified outcrops, one can infer that the dense part was less than 100 m thick after the first ridge, and about 20 m thick after the second ridge. The first and second ridges are ~120 and ~130 m high, respectively. How can the dense part overcome ridges that are thicker than the current itself? Woods et al. (1998) proposed that ridges higher than a given gravity current could be overcome by the filling-up of the height difference by the filling-upstream current. Such a process is predicted to
significantly reduce the thickness of the deposit after the crossing, but would not affect the transport capacities of the current (Bursik and Woods 2001). On the other hand, if the basal part had enough momentum, it could overcome the ridge while maintaining a supercritical regime. The sudden loss of momentum would then enhance sedimentation at the ridge, and thickening of the deposits accompanied by decrease in grain size would be expected just before or just after the ridge. Drastic thickness reduction of the massive deposit across the second ridge (from >19 m to 1.5 m) is consistent with both partial blocking and excess momentum with thickening before the ridge. Similar measurements are unfortunately not possible across the first ridge because the base of the deposit is
buried on both sides. However, there are no deviations in either grain size decrease or componentry across both ridges when compared to an unobstructed pathway, which is inconsistent with an excess momentum (section Ic, Fig. 11 and section IIa, Fig. 14b). Thus, the massive deposit most likely results from partial blocking and filling-up of the dense part across the ridges (Woods et al. 1998).
The stratified facies does not noticeably vary in thickness, grain size, or componentry across the three first ridges, when compared to an unobstructed pathway (section IIIa, Fig. 15a and section IIb, Fig. 14b). This invariance suggests that the three first ridges did not affect the dilute part of the density current, most likely because the current was much thicker than the ridges. The fourth ridge, however, caused significant decrease in
thickness and grain size with enrichment in glass and crystal. A sudden thinning of the cloud because of partial blocking could cause such a change, but would not affect componentry. Most likely, the thick dilute current became buoyant at that point, preferentially entraining light scoria while lifting off.
The above data help in reconstructing a likely scenario of emplacement (Fig. 19). The match in size distribution between stratified deposits and the coarser part of the
associated dense deposits (Fig. 14c) is consistent with both the dense and dilute parts being in dynamic equilibrium and constantly exchanging particles with each other before decoupling at the first ridge (Fisher 1995). After being blocked at the first ridge, the basal part thickened until this ridge was crossed. The process repeated at the second ridge, but the upstream flux was not sufficient for the dense part to cross the third ridge.
four ridges. After the fourth ridge, the upper cloud became dilute enough to buoyantly lift off.
Travel of the density current over water
The entrance of a pyroclastic current into the water has been reviewed by Cas and Wright (1991) and possible scenarios abound (e.g., Legros and Druitt 2000). Yet, cases similar to Okmok, where currents traveled over water and deposited analyzable deposits on a distant shore are notably infrequent (Suzuki-Kamata 1988; Fisher et al. 1993; Carey et al. 1996; Allen and Cas 2001).
The most striking difference between deposits on Umnak and the ones on Unalaska is the complete absence of massive facies on the latter island. The facies transition localized on the south side of Idak plateau (Fig. 13) suggests that the dense part of the density current was ~120 m thick when it reached the east coast of Umnak. Crossing of Umnak Pass strait thus decoupled the two parts of the density current, and the dense part dove into the waters. Geologic cases of dense flows diving into the sea are multiple, such as the Roseau (Carey and Sigurdsson 1980), the Grande Savanne (Sparks et al. 1980), and the Krakatau 1883 (Mandeville et al 1996) ignimbrites. Unfortunately, at Okmok, the undisturbed nature of the massive facies at shore and the lack of underwater sampling limit the investigations on the interactions between hot pyroclasts and seawater (e.g., Sigurdsson and Carey 1989). Most of the mass of the Okmok pyroclastic current did not cross Umnak Pass, unlike the Ito pyroclastic flow, which ran across a shallow lake of several tens of kilometers without leaving deposits at the bottom of the lake (Baer et al. 1997), or the Campanian ignimbrite, which traveled over water to produce thick deposits across the 35-km-wide Bay of Naples (Fisher et al. 1993).
Whether the crossing affected the dilute cloud can be assessed by comparing the stratified facies between the two islands. Beyond the variability in grain size distribution inherent to the stratified facies, the sorting of the basal crudely stratified deposit on Unalaska matches that of individual layers found on Umnak (Fig. 20a). This and
stratigraphic correlations suggest that the basal unit on Unalaska is the lateral equivalent of the products of the dilute cloud on Umnak. Component analysis of this unit, however, indicates that it is very lithic poor (Fig. 20b). This componentry remains similar over the whole island (Fig. 15b), suggesting that the sorting occurred at sea. Preferential loss of dense lithics during transport across water has also been reported for the Krakatau 1883 ignimbrite (Carey et al., 1996), and the Kos Plateau Tuff (Allen and Cas 2001). Freundt (2003) demonstrated this density-selective process with flume experiments simulating the entrance of pyroclastic currents into the sea. The key idea is that once lithics touch the surface of the water, they immediately sink; lithics are thus removed from the transport system of the dilute current, whereas the low density of the scoria ensures their
preservation within the transport system. Following this reasoning, the high lithic content of the upper layer becomes problematic. How to preserve lithics within the cloud across the 8-km strait? The answer is probably linked to pumice rafts, which are large
accumulations of low-density clasts on the sea surface generated by fallout or pyroclastic currents traveling over water (Whitham and Sparks 1986). Because densities and
porosities of pumice and scoria have similar ranges, both pumice and scoria rafts share similar floatation properties (Gardner et al. 1996). If the scoria rafts produced by
Okmok’s eruption became continuous and thick enough, they could act as a skin over the water, bouncing dense clasts as the ground would. In other words, artificial enhancement
of the water surface tension could preserve lithics within the traveling current, thus allowing a lithic-bearing layer of pyroclasts to sediment over Unalaska. Note that the lithic-rich layer irregularly found at the base of both facies on Umnak Island is absent on Unalaska Island, as it cannot be correlated to the upper layer on Unalaska. Its absence after crossing the water is consistent with decreases in lithic size observed in similar lithic-rich ground layers of the Taupo ignimbrite (Wilson 1985) and the Ata pyroclastic deposits (Suzuki-Kamata 1988) after those currents crossed water. Interestingly, both layers on Unalaska are enriched in large (~1 φ) crystals in the coastal sections (e.g., Fig. 20b). Unfortunately, no satisfactory explanation for this local enrichment (or depletion in fine scoria) has been found.
The fine sand units with erosive contact atop stratified deposits are linked with the entrance of the density current into Umnak Pass (Fig. 18). The peculiar location of this deposit, higher than the mean high tide (the modern range of maximum tide is 1.2 m at Chernofski Harbor, near AOK150, Fig. 1) but below 15 m, and its stratigraphic
characteristics suggest it was produced by a tsunami generated by the density current. The increase in lithic content of these sands also suggests water transport because hydraulic sorting is detrimental to scoria deposition but favorable to denser clasts
deposition. In this view, the partially eroded basal unit likely represents flooding and the thick bimodal unit atop corresponds to tsunami backwash. The partial preservation of the lower stratified pyroclastic unit (AOK189) indicates that the tsunami wave(s) occurred after the dilute current.
The highest locality on the plateau of Unalaska (349 m, AOK145, Fig. 1) consists of only the upper stratified unit, which indicates that the current responsible for the basal
unit was less than 300 m thick, and that a thicker current deposited the upper unit. The sharp decrease in grain size between the low sites on the coast of Unalaska (section IIIa) and the high plateau (section IIIb) suggests that the 100-m sea cliff acted as a significant topographic barrier to the dilute current, which is consistent with a 300-m estimate. Two possible explanations can be put forward for the curious bimodality displayed by the near-shore upper unit samples (Fig. 16). First, this localized fines increase could result from short-lived aggregates formed either by electrostatic forces or by excessive moisture in the dilute cloud (e.g., ch. 16 in Sparks et al. 1997). Second, it could result from local steam explosions at the sea interface (e.g., Freundt 2003).
Similar contrasting behaviors of dense and dilute flows encountering seawater have also been reported in the literature. In the 1883 Krakatau eruption, one of the best studied examples, dense parts of the flow left hot massive deposits on the subhorizontal seafloor surrounding the caldera, while hot dilute parts of the flow traveled tens of kilometers over the sea (Carey et al. 1996; Mandeville et al. 1994; Mandeville et al. 1996). During the 1902 eruptions of Mt Pelée, pyroclastic currents entered the sea and their dense part broke telegraph cables nearly 20 km offshore, while associated dilute clouds ran out into the harbor and set fire to anchored ships (Lacroix 1904). In the on-going eruption of Montserrat, basal flows were witnessed to enter the sea and generated a zone of intense boiling, while the overriding ash cloud passed over the surface (Cole et al. 1998).
Estimates of dynamic parameters from density current deposit data
The angular nature of the scoria found in the stratified deposit suggests that clast rolling played a negligible role during sedimentation, and the good sorting of most bulk samples (σ~1) implies deposition occurred either rapidly or steadily. On Unalaska, the
absence of over-thickening of the stratified facies in depressions and troughs suggest no significant downhill drainage of the depositional system (cf. Fisher 1990) occurred. These observations are best explained if the current bears a weakly developed
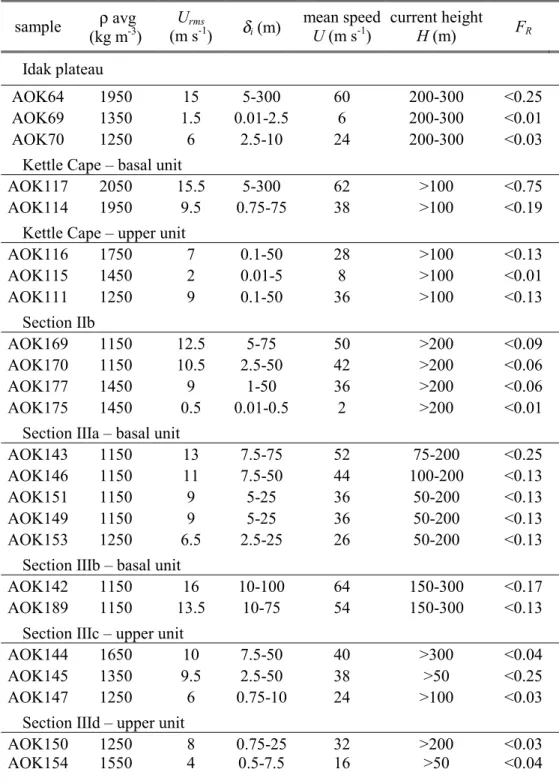
sedimentation system, with deposition mainly occurring by suspended load fallout. It is possible to retrieve dynamic variables from deposits of such a dilute cloud with the kinematic template proposed by Burgisser and Bergantz (2002).
Following Burgisser and Bergantz (2002), we assume that, at a given location, the dilute cloud is most likely to sediment particles that decouple from motions due to turbulence. Such particles transiently gather within the current, and their characteristics can be tracked by looking at ΣΤ near unity and ST at unity (Equs. 1 and 3, see Methods and theory). The weak skewness of the size distributions guided the choice that the median size of the deposit matches ΣΤ =1, and that the condition ST =1 lies within 90% of
the size distribution. Thus, a value of Urms from ΣΤ and a range of δi from ST can be
calculated for each location. It should be kept in mind that speeds given therein are not absolute because of the lack of experimental support of this theory, but they are believed to define meaningful trends.
To illustrate this inverse modeling, below is the retrieval of the dynamic parameters of the current that traveled across Unalaska plateau (section IIIa in Fig. 1). Using the mean particle density obtained from bulk component data (1150 kg m-3, Fig. 15c) and Equs. 1-4, the size distribution can be plotted against Urms (Fig. 21). The median grain size (50
wt.%) of each sample is then matched at ΣΤ =1 and the size distribution is represented by a box that indicates 5, 16, 50, 84, and 95 wt.%. This match gives a value of Urms for each
section IIIa in Fig. 22). On the obtained graph are three curves for key values of ΣΤ (10 -0.5, 1, and 100.5) and six curves for S
Τ =1, which correspond to various values of the maximum eddy size δi. The 5 and 95 wt.% marks of each distribution give upper and
lower limits for δi, from which Froude numbers are calculated (Equ. 4, Table 2).
Dynamics of proximal deposition
Reverse modeling of the stratified deposits on Idak plateau indicates that speed sharply decreases from the northern edge inwards (Fig. 22). No significant obstacle, however, could explain such a deceleration. The shape of the plateau and the high variability in thickness and grain size of the related stratified deposits suggest that the plateau acted as an obstacle, forcing the density current to flow around it. The peak at the southwest tip thus sheltered the rest of the plateau and its altitude gives an upper boundary to the current thickness. Using stratigraphic constraints (Fig. 13A), the density current was thus ~300 m thick near Idak plateau with most of its mass concentrated in the bottom third. Deposits recorded the cross-stream motions of the dilute cloud overflowing on the plateau, which were small (6 to 24 m s-1, Table 2) compared to its 60 m s-1 along-stream speed at the plateau edge (AOK64 in Table 2).
The paucity of data limits the interpretation of the inter-layer variations within the stratified deposit because only deposits at Kettle Cape contain abundant crossed and planar bedding. Data form this locality simply suggest that the basal lithic-rich unit was deposited by a more energetic current/pulse than the upper scoria-rich unit (Table 2). A similar basal unit has been described at Unzen, where it is thought to originate from the interface between the dense and dilute parts of the current (Fujii and Nakada 1999).
The average speed of the pyroclastic density current and the volume of inland deposits can provide an upper estimate of the magma discharge rate. Assuming that speed
estimates near the shore (~60 m s-1; Table 2) are representative of the average current velocity, the 24 km3 of inland deposits took at least 250 s to sediment. Using 1450 kg m3 for average density gives a maximum discharge rate <1.4×10¹¹ kg s-1 for the climactic phase of the Okmok II eruption. Of course, the real value is expected to be much lower because sedimentation is unlikely to be instantaneous.
Dynamics of distal decoupling
The distal, decoupled behavior of the current can be constrained by its interactions with the sea. The velocity of the current across Unalaska plateau decreases linearly over more than 20 km (section IIIa, Fig. 22). Compared to this remarkably regular trend, localities near the shore are shifted towards higher speeds (section IIIb, Fig. 22). It is thus likely that the cliffs that fringe Unalaska plateau abruptly decelerated the current. The range of buoyancy frequencies given by ST and estimates of the current thickness maximize the
Froude number at 0.25 at the coast (Table 2). The height ratio between the cliff and the current is 0.3 to 0.5. The current is thus subcritical with a modest height ratio, which suggests that cliffs blocked a significant portion (up to 100 m) of the dilute current (Baines 1995). On the plateau, the current slowed down to about 40 m s-1 and remained subcritical with FR < 0.1 (Fig. 23b). Both the deceleration and the abrupt thinning of the
deposit between the coast and the plateau are consistent with an enhanced sedimentation caused by partial blocking. Reverse modeling of the upper layer indicates a similar steep decrease in speed at the edge of Unalaska plateau (sections IIIc-d, Fig. 22). The elevated localities bearing the upper unit suggest that the associated dilute cloud was thicker than
300 m. Thus, the current that deposited the upper unit was also subcritical (Table 2), but thicker and slower than its predecessor (Fig. 23c).
How fast was the tsunami that reached Unalaska coast (Fig. 23a)? Tsunami wave motion is commonly treated with the shallow-water approximation, and the short travel across the strait can be best described with a solitary wave (Watts and Waythomas 2003). The solitary wave speed UW is expressed as a function of the water depth D and the wave
amplitude A (e.g., ch. 7 in Kundu 1990): + = D A gD UW 2 1 (5)
Umnak strait averages 50 m depth, with a maximum of 100 m, and the wave amplitude reached 15 m. The tsunami thus traveled across the strait at speeds between 25 and 34 m s-1, which is, as expected from stratigraphic evidence, slower than the 54 m s-1 estimate for the dilute cloud (Table 2).
Interactions of the current with hills are another effective way to constrain decoupled behavior. Using the evolution of the current speed over the relatively smooth plateau on Unalaska as a reference to understand the effect of the southwestern ridges, calculations indicate that the dilute current lost speed in a stepwise fashion while crossing the ridges (section IIb, Fig. 22). Importantly, this stepwise deceleration was not apparent from the grain size distribution data alone. The speed step across the second ridge has a
comparable magnitude to that caused by the sea cliff on Unalaska, whereas the speed decrease across the third ridge is modest. The current abruptly reached a low value of Urms after the fourth ridge, which is consistent with the transition from horizontal motion
localities (Table 2), and thus likely to be partially blocked by each successive ridge. These blockings most likely increased sedimentation within the current in a way similar to that on the west coast of Unalaska and this unloading helped to trigger the lift-off.
CONCLUSIONS
Geological and sedimentological data helped to reconstruct the dynamics of the Okmok II caldera-forming eruption. After a significant period of quiescence, the 2050 ± 50 BP volcanic episode started with an increasingly vigorous Plinian column of
rhyodacite, the umbrella cloud of which was diverted by strong SSE winds. After a second steady pulse, the column faded and the eruption stopped for a period of days to months. Eruptive activity resumed with unsteady phreatomagmatic explosions under strong westerly winds. As the explosive venting became more magmatic, the composition suddenly changed from rhyodacitic to andesitic. After expelling up to 0.25 km3 DRE of rhyodacite and up to 0.17 km3 DRE of andesite, the eruptive regime increased
dramatically because of caldera collapse to generate ~29 km3 DRE of pyroclastic density current deposits that completely covered the northeast part of Umnak Island.
Field evidences suggest that a single density current segregated into a highly
concentrated base and an overriding dilute cloud and produced the Okmok II deposits. While the basal part produced massive deposits, the dilute cloud preferentially
sedimented stratified deposits on hills. Topographic barriers made by four successive ridges on the southwest of the caldera reveal the dynamic behavior of these two parts. At first blocked by a first ridge, the basal part thickened until it could overcome it. The same process occurred over the next ridge, but the upstream flux was insufficient for the basal part to cross the third ridge. Meanwhile, the dilute part decoupled and overtook the dense
part to successfully cross the four ridges. This dilute cloud, however, was subcritical and the successive ridges caused its speed to decrease in a step-wise fashion. The slowed-down cloud buoyantly lifted-off when encountering more massive relief after the fourth ridge, most likely because the partial blockings had significantly unloaded the cloud by increasing sedimentation.
When reaching the east coast of Umnak, the density current was about 300 m thick with a ~120-m dense basal part that concentrated most of its mass. Crossing the 8-km wide strait between Umnak and Unalaska Islands decoupled the two parts of the current. While the dense part dove into the sea, the dilute cloud traveled over the water,
preferentially losing dense lithics it transported. On the other side of the strait, cliffs fringing Unalaska plateau decelerated abruptly the dilute, 200-m thick, subcritical current and blocked its bottom half, thereby enhancing sedimentation at shore. The slowed-down current continued its course on the plateau of Unalaska Island, gently decelerating for the next 20 km. Near the end of the eruption, the dilute current thickened to >300 m, slowed down, and deposited a unit enriched in lithics on Unalaska. Lithics were preserved during this late stage most likely because of extensive scoria rafts covering the strait between the two islands.
Pyroclastic density current decoupling can be triggered by both sea entrance and topography interaction. While seawater tends to absorb the dense part of the current and the lithics transported by the dilute cloud, topographical relief noticeably decelerates both parts of the current and favors sedimentation by partial or complete blocking. In the case of subcritical, dilute currents, the resulting unloading may drastically reduce the runout distance by triggering a buoyant lift-off.
ACKNOWLEDGMENTS
This manuscript presents research done as part of my Ph.D. thesis at the University of Alaska Fairbanks. Many thanks to S. Applegate, B. Browne, and K. Papp for performing the ungrateful task of field assistant, and P.J. Shamberger for helping me with the sieving. Many thanks also to J. Eichelberger for proposing and supporting the fieldwork, thus allowing the field assistants and myself to enjoy the sheer beauty of the Aleutian Islands. Field discussions with J. Larsen, T. Miller, J. Beget, and C. Waythomas proved extremely useful. Reviews by C. Mandeville and an anonymous reviewer greatly helped to improve the structure and the quality of the manuscript. Funding was provided by the Volcano Hazards Program of the US Geological Survey, through the Alaska Volcano Observatory.
REFERENCES
Allen SR, Cas RAF (2001) Transport of pyroclastic flows across the sea during the explosive, rhyolitic eruption of the Kos Plateau Tuff, Greece, Bull. Volcanol. 62:441-456.
Baer EM, Fisher RV, Fuller M, Valentine G (1997) Turbulent transport and deposition of the Ito pyroclastic flow: determinations using anisotropy of magnetic susceptibility, J. Geophys. Res. 102:22565-22586.
Baines PG (1995) Topographic Effects in Stratified Flows, Cambridge University Press, 482 p. Black RF (1975) Late quaternary geomorphic processes: Effects on the ancient Aleuts of Umnak
Island in the Aleutians, Arctic 28:159-169.
Burgisser A, Bergantz GW (2002) Reconciling pyroclastic flow and surge: the multiphase physics of pyroclastic density currents, Earth Planet. Sci. Lett. 202:405-418.
Bursik MI, Woods AW (2001) The effectof topography on sedimentation from particle-laden turbulent density currents,J. Sediment. Res. 70:53-63.
Byers FM (1959) Geology of Umnak and Bogoslov Islands, Aleutian Island, Alaska, U.S. Geol. Surv. Bull. 1028-L:107-367
Byers FM Jr (1961) Petrology of three volcanic suites, Umnak and Bogoslov Islands, Aleutian Islands, Alaska, Bull. Geol. Soc. Am. 72:93-128.
Carey SN, Sigurdsson H (1980) The Roseau Ash: deep-sea tephra deposits from a major eruption on Dominica, Lesser Antilles Arc, J. Volcanol. Geotherm. Res. 7:67-86.
Carey S, Sigurdsson H, Mandeville C, Bronto S (1996) Pyroclastic flows and surges over water: an example from the 1883 Krakatau eruption, Bull. Volcanol. 57:493-511.
Cas RAF, Wright JV (1987) Volcanic Successions: Modern and Ancient, Allen & Unwin, London, 528 p.
Cas RAF, Wright JV (1991) Subaqueous pyroclastic flows and ignimbrites: an assessment, Bull. Volcanol. 53:357-380.
Cole PD, Calder ES, Druitt TH, Hoblitt R, Robertson R, Sparks RSJ, Young SR (1998) Pyroclastic flows generated by gravitational instability of the 1996-97 lava dome of Soufriere Hills Volcano, Monserrat, Geophys. Res. Lett. 25:3425-3428.
Denlinger RP (1987) A model for generation of ash clouds by pyroclastic flows, with application to the 1980 eruptions at Mount St. Helens, Washington, J. Geophys. Res. 92:10284-10298. Druitt TH (1998) Pyroclastic density currents, in: Gilbert JS, Sparks RSJ (eds), The physics of
explosive volcanic eruptions, Geol. Soc. Spec. Publ., London 145:145-182.
Fisher RV (1965) Mechanism of deposition from pyroclastic flows, Am. J. Sci. 264:350-363. Fisher RV (1990) Transport and deposition of a pyroclastic surge across an area of high relief:
The 18 May 1980 eruption of Mount St. Helens, Washington, Geol. Soc. Am. Bull. 102:1038-1054.
Fisher RV (1995) Decoupling of pyroclastic currents: hazards assessments, J. Volcanol. Geotherm. Res. 66:257-263.
Fisher RV, Orsi G, Ort M, Heiken G (1993) Mobility of a large-volume pyroclastic flow -
emplacement of the Campanian ignimbrite, Italy, J. Volcanol. Geotherm. Res. 56:205-220. Freundt A (2003) Entrance of pyroclastic flow into the sea: experimental observation, Bull.
Volcanol. 65:144-164.
Freundt A, Wilson CJN, Carey SN (2000) Ignimbrite and block-and-ash flow deposits, in: Sigurdsson H (ed) Encyclopedia of Volcanoes, Academic Press, 581-599.
Fujii T, Nakada S (1999) The 15 September 1991 pyroclastic flows at Unzen Volcano (Japan): a flow model for associated ash-cloud surges, J. Volcanol. Geotherm. Res. 89:159-172. Gardner JE, Thomas RME, Jaupart C, Tait S (1996) Fragmentation of magma during Plinian
volcanic eruptions, Bull. Volcanol. 58:144-162.
Inman, DL (1952) Measures for describing the size distribution of sediments, J. Sed. Petrol. 22:125-145.
Kay SM., Kay RW (1994) Aleutian magmas in space and time in: Plafker G, Berg HC (eds.) The Geology of Alaska, Boulder CO, Geol. Soc. Amer., The Geology of North America, G-1:687-722.
Kundu PK (1990) Fluid mechanics, Academic Press, 638 p.
Lacroix A (1904) La Montagne Pelée et ses éruptions, Masson, Paris, 662 p.
Larsen JF, Nye, C (2003) Petrology and geochemistry of the 2050 yBP Okmok caldera-forming eruption: Origin of the voluminous basaltic-andesite pyroclastic deposits, Bull. Volcanol. in review.
Legros F, Druitt TH (2000) On the emplacement of ignimbrite in shallow-marine environments, J. Volcanol. Geotherm. Res. 95:9-22.
Lu Z, Mann D, Freymueller JT, Meyer DJ (2000) Synthetic aperture radar interferometry of Okmok Volcano, Alaska; radar observations, J. Geophys. Res. 105:10791-10806. Mandeville CW, Carey S, Sigurdsson H, King J (1994) Paleomagnetic evidence for high-temperature emplacement of the 1883 subaqueous pyroclastic flow from Karkatau Volcano, Indonesia, J. Geophys. Res. 99:9487-9504.
Mandeville CW, Carey S, Sigurdsson H (1996) Sedimentology of the Krakatau 1883 submarine pyroclastic deposits, Bull. Volcanol. 57:512-529.
Miller TP, Smith RL (1987) Late quaternary caldera-forming eruptions in the eastern Aleutian arc, Alaska, Geology 15:434-438.
Pope SB (2000) Turbulent Flows, Cambridge University Press, 771 p.
Pyle DM (1989) The thickness, volume and grainsize of tephra fall deposits, Bull. Volcanol. 51:1-15.
Riehle JR (1973) Calculated compaction profiles of rhyolithic ash-flow tuffs, Bull. Geol. Soc. Am. 84:2193-2216.
Schumacher R, Schmincke H-U (1990) The lateral facies of ignimbrites at Laacher See volcano, Bull. Volcanol. 52:271-285.
Sigurdsson H, Carey S (1989) Plinian and co-ignimbrite tephra fall from the 1815 eruption of Tambora volcano, Bull. Volcanol. 51:243-270.
Sparks RSJ (1976) Grain size variations in ignimbrite and implications for the transport of pyroclastic flows, Sedimentology 23:147-188.
Sparks RSJ, Bursik MI, Carey SN, Gilbert JS, Glaze LS, Sigurdsson H, Woods AW (1997) Volcanic Plumes, John Wiley & Sons, 574 p.
Sparks RSJ, Sigurdsson H, Carey SN (1980) The entrance of pyroclastic flows into the sea, I. oceanographic and geologic evidence from Dominica, Lesser Antilles, J. Volcanol. Geotherm. Res. 7:87-96.
Suzuki-Kamata K (1988) The ground layer of Ata pyroclastic flow deposit, southwestern Japan; evidence for the capture of lithic fragments, Bull. Volcanol. 50:119-129.
Thomas RME, Sparks RSJ (1992) Cooling of tephra during fallout from eruption columns Bull. Volcanol. 54:542-553.
Valentine G (1987) Statified flow in pyroclastic surges, Bull. Volcanol. 49:616-630. Valentine GA, Fisher RV (2000) Pyroclastic surges and blasts, in: Sigurdsson H (ed)
Encyclopedia of Volcanoes, Academic Press, 571-580.
Watts P, Waythomas CF (2003) Theoretical analysis of tsunami generation by pyroclastic flows, J. Geophys. Res. 108, B5:10.1029/2002JB002265.
Whitham AG, Sparks RSJ (1986) Pumice, Bull. Volcanol. 48:209-223.
Wilson CJN (1985) The Taupo eruption, New Zealand II. The Taupo ignimbrite, Phil. Trans. Royal Soc. London, A314:229-310.
Wolfe BA (2001) Paleohydrology of a catastrophic flood release from Okmok caldera and post-flood eruption history at Okmok volcano, Umnak Island, Alaska, M.S. Thesis, U. Alaska Fairbanks, 100 p.
Woods AW, Bursik MI, Kurbatov AV (1998) The interaction of ash flows with ridges, Bull. Volcanol. 60:38-51.
FIGURE CAPTIONS
Figure 1 Sample localities of the pyroclastic current deposits. Geographic names are also indicated and contours intervals are 150 m. Localities with an asterisk have been used to study local vertical variations and the corresponding grain size data are reported in Fig. 8. Data of the azimuth section are in Fig. 10, sections Ia-c in Fig. 11, Kettle Cape in Fig. 12, sections IIa-b in Fig. 14, sections IIIa-b in Fig. 15, and sections IIIc-d in Fig. 17.
Figure 2 Composite stratigraphic section of the Okmok II eruptive products. Filled symbols are scoria; open symbols are pumice. Fall deposits are scaled to their maximum thickness, whereas the massive and stratified facies are not to scale. Representative grain-size distribution with components are given for the fall sequences A (A1, AOK6), B (B2, AOK22), C (C1, AOK10), the massive facies (AOK104), and the stratified facies
(AOK117 for the basal unit and AOK70 for the upper unit). Samples AOK6 and AOK10 are at the location AOK131 while the sample AOK22 is at the location AOK86 (see Fig. 1).
Figure 3 Thickness distribution of fall sequences A1 and A2. Signs > and < indicate minimum and maximum thickness, respectively. Isopachs for each sequence are in centimeters; the star indicates the type section, and the median grain size Md (φ) is given for some locations.
Figure 4 Thickness distribution of fall sequences B1 and B2. Signs > and < indicate minimum and maximum thickness, respectively. Isopachs for each sequence are in centimeters and the star indicates the type section.
Figure 5 Thickness distribution of fall sequences C1, C2, and C3. Signs > and < indicate minimum and maximum thickness, respectively. Isopachs for each sequence are in centimeters and the star indicates the type section.
Figure 6 Thickness distribution of the pyroclastic current deposits. Massive facies, stratified facies, and post-depositional reworking are indicated. Massive facies thickness is in meters, while stratified facies thickness is in centimeters (bold numbers). The sign > indicates minimum thickness.
Figure 7 Field examples of the pyroclastic deposits. a. Massive facies near Hourglass Pass (AOK 103, see Fig. 1 for locations). Note the flat upper surface of the ~ 25 m thick deposit. b. Stratified facies at locality AOK69. Note the cross bedding inclined from the upper left to the lower right of the photograph.
Figure 8 Changes in sorting (σ) with median grain size for sample pairs within the
massive facies of the pyroclastic current deposits. Basal samples (filled symbols) are linked to the top samples (open symbols) of the same locality.
Figure 9 Component variation with grain size within the massive facies of the pyroclastic current deposits. The samples on the left-hand side are from the top of the deposit,
whereas the samples on the right-hand side are from the base (Fig. 1 for sample locations). Component data at each grain size of the sample displayed on the left is always subtracted from the comparative size class of the sample to the right. Each line thus corresponds to the difference in wt.% normalized to 100% for that component (lithic, scoria, crystal, or glass).
Figure 10 Grain size and component variation with grain size of the azimuth section (see Fig. 1). a. Changes in median grain size with azimuth from the caldera center (0° is North). b. Component variation with grain size. Component data at each grain size of the sample displayed on the left is always subtracted from the comparative size class of the sample to the right.
Figure 11 Grain size and componentry of the massive facies with distance from source. Component data at each grain size of samples to the left of the diagram is subtracted from the comparative size class of samples to the right. a. Changes in median grain size with distance from the caldera rim for sections Ia-c (see Fig. 1). b. Component variation with