HAL Id: hal-01493085
https://hal.archives-ouvertes.fr/hal-01493085
Submitted on 20 Mar 2017
HAL is a multi-disciplinary open access
archive for the deposit and dissemination of
sci-entific research documents, whether they are
pub-lished or not. The documents may come from
teaching and research institutions in France or
abroad, or from public or private research centers.
L’archive ouverte pluridisciplinaire HAL, est
destinée au dépôt et à la diffusion de documents
scientifiques de niveau recherche, publiés ou non,
émanant des établissements d’enseignement et de
recherche français ou étrangers, des laboratoires
publics ou privés.
Genesis and evolution of regoliths
C. Moragues-Quiroga, J. Juilleret, L. Gourdol, E. Pelt, T. Perrone, A. Aubert,
G. Morvan, F. Chabaux, Arnaud Legout, P. Stille, et al.
To cite this version:
C. Moragues-Quiroga, J. Juilleret, L. Gourdol, E. Pelt, T. Perrone, et al.. Genesis and evolution of
regoliths: Evidence from trace and major elements and Sr-Nd-Pb-U isotopes. CATENA, Elsevier,
2017, 149, pp.185-198. �10.1016/j.catena.2016.09.015�. �hal-01493085�
Genesis and evolution of regoliths: Evidence from trace and major
elements and Sr-Nd-Pb-U isotopes
C. Moragues-Quiroga
a,b,⁎
, J. Juilleret
a, L. Gourdol
a, E. Pelt
b, T. Perrone
b, A. Aubert
b, G. Morvan
b, F. Chabaux
b,
A. Legout
c, P. Stille
b, C. Hissler
aa
Catchment and Ecohydrology Research Group (CAT), Luxembourg Institute of Science and Technology (LIST), 41 Rue du Brill, L-4422 Belvaux, Luxembourg
b
Université de Strasbourg, LHyGeS (UMR 7517 CNRS/EOST/UdS), 1 Rue Blessig, F-67084 Strasbourg Cedex, France
c
INRA, UR 1138 Biogéochimie des Ecosystèmes Forestiers, Route d'Amance, 54280, Champenoux, Nancy, France
a b s t r a c t
a r t i c l e i n f o
Article history:
Received 11 February 2016
Received in revised form 14 September 2016 Accepted 18 September 2016
Available online 9 November 2016
Regoliths encompass different materials from the fresh bedrock to the top of the organic horizons. The occurrence and evolution of these materials are determined by deposition, erosion and weathering processes that are specif-ic for each region. The origin and interaction of the regolith layers are still important issues in the study of critspecif-ical zone functioning. Studies that attempt to understand the processes responsible for the structure and the evolu-tion of regoliths often focus either on the soil or on the bedrock compartment, and often from a narrowly focused approach using just a single tool such as major element patterns or mineralogy. This limits the understanding of the complete regolith composition and evolution. The present study proposes the combination of mineralogy, major and trace element concentrations, and Sr-Nd-Pb-U isotopes as an extremely useful procedure for tracking the spatial and temporal origin of regolith materials and understanding their stratification. This multi-tracer ap-proach was applied on a regolith profile from the south-western edge of the Rhenish Massif, which is characterised by the occurrence of slate bedrocks and overlying Pleistocene Periglacial Slope Deposits (PPSD). The data allowed the differentiation of three compartments within the regolith: 1) the organic compartment, where low206Pb/207Pb and87Sr/86Sr isotopic ratios re
flected the impact of atmosphere-derived components; 2) the PPSD compartment, whose upper horizons were characterised by the presence of atmosphere-derived particles rich in Cd, Sn, Sb, Hg and Pb and by relatively low206Pb/207Pb and87Sr/86Sr ratios, whereas the lower
horizons showed Nb enrichments in their matrix and a mineralogical composition pointing to ancient volcanic events; and 3) the weathered slate compartment, whose weathering progression and genetic relationship with the PPSD were particularly well tracked with87Sr/86Sr and143Nd/144Nd isotope ratios, (234U/238U) activity ratios
and positive Ce anomalies. The results prove the efficiency of radiogenic isotope measurements combined with the analysis of major and trace elements to complete regolith studies. Moreover, these isotopes and elements are shown to be potential geochemical tracers of exchange processes at the water-mineral interface. This ap-proach allows for thefirst time the description of an evolution scheme of a complete slate regolith, which covers a large part of the Rhenish Massif.
© 2016 Elsevier B.V. All rights reserved.
Keywords: Regolith Sr-Nd-Pb-U isotopes Trace elements Mineralogy Critical zone Periglacial coverbeds 1. Introduction
Regolith represents the unconsolidated mantle of weathered rock
and soil material on the Earth's surface (Soil Science Glossary Terms
Committee (SSGT), 2008). In a broader sense, it encompasses all
mate-rial from fresh rock to the atmosphere (Eggleton, 2001; Scott and Pain,
2008; NRC, 2001; Field et al., 2015). Regolith is a major compartment
of the critical zone wherefluxes of water, energy, solutes and matter
occur. The production of regolith from the original bedrock influences
the chemistry of surface waters and buffers the atmospheric CO2
concentration (Banwart et al., 2011; Berner and Maasch, 1996; West
et al., 2013). The regolith is the terrestrial environmental compartment where most of the water exchanges occur. Its bio-physico-chemical properties drastically impact the water that percolates and/or stores in its different parts (organic and mineral soil horizons, weathered bed-rock, etc.).
On a large scale from a space and time perspective, most of the in situ
regolith systems are polygenetic. As an example,Felix-Henningsen
(1994) showed that in the Rhenish Massif a weathering mantle representing the in situ regolith with a thickness up to 150 m was formed under warm and humid climates over a long period of time, from the Upper Mesozoic to the Tertiary. Additionally, loose materials produced in the in situ regolith move during erosion processes and con-tribute to form a transported regolith after redeposition. This means that ⁎ Corresponding author.
E-mail addresses:[email protected](C. Moragues-Quiroga),
[email protected](A. Legout),[email protected](C. Hissler).
http://dx.doi.org/10.1016/j.catena.2016.09.015
0341-8162/© 2016 Elsevier B.V. All rights reserved.
Contents lists available atScienceDirect
Catena
actual in situ regoliths recorded successive weathering and erosion
stages (Barbier, 2012). Therefore, in situ regoliths can also be considered
as polygenetic (Taylor and Eggleton, 2001). In the Rhenish Massif, the
soil representing the upper part of the regolith is essentially developed
from Pleistocene Periglacial Slope Deposits (PPSD -Kleber, 1997;
Semmel and Terhorst, 2010) - also called periglacial coverbeds - that cover the weathered in situ regolith to constitute a polygenetic regolith system. These PPSD originate from the combination of atmospheric
de-position, solifluction and/or cryoturbation of the former active rock
layer during the last glacial period (Kleber, 1997; Semmel and
Terhorst, 2010). The distances over which these materials were transported range from a local to regional scale. Hence, the alternation of such contrasting materials creates regolith components which may have a proximal, but not direct, genetic link to the underlying bedrock. Their differentiation in the regolith induced many lithic discontinuities that directly impact the evolution of the regolith and control
pedogene-sis, water infiltration, interflow and root penetration (Lorz and Phillips,
2006; Völkel et al., 2011).
Atmospheric deposition can significantly contribute to the
polyge-netic evolution of regoliths and mask the autochthonous contribution coming from the bedrock. On the one hand, atmosphere-derived an-thropogenic depositions of trace metals originating from agricultural tillage and fertilization, mining and other industrial activities tend to ac-cumulate in the upper soil layers due to their adsorption by organic
matter (Aubert et al., 2002; Hissler and Probst, 2006; Steinmann and
Stille, 1997).Stückrad et al. (2010)andStille et al. (2011)suggested, based on a combined trace element and Pb isotope study, a contribution of regional ore-vein derived elements to a regolith from the south east-ern edge of the Rhenish Massif and from the Vosges Mountains in France, respectively. On the other hand, loess that was deposited during the Pleistocene is widespread throughout Europe. These deposits form a more or less continuous belt along a 2000 km east-west transect from Great Britain and Brittany in northern France to the Dnieper Valley in
Ukraine (Catt, 1986; Paepe and Sommé, 1970; Rousseau et al., 2013,
2014). The origin of the European loess is still a matter of discussion.
Nevertheless, Sr and Pb isotopic data clearly demonstrate that the sources of the loess deposits are proximal and different for each region (Rousseau et al., 2014). Some of these aeolian deposits present a typical
volcanic mineralogical contribution (Kleber and Terhorst, 2013; Pissart,
1995; Semmel and Terhorst, 2010). Impacts of different Pleistocene
vol-canic eruptions were identified in the upper layers of the western
Euro-pean regoliths and can serve as efficient chronostratigraphic markers of
these systems (Wörner and Schmincke, 1984; Pouclet and Juvigne,
2009; Pouclet et al., 2008). The studies ofGallet et al. (1998) and
Chauvel et al. (2014)confirm an earlier conclusion reached byTaylor et al. (1983), that most of these aeolian deposits reflect the chemical composition of the upper continental crust.
The matter and energy exchanges in the critical zone are partly con-trolled by the structure and evolution of the regoliths; therefore it is es-pecially important to look at the entirety of the regolith when more than
one formation occurs in the same profile. Relevant tools are required to
improve the understanding of complex critical zone processes and to in-vestigate this hidden part of the ecosystems. Over the last decades, ra-diogenic isotope, trace element and mineralogical analyses have become state-of-the-art tools for the characterisation of deposit and
regolith formations (Debajyoti et al., 1967; Faure, 1986; Michard et al.,
1985; Taylor and McLennan, 1981). Sr, Nd, Pb and U isotopes together with trace and rare earth element (REE) distribution patterns have been shown to be very suitable tools to answer open questions about
regoliths formation (Aubert et al., 2001; Dequincey et al., 2002; Hissler
et al., 2015; Stille et al., 2009, 2011). However, these techniques are rarely applied concurrently.
In the present study, we combine mineralogical, major and trace el-ement and Sr-Nd-Pb-U isotope analyses in order to reach a more
com-prehensive characterisation of a regolith profile. Our objective is to
distinguish the different regolith strata by assessing their origin and
evolution, and by evaluating the chemical and isotopical impact be-tween the different strata. Hereby, we also address the question, how far dust from the late-Pleistocene volcanic eruption reached the south-western edge of the Rhenish Massif and mixed with the local loess deposits. To our knowledge, this is one of the few existing studies on a whole regolith system using such a multi-tracing approach. 2. Geomorphology and geological settings
The study site is a 4 ha beech (Fagus sylvatica L.) and oak (Quercus petraea (Matt.) Liebl.) dominated plateau located at an average altitude of 512 m asl in the Luxembourg Ardennes Massif (Oesling), close to the
Belgian border (latitude: 49° 50′ 05.5″N; longitude: 05° 47′ 47.6″E) (Fig.
1). The studied plateau is assumed to be representative of the regolith
landform unit called“haute surface de l'Oesling” in Luxembourg,
which developed at 500 m asl (Désiré-Marchand, 1985). A regolith
landform unit represents an area characterised by similar landform
and regolith attributes (Eggleton, 2001). Indeed, landforms are used as
surrogates for mapping regoliths since both are usually spatially and
ge-netically related (Craig et al., 1999). This“haute surface de l'Oesling” is
the Luxembourg part of an extensive Dano-Montian surface of the east-ern part of central Ardennes and Eifel at altitudes above 500 m (Demoulin, 2003) and correlates in Germany with the mapped“S2” sur-face, developed by pedimentation under semi-arid climate during the
Upper Eocene/Lower Oligocene (Huguet, 1998). Désiré-Marchand
(1985)explained that this“haute surface” was generated by gradual
re-development of the originalflat surface (S1 surface) and, consequently,
the above in situ regolith recorded many weathering stages during the geological times and can be considered polygenetic.
The geological substratum of the studied plateau is composed of
De-vonian metamorphic schists, phyllites and slates (Juilleret et al., 2011)
covered by Pleistocene Periglacial Slope Deposits (PPSD), which have been recognized to be the parent material of the soil in the Rhenish
Mas-sif (Müller, 1954; Deckers, 1966; Kwaad and Mücher, 1977; Sauer,
2002; Sauer et al., 2002a; Sauer and Felix-Henningsen, 2006). PPSD gen-erally consist of up to 3 different layers, with great variability in the oc-currence and thickness of the layers depending on the geographical and
topographical location (AG (Ad-hoc-Arbeitsgruppe) Boden, 2005;
Dietze and Kleber, 2010; Semmel and Terhorst, 2010), and can be de-scribed as follows:
– an upper layer (UL) found in every topographic position. This layer always contains admixed loess and presents a homogenous thickness of 30 to 70 cm. This layer is characterised by higher silt content in compar-ison to the underlying soil.
– an intermediate layer (IL) which contains rock fragments originating from the bedrock below and also loess, as its presence is strongly controlled by topography and bound to sites especially prone to loess deposition.
– a basal layer (BL) composed almost exclusively of bedrock fragments present in the surrounding slopes. During the formation of the basal layer, bedrock and periglacial debris formed the surface before the onset of loess accumulation. The BL is therefore almost free of allochthonous material like loess and varies greatly in thickness. Rock fragments are usually oriented parallel to the slope and may appear in multiple layers.
According toDietze and Kleber (2010), the above described layers
form a continuous drape in Central European subdued mountains like the Rhenish Massif and may occur as a complete series of 3 layers (UL-IL-BL) or may be reduced to only upper and basal layers (UL-BL).
The latter sequence (UL-BL) is the most widespread (Sauer and
Felix-Henningsen, 2006).
3. Methodological approach
3.1. Regolith stratigraphy and classification
Prior to the sampling, the studied regolith profile was observed and
(ii) by core drilling for the deeper part (140 to 735 cm depth). The fol-lowing description was made according to the Guidelines for Soil
De-scription (FAO, 2006) and completed with the description of the
subsolum material according toJuilleret et al. (2016). As regolith
encom-passes in its upper parts the solum (where pedogenic processes and biota are dominant) and in its lower parts the subsolum (where the orig-inal rock structure or fabric of the Bedrock is preserved), we described
and subdivided the profile according to solum and subsolum parts
fol-lowing the methodology ofJuilleret et al. (2016)(Table 1).
The solum (from−1 to 45 cm) showed 3 horizons described as follows
(Table 1): a very thin layer of fresh to highly decomposed organic material (O horizon) on top of a thin very dark greyish brown (10YR 3/2) silty clay
Ah horizon and a brownish yellow (10 YR 6/6) silty clay loam B Cambic horizon. Both organo-mineral horizons were not sticky, non-plastic and
showed a soft dry consistency. We estimatedfine and very fine root
den-sity on vertical plane at 8 to 16 roots cm−2for Ah and B horizons. No
earthworm channels were observed. Rock fragments of slate nature and
offine-to-medium gravel size (2 to 20 mm) were common in the Ah
and B horizons with respective volume contributions of 13% and 27%.
The upper Subsolum (45–140 cm) observed from the soil pit
(Table 1) is represented by: an olive yellow (2.5 Y 6/8) loam 2Cg1 hori-zon, and an olive yellow (2.5 Y 6/6) sandy loam 2Cg2 horizon. The
esti-mated root density on the vertical plane was below 8 roots cm−2in
both C layers. The stone content increases significantly in these two
ho-rizons and ranges from 40% to 50% of the volume for the respective 2Cg1 and 2Cg2 horizons. Common faint mottling of medium size and a few soft iron-manganese-oxide traces in the earth material around rock
fragments were observed. This upper subsolum is defined as Regolithic
layer (Juilleret et al., 2016).
The colours of the deeper subsolum material (140–735 cm) ranged
from light grey (2.5 Y 7/2) to brownish yellow (10YR 6/6). Gleyic
prop-erties were observed between 340 and 380 cm depth (WRB, IUSS
Working Group, 2015). As the material was mechanically weakened
by water, we classified it as saprolithic (Juilleret et al., 2016). From 450
to 735 cm depth, the material consisted of longer intact slate rock cores of several centimeters length (5 to 7 cm) mainly of grey colour (GLEY 1 5/N). Some of the longer cores showed cracks covered by sesquioxydes interpreted as a mechanical weakened part inherited
from the cleavage planes where watersflow. This deeper material is
classified as paralithic according toJuilleret et al. (2016).
The abrupt increase and the change in size of rock fragments be-tween B and 2Cg1 horizons allowed us to diagnose a lithic discontinuity. The irregular orientation of the longer axes of slate rock fragments inherited from the underlying geological substratum in the 2Cg1 and 2Cg2 layers were interpreted as indications of cryoturbation. Below the 2Cg2 layer, the observation of the cores from the deeper subsolum showed that rock fragments have a different orientation, mainly verti-cal. The orientation of the slate rock fragments is inherited from the
al-most vertical cleavage planes of the geological substratum (Juilleret et
Fig. 1. Situation and extension of the Rhenish Massif in Europe and location of the study site in the Luxembourg Ardennes region.
Table 1
Regolith structure and stratigraphic characterisation, including location of the samples (LD: lithic discontinuities; UL: upper layer; BL: basal layer).
al., 2011). This observation allows us to diagnose a lithic discontinuity between the 2Cg2 horizon and the geological substratum 3CR layer below.
According to the PPSD classification, we concluded that Ah and B
horizons developed in the UL. Indeed, Ah and B horizons present a higher silt content with a cumulate thickness of 45 cm, while the un-derlying 2Cg1 and 2Cg2 are characterised by a dominant amount of rock fragments originated from cryoturbation. Consequently, the
studied profile presents a transported regolith part made of PPSD
on top of the in situ slate weathered substratum and is organized as
follows (Table 1):
1) An organic topsoil, which encompasses the O horizon and consti-tutes the upper part of the solum.
2) An organo-mineral compartment developed in the PPSD which can be subdivided in solum and upper subsolum. The solum part is com-posed of Ah and B horizons. The upper subsolum can be divided into 2Cg1 and 2Cg2 horizons and contains regolithic material
accord-ing toJuilleret et al. (2016).
3) A lower mineral subsolum, which contains saprolithic and paralithic
materials according toJuilleret et al. (2016). This third compartment
represents the in situ regolith profile made of weathered slate
sub-stratum and referred to as 3CR and 3R layers. These layers are sepa-rated from the above PPSD compartment by a lithic discontinuity.
The studied regolith profile can be classified as Haplic HEMIMODER
(Jabiol et al., 2013) developing on a Dystric Cambisol (Ruptic,
Endoskeletic, Siltic, Protospodic) (IUSS Working Group, 2015) overlying
a Regolithic Saprolite (Gleyic, Ruptic, Rootic, Siltic, Skeletic) [Slatic] (Juilleret et al., 2016). In order to simplify the presentation of the results and the discussions, the name of the samples of the regolith layers (Table 1– OH, PPSD, SP) will be used in the following document as ref-erence of the regolith compartments.
We fulfilled the same pedo-stratigraphic report for four other
profiles in the same plateau area. We searched for a profile that
minimized the effect of erosion of the plateau unit (“haute surface
de l'Oesling”) and permitted thicker layers to be investigated.
Given the homogeneity we observed in situ and in later chemical analyses, this extensive sampling allowed us to choose the studied
profile as a representative example of the geological system, on
which we therefore focus this work.
The profile description is considered as a general framework that,
al-though very informative, does not allow by itself the distinction of the origin of the various contributions to the regolith composition, for which geochemical analyses are needed. Indeed, the pedo-stratigraphic study informs about the physical properties of the material and its
posi-tion within the regolith profile. But, this does not yield any precise
infor-mation about in how far the in situ soil has been modified by external
contributions such as aeolian depositions (loess or volcanic dust). In ad-dition, only geochemical and isotopic investigations allow us to under-stand the chemical evolution of the different parts of the regolith. 3.2. Samples collection and preparation
The sampling strategy was based on the description of the entire regolith presented above. We collected samples from the regolith pro-file including organic, organo-mineral and mineral material in three dif-ferent steps from the surface to the deeper layers. First, we manually collected the highly decomposed organic material of the OH topsoil
ho-rizon on a 4 m2area around the opened soil pit in order to obtain a
suf-ficient volume for further analyses. Second, we performed a soil sampling from the soil pit according to the ISO 10381 guidelines for soil sampling. Special attention was given to collect a representative amount of material for each horizon. According to the stone content, we collected 5 to 10 kg of material for each layer and homogenized it prior to taking representative aliquots for the laboratory analyses.
Third, we sampledfive layers from the core drilling from 140 cm
depth (weathered slate) to 735 cm depth (fresh slate bedrock). We
en-countered some difficulties in obtaining continuous cores as the
tech-nique used requires waterflow to remove cuttings (Gabrielli and
McDonnell, 2012). The material extracted from 140 to 450 cm was made of pieces of rock fragments with muddy matrix. All the samples were stored in plastic bags and air-dried in the laboratory before being prepared for analyses.
We sieved the organic topsoil sample to 1 mm in order to remove the coarse vegetal debris that could remain after the sampling of the
OH horizon. Then we fully ground it to 63μm in a Fritsch centrifugal
ball mill Pulverisette 6 in order to homogenise potential semi-decomposed organic particles. We sieved the solum and upper subsolum first at 2 mm in order to separate the coarse elements (N2 mm fraction),
composed of slate rock fragments, and thefine earth (b2 mm fraction),
called PPSD matrix in the manuscript. A representative aliquot of coarse
elements (PPSDce) was separated and ground to 63μm. Then, the fine
earth was sieved at 63μm for the mineralogical and chemical
character-isation of the PPSD matrix. The material collected from the core drillings
(lower subsolum samples - SP samples) was ground to 63μm in a Fritsch
centrifugal ball mill Pulverisette 6.
3.3. Analytical methods
We analysed aliquots of all regolith powdered samples for mineral-ogical contents by X-Ray Diffractometry (XRD, diffractometer RX Bruker, D5000) and Scanning Electron Microscopy (SEM, TESCAN
Vega IIfitted with EDAX X-ray energy dispersive spectrometer). We
used Inductively Coupled Plasma– Optical Emission Spectrometry
(ICP-OES, Thermo Fischer ICap 6500) and Inductively Coupled Plasma – Mass Spectrometry (ICP-MS, Thermo Elemental X7/Perkin-Elmer© DRC-e) for determining major and trace element concentrations
respec-tively for all samples after digestion by LiBO2alkaline fusion. The
analyt-ical errors wereb5% for both instruments.
Regolith sample aliquots used for isotopic composition analyses
were preliminary digested using HNO3:HF:HClO4concentrated acid
mixture in Savillex® Teflon vessels. We separated Sr, Pb and Nd from
other elements for radiogenic isotope analyses by extraction chroma-tography on Eichrom Sr Spec, TRU Spec and Ln Spec resins, respectively,
following the procedures ofGeagea et al. (2007)andGuéguen et al.
(2012)adapted fromPin and Zalduegui (1997)andDeniel and Pin (2001). U was separated by chromatography on Biorad AG1x8 anionic resin following procedures developed at the LHyGeS (Strasbourg,
France) (Chabaux et al., 1997; Dequincey et al., 2002; Granet et al.,
2010; Pelt et al., 2008). We measured Sr and Nd isotopic ratios on a
Thermo-Scientific Triton (TIMS) and Pb and U isotopic ratios on a
Nep-tune Thermo-Scientific multicollector (MC-ICP-MS). Mass fractionation
of Pb isotopic ratios was corrected online using a SRM 997 Tl isotopic
standard following the procedure of the laboratory (Stille et al., 2011).
Mass fractionation and the Faraday/SEM drift during U isotopic mea-surements by MC-ICP-MS were corrected by bracketing against the IRMM-184 natural U standard. The 2014 mean for the Sr SRM 987
stan-dard yields a87Sr/86Sr ratio of 0.71025 ± 0.00002 (2SD, n = 21) and for
the La Jolla standard a143Nd/144Nd ratio of 0.511842 ± 0.000006 (2SD,
N = 7). The Pb SRM 981 standard measurement during the session gave
the following ratios:208Pb/206Pb = 2.16604 ± 0.00002,207Pb/206Pb =
0.914651 ± 0.000007,206Pb/204Pb = 16.9267 ± 0.0004 (2SE), which
are within the 2014 0.2‰ dispersion observed in the lab and consistent
withinb1‰ with the reference values ofDoucelance and Manhès
(2001). The HU1 uraninite was measured 5 times during the uranium
MC-ICP-MS session and yields a (234U/238U) activity ratio of 0.9983 ±
0.0004 (2SD) consistent with secular equilibrium within 2‰. The
anal-ysis of the ID-blanks suggests a contamination ofb30 pg for Sr and Nd, ~
400 pg for Pb and 23 pg for U which is negligible compared to the
amount processed (N200 ng of Sr, Nd, Pb and U for all samples except
3.4. Statistical methods
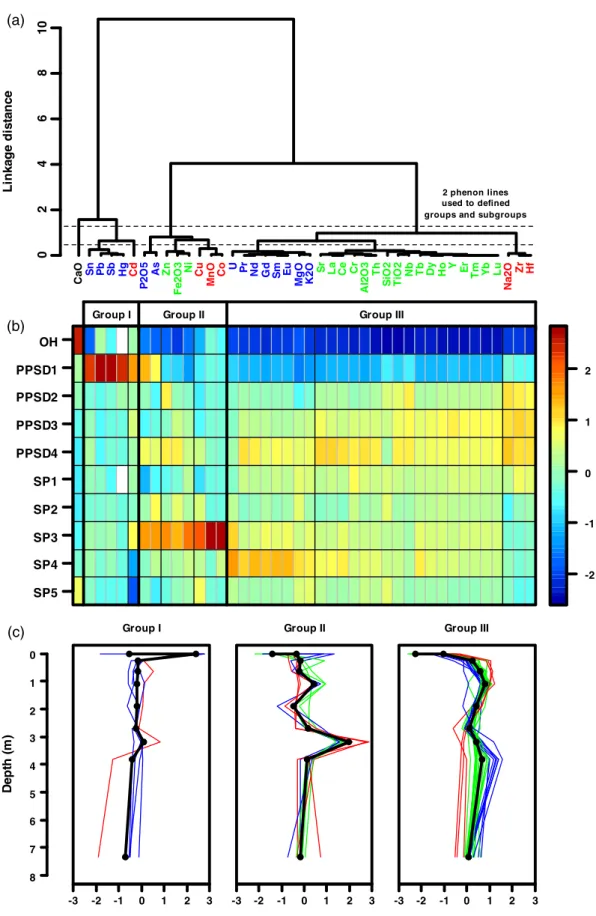
In order to determine groups of major and trace elements that follow similar variation patterns in the regolith with depth, we performed a
hi-erarchical cluster analysis (e.g.Hartigan, 1975; Kaufman and Rouseeuw,
1990; Kaufman and Rousseeuw, 2005). Such statistical technique has been widely used for drawing meaningful information from
geochemi-cal data (e.g.Bini et al., 2011; Levitan et al., 2015; Schot and van der Wal,
1992). For the linkage rule, we chose the Ward's method (Ward, 1963),
which has been successfully used in many previous studies (Gourdol et
al., 2013; Lin et al., 2014). For the linkage distance, the Pearson
correla-tion distance (1– Pearson correlation coefficient) was retained, which is
suitable for clustering variables (Reimann et al., 2008). Prior to the
anal-ysis, the most universal z-transformation was applied to each parameter (mean subtraction and division by standard deviation) to ensure that
each major and trace element is weighted equally (Templ et al., 2008).
The resulting dendrogram, illustrating the similarity of the parameters,
was cut using two phenon lines to define groups and subgroups of
pa-rameters. Defining the number of groups by selecting the position of
the phenon line up or down the dendrogram is a subjective evaluation
step (Güler et al., 2002). The heights of these two phenon lines were
retained by visual inspection of the dendrogram and the associated or-dered z-transformed concentrations matrix and gave us the most satis-factory geochemical parameters groups and subgroups in terms of variations with depth.
4. Results
4.1. Mineralogical composition of the regolith components
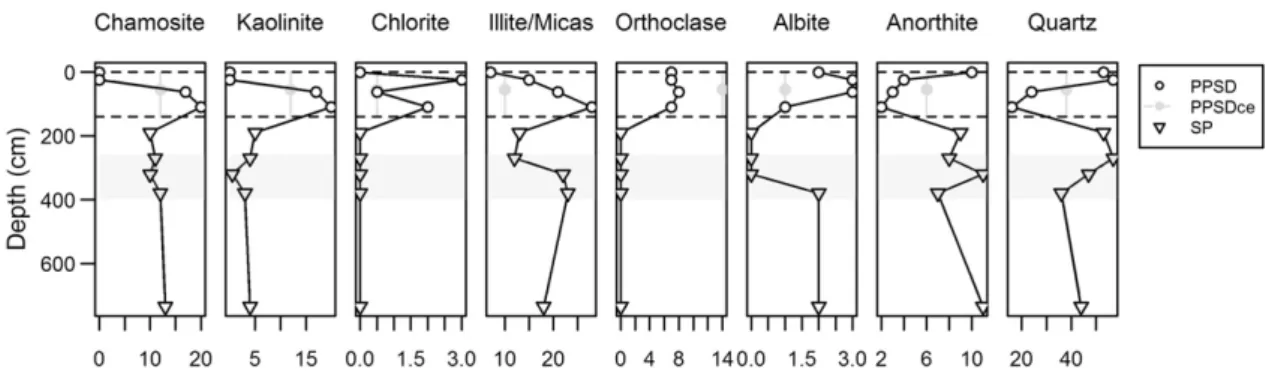
The XRD analyses (Fig. 2) indicate that PPSD3 and PPSD4 are
enriched in phyllosilicates and clay minerals, mainly chamosite, a Fe-rich polytype of chlorite, and kaolinite. At these depths, chamosite and kaolinite show relative abundances ranging from 17 to 20%. Other
chlo-rite polytypes are much less abundant (rel. abund.b3%). The illite/mica
group shows increasing abundances with depth in the matrix of the PPSD compartment between 7 and 28%. Similarly, one observes enrich-ments in orthoclase (rel. abund. 8%) in PPSD3 and PPSD4 and in albite (3%) at the PPSD2 and PPSD3 layers. Conversely, anorthite is depleted
between PPSD2 and PPSD4 (rel. abund.b3%), and quartz is depleted
at the PPSD3 and PPSD4 layers (rel. abund. 16 to 24% respectively), both compared to the above solum horizons (PPSD1 and PPSD2) and the subsolum saprolithic material below (SP), where the relative abun-dances scatter between 8 and 11% for anorthite and 36 and 57% for quartz. Rock fragments from the PPSD (PPSDce) generally present a mineralogical composition rather similar to the SP compartment, being slightly more enriched in kaolinite (12%) and notably in ortho-clase (14%).
SEM analyses on all PPSD samples indicate that in this compartment there are REE-bearing minerals such as monazite, xenotime, zircon and
florencites. Other Ti-bearing and iron oxide trace minerals observed at these depths are rutile, ilmenite and Ti-magnetite.
4.2. Chemical composition of the regolith components
The chemical composition of the entire regolith is shown inTable 2.
Na2O and TiO2are enriched in the PPSD matrix between PPSD2 and
PPSD4 compared to SP. K2O, Fe2O3, MgO and Al2O3tend to increase
with depth within the matrix of the PPSD compartment and reach values similar to those of the underlying saprolite (SP samples). CaO concentrations are high at the OH horizon and decrease with depth in PPSD, showing an important depletion on top of the SP regolith com-partment, where it slightly increases again towards the fresh bedrock.
On the contrary, P2O5is highly enriched at the top (PPSD1) and bottom
(PPSD4) of the PPSD and in SP3 similarly to MnO and Fe2O3.PPSDce is,
compared to the matrix between PPSD2 and PPSD4, depleted in TiO2,
K2O and Al2O3. PPSDce is enriched in Fe2O3with respect to the rest of
the profile, with the exception of SP3. SiO2, CaO, MgO and MnO show
in PPSDce similar concentrations as in the SP1 compartment, whereas
Na2O and P2O5PPSDce concentrations are rather close to the ones of
the soil matrix at the PPSD bottom horizons.
The trace elements can be classified in three groups according to the
vertical evolution of their concentrations within the regolith profile
(Fig. 3). Group I contains Cd, Sn, Sb, Hg and Pb. Their concentrations are higher in the top layer of the PPSD compartment and are low and
almost constant throughout the rest of the regolith profile (SP). Group
II is composed of Co, Ni, Cu, Zn and As, which present high concentra-tions in PPSD4 and are enriched in SP3. Group III includes trace elements having increasing concentrations with depth in the PPSD and a notable decrease in the concentrations between PPSD and SP. These elements can be divided in three subgroups according to their behaviour in the SP compartment: Group IIIa encloses those presenting a concentration increase at 380 cm depth, similar to Mg and K (U, Pr, Nd, Gd, Sm, Eu); Group IIIb those that, similar to Al, Si and Ti, remain stable below 200 cm depth (Cr, Rb, Sr, Y, Nb, Th, La Ce, Tb, Dy, Ho, Er, Tm, Yb, Lu) and Group IIIc those that continue decreasing after 200 cm depth, like Na (Zr, Hf).
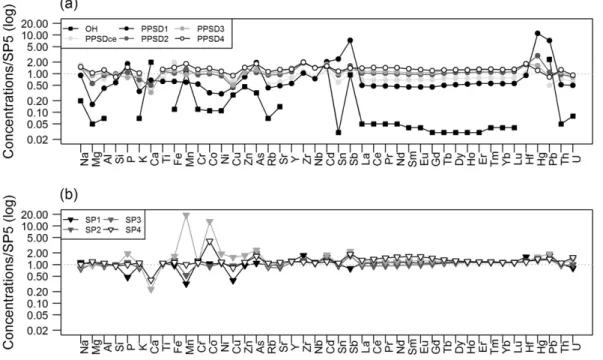
Major and trace element concentrations of PPSD and SP samples are normalized to the deeper SP lithic material (SP5), which can be
consid-ered, at this study site, as the fresh slate (Fig. 4). Compared to this local
reference, OH and PPSD1 are depleted in most of the elements, except the trace elements of group I. The other PPSD and SP samples are slightly enriched and show almost identical distribution patterns with ratios close to 1 for most of the analysed elements. However, the enrichments of the elements of Group II in SP3 and SP4, especially Mn, Co, As and U are different. Compared to the slate reference, Nb is generally slightly enriched in the PPSD compartment (ratio = 1.4), whereas the underly-ing SP samples present a ratio of 1.0. This is also not the case for the rock fragments of PPSD (PPSDce), whose Nb ratio is 0.77.
Post Archean Australian Shale (PAAS) normalized Rare Earth Ele-ment (REE) concentrations of PPSD and SP samples show similar
Fig. 2. Depth-dependent patterns of mineralogical composition from XRD analyses expressed in relative abundances (PPSDce: PPSD coarse elements; dashed lines: lithic discontinuities; shaded area: redox sensitive zone).
distribution patterns (not shown). They display middle REE (MREE) en-richments, which are more notable in coarse materials (PPSDce), in the matrix of PPSD4 and in SP, especially at SP4, as indicated by the (Eu/
Yb)Nratios (Fig. 5). Similarily, though to a lesser extent, (La/Yb)Nratios
point to a strong enrichment of light-REE (LREE) in PPSD4 and SP4,
whereas a positive Ce anomaly (CeN/CeN* = 1.05) is only observable
in SP3. Ce is an especially interesting element as it is one of the most re-active REE. Conversely to most of the other REE, it can pass from state
3 + to 4 + and precipitate as cerianite (CeO2) in oxidizing conditions
(Braun et al., 1990). Here, Ce anomalies are calculated as the enrichment of Ce with respect to other LREE (namely La and Pr) normalized to Post
Archean Australian Shales (PAAS) with the equation [CeN/CeN* = CeN/
(0.5LaN+ 0.5PrN)].
4.3. Pb, Sr, Nd and U isotopic compositions of the regolith components
All isotope data are given inTable 3.87Sr/86Sr and206Pb/207Pb ratios
are low in OH and PPSD1 (0.7218 and 1.153 respectively) and increase with depth through PPSD2 and PPSD3 up to 0.7387 and 1.220,
respec-tively (Fig. 6a and b).87Sr/86Sr ratio decreases in PPSD4 (0.7366),
in-creases again in the saprolithic material of the SP and has the highest
isotopic ratio in the lithic material at SP5 (0.7416).206Pb/207Pb ratio
still increases beyond PPSD4 and, after a remarkable decrease at the
lithic discontinuity between PPSD and SP, increases again until the
deeper part of the regolith (1.214), similar to87Sr/86Sr. The coarser
ma-terials of the PPSD (PPSDce) display87Sr/86Sr ratios close to the values of
the lower PPSD (0.73736) and high206Pb/207Pb ratios compared to both
PPSD and SP compartments. The143Nd/144Nd ratios show rather small
variations between 0.51192 and 0.51198 throughout the profile (Fig.
6c). The ratio is slightly higher for the OH horizon (0.51195) compared
to the other soil horizons (0.51192).
The (234U/238U) activity ratios scatter between 0.947 and 0.960
along the profile with the exception of the 270 and 320 cm depth
hori-zons. At these depths, SP2 and SP3 show (234U/238U) activity ratios
higher than 1 (1.05 and 1.04 respectively -Fig. 5d).
5. Discussion
5.1. Major and trace element behaviour within the studied regolith system The cluster analysis on the PPSD matrix and SP samples indicates that there are three groups of elements that have different origins and contrasted behaviours during weathering and pedogenetic processes (Fig. 3). Even though the coarse elements of the PPSD are not included in this statistical assessment, and thus uncertainty increases, the results Table 2
Major (% oxide) and trace element (ppm) composition of the regolith (D.L.: detection limit; NA: not analysed).
D.L. OH PPSD1 PPSD2 PPSD3 PPSD4 PPSDce SP1 SP2 SP3 SP4 SP5
Major elements (% oxide)
Na2O 0.01 0.05 0.24 0.38 0.38 0.40 0.44 0.30 0.21 0.24 0.27 0.26 MgO 0.015 0.10 0.30 1.02 1.69 1.92 1.57 1.90 1.85 1.73 2.18 1.83 Al2O3 0.02 1.31 7.70 16.49 19.12 22.86 13.11 19.13 16.69 18.76 20.01 18.29 SiO2 0.02 b0.02 37.82 62.82 60.27 52.92 66.35 62.51 64.16 58.53 59.41 64.35 P2O5 0.04 b0.04 0.27 0.16 0.12 0.22 0.21 0.07 0.17 0.29 0.15 0.15 K2O 0.01 0.28 1.31 2.63 3.41 3.92 1.96 3.62 3.07 3.72 4.19 3.77 CaO 0.03 b0.03 0.10 0.08 0.05 0.00 b0.03 0.00 0.00 0.04 0.06 0.15 TiO2 0.02 b0.02 0.55 1.01 1.05 1.12 0.64 0.96 0.86 0.93 0.95 0.87 Fe2O3 0.02 0.66 3.48 5.77 6.66 7.99 10.90 5.26 7.15 9.15 6.31 5.56 MnO b0.001 0.05 0.03 0.06 0.05 0.09 0.05 0.02 0.03 0.94 0.05 0.05 Trace elements (ppm) Cr 4 15.4 72.6 127.3 151.6 173.8 120.8 166.9 144.0 144.4 149.8 133.6 Co 0.4 1.7 5.0 15.3 17.5 20.9 20.5 16.0 13.8 200.8 61.9 15.3 Ni 5 8 20 60 71 78 83 74 74 131 79 68 Cu 5 12 20 20 23 39 30 17 41 68 36 44 Zn 11 46 84 145 107 147 110 96 115 175 116 101 As 1.5 2.5 14.9 8.2 9.5 13.8 10.1 8.3 14.9 18.2 12.5 7.6 Rb 0.4 12.2 74.1 159.3 175.6 193.3 91.0 166.6 146.1 167.0 187.7 170.4 Sr 2 14 48 94 110 126 61 96 81 102 113 98 Y 0.2 b0.2 15.8 31.5 38.7 36.6 22.2 34.8 31.8 32.6 33.7 28.0 Zr 1 b1 154 283 305 293 168 260 190 177 174 149 Nb 0.09 b0.09 10.28 19.87 19.44 19.66 10.77 15.96 14.61 14.94 15.28 13.93 Cd 0.12 0.25 0.32 0.25 0.27 0.25 0.2 0.25 0.24 0.28 0.19 0.16 Sn 0.45 0.12 9.63 3.76 4.13 4.63 2.44 4.13 3.72 4.30 4.45 4.04 Sb 0.2 0.4 2.9 0.6 0.5 0.5 0.4 0.3 0.7 0.9 0.7 0.4 La 0.09 2.23 22.03 45.30 51.45 61.33 30.62 48.00 41.00 48.29 57.40 44.04 Ce 0.14 4.26 43.15 91.90 102.90 128.00 61.53 96.75 82.07 109.30 124.10 89.11 Pr 0.015 0.502 4.876 10.340 11.640 14.550 7.052 11.580 9.511 11.880 15.150 10.180 Nd 0.06 1.87 17.93 37.48 42.35 54.10 25.80 43.11 35.83 45.39 59.72 37.89 Sm 0.015 0.313 3.250 6.923 7.778 9.712 4.968 8.233 7.068 9.039 11.680 7.216 Eu 0.005 0.058 0.659 1.408 1.562 1.875 1.030 1.602 1.458 1.871 2.348 1.471 Gd 0.013 0.176 2.682 5.668 6.465 7.161 4.099 6.494 6.111 7.474 8.833 5.970 Tb 0.003 0.029 0.446 0.916 1.074 1.104 0.670 1.001 0.973 1.097 1.187 0.892 Dy 0.01 0.17 2.81 5.80 6.89 6.81 4.11 6.21 5.99 6.50 6.76 5.41 Ho 0.002 0.036 0.601 1.201 1.451 1.395 0.847 1.286 1.250 1.326 1.340 1.112 Er 0.01 0.10 1.63 3.26 3.93 3.79 2.28 3.50 3.32 3.53 3.46 2.94 Tm 0.001 0.016 0.241 0.470 0.571 0.563 0.336 0.512 0.484 0.519 0.506 0.429 Yb 0.007 0.110 1.647 3.274 3.904 3.829 2.296 3.447 3.315 3.531 3.409 2.996 Lu 0.003 0.016 0.252 0.508 0.592 0.586 0.357 0.520 0.500 0.543 0.516 0.451 Hf 0.03 b0.03 3.98 7.53 8.02 7.93 4.55 6.99 5.49 5.16 5.18 4.40 Hg b0.001 b0.001 0.342 0.091 0.050 0.038 b0.001 b0.001 0.040 0.049 0.043 0.031 Pb 0.7 41.6 128.9 19.4 14.6 14.6 8.9 30.3 24.3 33.7 24.5 17.8 Th 0.06 0.66 7.07 13.21 15.07 17.26 10.12 14.53 13.22 14.43 15.21 13.71 U 0.03 0.33 1.93 3.14 3.14 3.51 2.45 3.09 3.82 5.22 5.84 3.83
as.hclust.dendrogram (*, "NA")
L in k ag e d ist an ce Ca O Sn Pb Sb Hg Cd P2 O 5 As Zn F e2O 3 Ni Cu Mn O Co U Pr Nd Gd Sm Eu Mg O K2 O Sr La Ce Cr Al 2 O 3 Th Si O 2 Ti O 2 Nb Tb Dy Ho Y Er Tm Yb Lu N a2O Zr Hf 02468 1 0 2 phenon lines used to defined groups and subgroups-2 -1 0 1 2 SP5 SP4 SP3 SP2 SP1 PPSD4 PPSD3 PPSD2 PPSD1 OH
Group I Group II Group III
(a)
(c)
(b)
8 7 6 5 4 3 2 1 0 De p th (m ) Group I -3 -2 -1 0 1 2 3 Group II -3 -2 -1 0 1 2 3 Group III -3 -2 -1 0 1 2 3Fig. 3. Hierarchical cluster analysis performed on major and trace elements: (a) dendrogram defined using Pearson correlation distance as distance measure and Ward's method for the linkage rule; (b) coloured z-transformed concentrations matrix (row names correspond to regolith layers, parameter columns are ordered as the dendrogram); and (c) z-transformed concentrations as a function of depth for the 3 parameter groups defined (the thick black lines correspond to the median of each group, the thin coloured lines correspond to individual parameters of each subgroup as defined by the colour of the parameter labels in the dendrogram (a)).
allow discerning the chemical zonations according to the soil fraction that is responsible for most of the processes described below.
Group I includes elements such as Cd, Sn, Sb, Hg and Pb, which are only enriched in the surface Ah horizon (PPSD1) and are probably atmo-sphere-derived and of anthropogenic origin. The Ah horizon is located directly under the organic horizon (OH) and is as a consequence rich in organic matter, which is known to trap heavy metals and
subse-quently release them by leaching into the soil (Hissler and Probst,
2006; Steinmann and Stille, 1997; Stille et al., 2009, 2011). This is
espe-cially observable in the Pb isotope data (Fig. 6). According to the work of
Redon et al. (2013), depth patterns of Sn, Sb, Hg and Pb present a dis-connection between upper soil horizons and the rest of the regolith as
well as the PPSD coarse materials (PPSDce;Table 2), supporting the
hy-pothesis that they do not derive from the underlying saprolite but from the atmosphere. In contrast is the slight Cd enrichment at 320 cm depth
(SP3) compared to the horizons underneath, which resembles that of the elements of Group II and thus cannot be attributed to anthropogenic deposition at the top of the regolith.
Group II comprises Co, Ni, Cu, Zn and As, which show similar
distri-bution patterns to P2O5, MnO and Fe2O3with a strong enrichment at
320 cm depth (SP3) in the saprolithic material. At the same time, Group IIIa comprises U and Pr, Nd, Gd, Sm, Eu, whose depth patterns
re-semble those of MgO and K2O with a strong enrichment at SP4. All of
them also show high concentrations in the lowermost horizon of the PPSD. These trace elements are sensitive to being mobilised during
changing redox conditions in the regolith profile, e.g. groundwater
tablefluctuations. The fractionation and mobilisation/accumulation
can be either direct by valence alteration into soluble/stable forms or due to the dissolution-precipitation of Fe and Mn-(oxy)hydroxides in which these trace elements get preferentially sorbed. Of particular in-terest here is the slight but meaningful positive Ce anomaly that can
be observed in SP3 (CeN/CeN* = 1.05 compared to ratios between 0.92
and 0.98 for the other samples). During water saturation periods (win-ter), the anoxic conditions in the saprolite result in a reducing environ-ment which favours the leaching of REE. In the formed solution, Ce, as the majority of the lanthanides, presents a trivalent state (3+). When
the water tableflows downwards (summer), water is mainly retained
only at the smallest pores of the soil aggregates and in the clay fraction of the saprolithic material. Oxygen can get into the interfaces, favouring
Ce3+to Ce4+oxidation. In these oxic conditions, Ce can precipitate as
Fig. 4. Major and trace element concentrations of (a) OH and PPSD samples and (b) SP samples, normalized to the SP5 sample concentrations, representing the fresh slate bedrock.
Fig. 5. Depth dependent patterns of PAAS-normalized LaN/YbNand EuN/YbNratios and Ce
anomaly (CeN/CeN⁎) (dashed lines: lithic discontinuities; shaded area: redox sensitive
horizons).
Table 3
Sr, Nd, Pb and U radiogenic isotope ratios of all analysed regolith samples (NA: not analysed). Sample 87 Sr/86 Sr 143 Nd/144 Nd 206 Pb/207 Pb 234 U/238 U OH 0.72181 0.511951 1.153 0.933 PPSD1 0.73023 0.511919 1.162 NA PPSD2 0.73399 0.511922 1.204 NA PPSD3 0.73866 0.511923 1.215 0.961 PPSD4 0.73657 0.511931 1.220 NA PPSDce 0.73736 NA 1.226 NA SP1 0.74141 0.511961 1.200 0.949 SP2 0.74205 0.511927 1.202 1.053 SP3 0.73912 0.511959 1.199 1.038 SP4 0.73915 0.511983 1.206 0.953 SP5 0.74160 0.511933 1.214 0.947
cerianite e.g. on the hydrated surface of manganese oxides (Braun et al., 1990; Steinmann and Stille, 1997). This means, in this case Ce might be mobilised from the upper horizons and immobilised at 320 cm depth. In agreement is the evolution of the U geochemistry within the studied
profile (Figs. 3 and 6, andTable 2). Uranium concentrations tend to
in-crease from 3.09 ppm at the top of the SP compartment to 5.84 ppm at SP4. Under oxidizing conditions, U can oxidise to the uranyl ion
(U(VI)O2+ 2) and form compounds that are soluble in water. As with
Ce, the uranyl ion can get released into the solution at SP1, migrate downwards and re-deposit as it co-precipitates with Fe oxy-hydroxides
at the“summer” redox interface (SP3-SP4) (Duff et al., 2002; Bruno et
al., 1995). In Fig. 6, the (234U/238U) activity ratios b 1 above SP2
(270 cm) and below SP3 (320 cm) (b0.96) but N 1 in between (N1.04)
indicate, respectively, a234U depletion and enrichment of the regolith.
During water-rock interaction,234U and238U have different mobilities,
with a preferential leaching of234U compared to238U due to the
so-called alpha recoil process (more details in e.g.,Chabaux et al., 2003,
2008; DePaolo et al., 2006, 2012). For a material old enough to be at
sec-ular equilibrium (i.e.,234U/238U = 1), such a process leads to a
preferen-tial enrichment of234U in waters compared to its parent238U, and hence
to (234U/238U) activity ratiosN 1 in the waters and b 1 in the residual
ma-terials (see alsoSchaffhauser et al., 2014; Pierret et al., 2014; Prunier et
al., 2015; and references therein). Thus, during long periods of water
saturation and intense weathering of the rock,234U is leached from
the minerals, giving (234U/238U) activity ratiosb 1 in the saprolithic
ma-terials. This seems to be the case in the studied saprolithic material
above SP2 and below SP3. In the studied regolith, the water table
fluctu-ates between 320 cm depth during low hydrological conditions and
108 cm depth during winter saturation periods (according tofield
mon-itoring hydrological data, not shown). Thus, we hypothesise that234U is
mobilised above 270 cm depth and potentially accumulated around the
permanent water table level (SP3–SP4), where the redox potential
al-lows the above-mentioned co-precipitation. Conversely, the perma-nently saturated layer between SP3 and SP5 (735 cm) favours the
downwardflow of234
U, whereas below SP5 depth we are on the imper-meable and slightly weathered slate bedrock. This hypothesis is sup-ported by occurrences of gleyic properties with rusty patches observed from drill cores of the saprolithic material between 340 and 380 cm depth, which correspond to strong reduction processes and
iron segregation (WRB,IUSS Working Group, 2015).
In summary, the depth patterns of the Ce anomaly and (234U/238U)
activity ratios together with the other redox sensitive elements, de
fi-nitely point to the effect of the seasonal water tablefluctuation between
108 and 380 cm depth. The regolith above SP1 is preserved from the weathering process and conserves element concentrations untouched. Whereas between SP1 and SP4, the historical exposure of the material to alternating oxic and anoxic conditions (redox conditions) favoured the dissolution-precipitation processes that control the dynamics of the redox sensitive and allied elements. Below SP4, most labile elements
may beflushed away from the saprolite into deeper groundwater.
On the other hand, the behaviour of all elements from Group III in the matrix of the PPSD compartment is also related to the stability of
some specific residual trace mineral phases. Zr and Hf reside in zircons,
Th in monazite, Y in xenotime and Nb in Ti-bearing minerals. Similarly, PPSD4, representing the lowermost part of PPSD matrix, is enriched in
LREE compared to the upper horizons (Figs. 3 and 5) pointing to an
im-portant presence of phosphate and LREE bearing trace minerals such as
monazite andflorencite. At last, the Eu positive anomaly of PPSD's
coarse materials (PPSDce), surely relates to their greater feldspars
abun-dance (Vázquez-Ortega et al., 2015) (Figs. 2 and 5).
Finally, vegetation life cycles (nutrition, evapotranspiration) might also have an important impact in the overall chemical composition. In this regolith, beech and oak have the greatest root density between 20
and 40 cm depth (up to 16 roots cm−2). The roots uptake of
macronu-trients and other oligoelements is probably a major cause of element fractionation between the upper and lower PPSD layers. In this sense, Ca must be accumulated in the OH horizon due to biological cycling
and litter decomposition (Stille et al., 2009). Phosphate concentration
is high in the Ah horizon for the same reason. Then it decreases at the level of the maximum root uptake at 20 to 40 cm depth (PPSD2-3). At these depths, also Mg, K, Fe, Al and most of the REE are depleted com-pared to the lower PPSD4 horizon. Further studies on the vegetation are needed to better understand its geochemical impact on the regolith studied here.
5.2. Impact of atmosphere-derived anthropogenic depositions on the PPSD
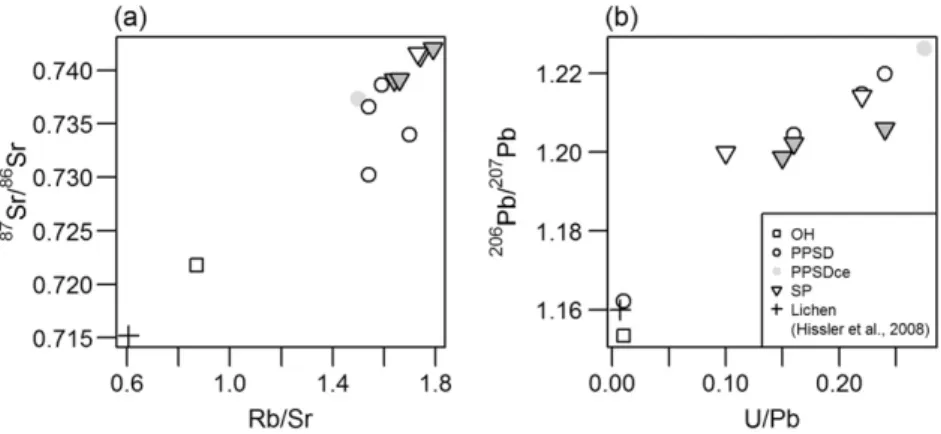
The87Sr/86Sr and206Pb/207Pb isotope ratios decrease with
decreas-ing depth within the organic (OH) and organo-mineral (PPSD)
com-partments (Fig. 6a and b andTable 3), whereas the corresponding
143Nd/144Nd ratios are only very weakly scattered, ranging between
0.51192 and 0.51195 (Fig. 6c andTable 3). The comparatively lower
Pb and Sr isotopic compositions of the organic compartment (OH
sam-ple) can be related to anthropogenic impacts (Stille et al., 2011). Indeed,
the current local atmospheric baseline isotopic compositions
deter-mined on lichens show significantly lower206Pb/207Pb (1.162) and
87Sr/86Sr (0.7152) but higher143Nd/144Nd (0.51205) ratios (Hissler et
al., 2008). In a87Sr/86Sr vs Rb/Sr diagram the PPSD data show a mixing trend with the OH horizon and the Ah organo-mineral soil horizon (PPSD1) with the lowest isotopic composition values and Rb/Sr ratios
similar to the lichen (0.87 and 1.54 respectively) (Fig. 7a). Similar
rela-tionships are observable in the206Pb/207Pb vs U/Pb diagram (Fig. 7b).
Again, OH and PPSD1 samples have Pb isotopic composition and U/Pb ratios similar to lichen (U/Pb = 0.01 for both samples). Therefore, the Rb-Sr and U-Pb isotope systems of the uppermost regolith samples are
strongly influenced by recent atmosphere-derived inputs. This is not
the case for the Sm-Nd isotope system, which is not to be affected by at-mospheric deposition (not shown). If mixing occurred between anthro-pogenic, atmosphere-derived and soil particles then the regolith isotope
data should describe a mixing hyperbola in the87Sr/86Sr vs.143Nd/144Nd
Fig. 6. Depth-dependent variation of (a)206
Pb/207 Pb, (b)87 Sr/86 Sr, (c)143 Nd/144 Nd and (d)234 U/238
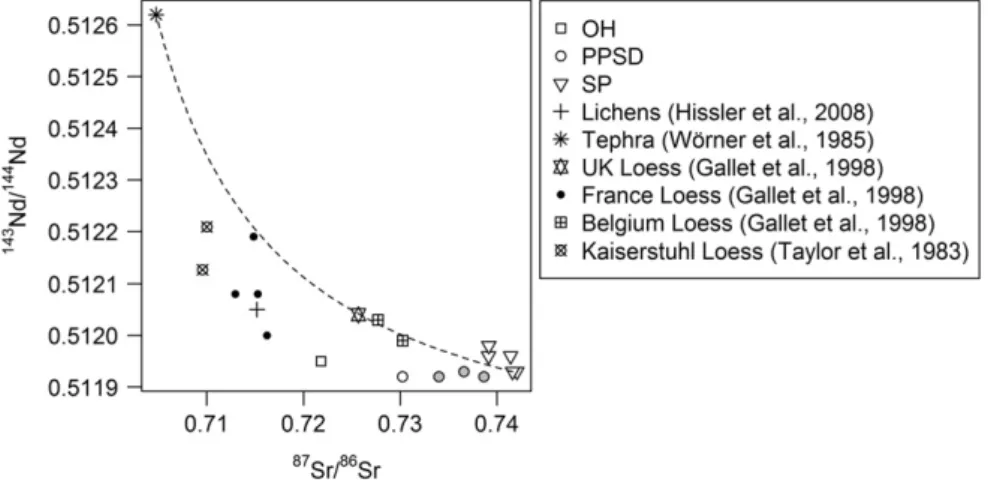
diagram (Faure, 1986). This is indeed the case (Fig. 8). The shape of the curve is controlled by the end-members Sr/Nd ratios. The atmospheric
end member is the lichen (Sr: 1.17 ppm, 87Sr/86Sr: 0.7152; Nd:
0.17 ppm,143Nd/144Nd: 0.51205) (Hissler et al., 2008) and the geogenic
end member corresponds to the lithic material representing fresh slate
bedrock (SP5) (Sr: 98.2 ppm, 87Sr/86Sr: 0.7416; Nd: 37.9 ppm,
143Nd/144Nd: 0.51193). The resulting Sr/Nd ratios are 6.9 for the lichen
and 2.6 for the slate. One calculates that the uppermost OH and Ah ho-rizons (PPSD1) contain up to 90% and 50% of recent atmosphere-de-rived Sr and 95% and 50% of recent atmosphere-deatmosphere-de-rived Nd, respectively. Such enrichments are rather surprising, suggesting that
these elements have been transported over distancesN20 km. The
clos-est active steel industrial parks are situated around 25 km southeast (Bissen, Luxembourg) and 120 km north-west (Liège, Belgium) of the studied site, and a historic mine of mainly Pb and Zn was located around 20 km north of the study site. Alternatively, these enrichments might be
attributed to the heavyfighting nearby during the “Battle of the Bulge”
in the vicinity of Bastogne during the Second World War (Cole, 1965).
5.3. Impact of volcanic events on the PPSD
In central Europe, the upper layer of PPSD (UL) often presents a typ-ical volcanic mineralogtyp-ical composition related to the Laacher See
Erup-tion in the late Pleistocene (12,900 years BP) (Kleber and Terhorst,
2013; Semmel and Terhorst, 2010; Pissart, 1995; Wörner and Schmincke, 1984).Wörner and Schmincke (1984)andWörner et al. (1985)also highlighted the very specific trace element and isotopical
composition of the Laacher See tephra, which permits its identification
and differentiation from other material contributions. These
mineralog-ical and isotopmineralog-icalfingerprints allow us to use the Laacher See deposits
as a stratigraphic marker (Schmincke et al., 1999). Nevertheless,
rela-tively older volcanic events took place in the same region, such as the
Rocourt (74–90.3 ka) and Eltville (16–30 ka) eruptions, whose tephras
spread in the south east of Belgium, central Germany and north of
Lux-embourg (Pouclet and Juvigne, 2009; Pouclet et al., 2008).Pouclet et al.
(2008)pointed out the potential of the Rocourt tephra as chrono-stratigraphic marker for the Upper Pleistocene loess deposits in these areas thanks to its glass fragment shape, chemical and mineral compo-sition, which differs from the Laacher See tephra.
One of the principal questions raised in this study concerns the strat-igraphic and pedogenetic evolution of the periglacial coverbeds (PPSD
compartment) and, more specifically, the origin of their constituting
mineral phases. Are these phases only derived from the underlying slate or do some of them have other origins; e.g. originate from volcanic dust and ashes from the late-Pleistocene Laacher See eruption, and reached also the south-western edge of the Rhenish Massif. Indeed
dur-ing solifluction processes the Laacher See tephra, which was already
de-posited, was admixed with other materials to become part of the upper
coverbed (Kleber, 1997; Schmincke et al., 1999; Semmel and Terhorst,
2010; Stückrad et al., 2010; Terhorst, 2007). Previous studies have shown that Laacher See particles have been incorporated to the upper
PPSD layer in central Europe (Kleber and Terhorst, 2013; Pissart,
1995; Semmel and Terhorst, 2010). At the same time, several tephra layers have been recognized in the Upper Pleistocene Loess deposits in Belgium, as the ones of the above mentioned Laacher See, Eltville and
Rocourt (Pouclet and Juvigne, 2009). Among those tephra sequences,
Wörner and Wright (1984)noticed that the Laacher See tephra has a phonolite-like mineral composition dominated by alkali feldspar, espe-cially sanidine phenocrysts, followed by plagioclase (mainly albite), haüyne, amphibole, clinopyroxene, sphene, Ti-magnetite, apatite, phlogopite and traces of zircon phenocrysts. The abundance of the dif-ferent observed mineral phases of the studied regolith vary along the
profile but manifest specific mineral enrichments in the matrix of the
basal layer of PPSD (PPSD3 and PPSD4), which might be related to a
Pleistocene eruption (Fig. 2).
In that regard, of great importance is thefinding of chamosite as a
main mineral phase (up to 20 vol.%) in the matrix of the basal layer of
the PPSD compartment. It is significantly less present in the saprolithic
material (SP, 10–13 vol.%). This mineral phase is the Fe-rich
end-mem-ber of the chlorite group. Its presence explains the rather high Fe2O3
contents (7–11 wt.%) in the basal layer of PPSD. Chamosite is typically
a replacement mineral phase and alteration product of ferromagnesian
minerals such as pyroxenes and amphiboles (Deer et al., 1974).
Howev-er, also other mineral phases confirm the presence of tephra in the basal
layer of PPSD, such as kaolinite, which results from feldspar alteration and reaches 20 vol% which represents a strong enrichment compared
to the underlying saprolite (SP, 3–5 vol%). Primary feldspar minerals
such as albite and orthoclase are also observable in smaller quantities in the PPSD. Orthoclase, respectively sanidine (a not distinguishable polymorph of orthoclase), occurs only in PPSD (up to 8 vol.% in the ma-trix and 14 vol.% in the coarse materials) and is not at all observable in SP.
In a similar way, one might suggest that the titanium enrichments
observed for the same PPSD samples (Fig. 3) result from sphene and
Ti-magnetite. Indeed, the important presence of Ti-bearing minerals such as ilmenite, rutile and Ti-magnetite observed under the scanning
electron microscope (SEM) confirm the presence of tephra-derived
mineral constituents in the PPSD.
The deposited tephra dust particles caused elevated Nb
concentra-tions in the samples (Schmincke et al., 1999; Haase et al., 2007) because
the erupted tephra (Lower Laacher See Tephra deposits, LLST) is
enriched in Nb with concentrations of N200 ppm (Wörner and
Schmincke, 1984). The Nb concentrations of the studied coverbed
ma-trix are well correlated with TiO2(Table 2) indicating, as suggested
(Bonjour and Dabard, 1991), that titaniferous mineral phases are the principal Nb carrying phases. Nb concentrations vary according to
Fig. 7. Relationships between (a)87
Sr/86
Sr vs. Rb/Sr ratio and (b)206
Pb/207
Pb vs. U/Pb ratio of all analysed samples and a lichen sample fromHissler et al. (2008)representing the anthropogenic end member.
depth, being lowest close to the surface (10.28 ppm) (Fig. 3andTable
2). Between PPSD2 and PPSD4, the Nb concentrations range between
19.4 and 19.9 ppm and are higher than those of the underlying bedrock showing concentrations between 14 and 16 ppm. The Nb concentra-tions of coverbeds from two other sites of the studied plateau range, at same depths as PPSD2 to PPSD4, between 18.5 and 22.5 ppm (not shown). In the coarser materials (PPSDce) of these horizons and in the underlying bedrock, Nb concentrations decrease again to values below
11 and 16.6 ppm respectively. According toTaylor and McLennan
(1985)the UCC Nb concentration is higher (25 ppm) and, therefore, the PPSD samples show Nb depletions similar to European loess studied byGallet et al. (1998). These authors provided plausible arguments that the depletions are artefacts resulting from an over-estimation of the
UCC Nb concentration. SimilarlyCondie (1993)suggest that the Nb
con-centrations of clastic sediments are seldom higher than 15 ppm. This value is in agreement with the Nb concentrations found in the bedrock below the coverbed. Thus, the fact that the PPSD matrix shows slightly higher Nb concentrations than the PPSD coarse materials and the bed-rock is suggested to be the result of deposition of Nb-enriched mineral phases from the late-Pleistocene Laacher See eruption.
The Nb contribution from this eruption to the loess component of the PPSD sediments can be estimated by using a two component mixing equation, a Nb concentration of the Laacher See tephra (100 ppm) (Wörner and Schmincke, 1984) for the volcanic mixing end-member and a Nb concentration of the underlying bedrock (15 ppm) for the PPSD end-member. This rough estimation indicates that the volcanic
Nb contribution isb6% in the PPSD matrix. Mixing calculations can
also be performed by using Nd concentrations and143Nd/144Nd isotope
ratios (seeFaure, 1986). However, the Sr-Nd isotopic and concentration
similarities between slate bedrock and PPSD samples and, thus, the
resulting mixing relationships (Fig. 8) suggest that the PPSD below
45 cm depth do not contain visible amounts of tephra-derived Sr and Nd. Thus, in the case of our study only Nb enrichments and mineralogical
composition allow the identification of tephra contributions in the
lower-most PPSD horizons. Given the fractionation of some minerals and trace elements within the PPSD, we propose that the discontinuities observed from PPSD2 and PPSD3 respond both to the impact of volcanic deposi-tions and pedogenetic processes such as neoformation of minerals. 5.4. Impact of the saprolite (SP) on PPSD
With the exception of the two uppermost soil horizons (OH and Ah), no impact of anthropogenic Sr and Nd is observable for the rest of the regolith compartments. Similarly we have seen that neither Sr nor Nd
isotope ratios are impacted by tephra depositions during Pleistocene volcanic eruption events. PPSD and SP material are isotopically very
similar pointing to similar origins. This is confirmed by the major
ele-ment concentrations of the slate saprolithic material (SP) and the coverbeds (PPSD) below the OH horizon, which scatter in nearly the
same range (Fig. 3) and show similar depletions and enrichments
com-pared to the reference slate layer of SP (Fig. 4). Only very few trace
ele-ments such as Nb and some redox-sensitive eleele-ments manifest, as discussed above, differences between PPSD and underlying saprolithic
material. Consequently, if the PPSD profile contains, as suggested for
other neighboured coverbeds (Stückrad et al., 2010), pre-industrial
at-mosphere-derived particles, then they have not travelled long distances
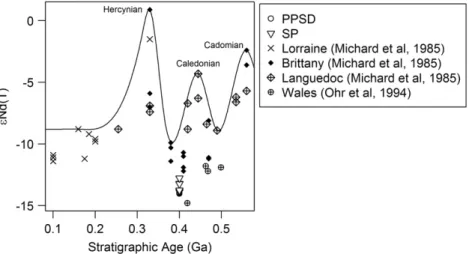
but originate from the slate of the region. InFig. 9, theεNd (T) values of
the Devonian slates of our study site (“initial” epsilon Nd values,
calcu-lated back to the stratigraphic age) are plotted versus their stratigraphic age and compared with other European phanerozoic shales. This type of
diagram wasfirst used byMichard et al. (1985)in order to show that
during major orogenic events sediments have been impacted by man-tle-derived material such as volcanogenic detrital material. One
ob-serves that the slates in this study show initialεNd (T) values very
similar to those of other Devonian shales collected in Brittany and Wales. These sediments have been deposited in the same oceanic envi-ronment in a period between the Hercynian and Caledonian orogenesis and are not visibly impacted by volcanogenic detritus during their
de-position. Volcanogenic deposits containing significant quantities of
mantle-derived material are characterised by high143Nd/144Nd isotope
ratios and low87Sr/86Sr isotope ratios, whereas crustal materials devoid
of mantle-derived material have low143Nd/144Nd isotope ratios and
high87Sr/86Sr isotope ratios (e.g. SP samples). Continental crust plots
in function of the proportion of integrated mantle-derived Sr and Nd
on a mixing hyperbola defined by the end-member compositions of
continental crust and mantle (see hypothetical mixing hyperbola in
Fig. 8). Thus, when comparing the regolith data of this study with Euro-pean loess and tephra data from the literature, one observes that each data set has a very particular isotopic signature. Each of these coordi-nates plot inside or on a mixing curve ranging from mantle or
anthropo-genic (low 87Sr/86Sr and 143Nd/144Nd ratios) materials to crustal
materials (Fig. 8). The tephra signature fromWörner et al. (1985)
being the most mantle rich material. This indicates that the different loess deposits originate from very distinct rock units containing differ-ent proportions of mantle and crust material. In this context, our PPSD show Sr and Nd isotope signatures rather close to the studied slate
reg-olith compartment than to other losses (Fig. 8), which we hypothesise
reflects the genetic link of the materials of both compartments.
Fig. 8.87
Sr/86
Sr vs.143
Nd/144
Nd diagram describing mixing hyperbolas between the unweathered slate sample of this study (SP5) as the continental crust end member (Sr: 98.2 ppm,
87Sr/86Sr: 0.7416; Nd: 37.9 ppm,143Nd/144Nd: 0.51193) and a mantle representing end member according to the study ofWörner et al. (1985)(Sr: 500 ppm;87Sr/86Sr: 0.70477; Nd:
49 ppm;143Nd/144Nd: 0.51262); and between SP5 and the lichen representing the atmospheric derived anthropogenic end member (Sr: 1.17 ppm,87Sr/86Sr: 0.7152; Nd: 0.17 ppm, 143
Nd/144
Nd: 0.51205, fromHissler et al., 2008). Included are the loess signatures from UK, France and Belgium fromGallet et al. (1998)and Kaiserstuhl (Germany) fromTaylor et al. (1983)(grey circles: Nb enriched PPSD samples).