HAL Id: hal-00296860
https://hal.archives-ouvertes.fr/hal-00296860
Submitted on 11 May 2005
HAL is a multi-disciplinary open access
archive for the deposit and dissemination of
sci-entific research documents, whether they are
pub-lished or not. The documents may come from
teaching and research institutions in France or
abroad, or from public or private research centers.
L’archive ouverte pluridisciplinaire HAL, est
destinée au dépôt et à la diffusion de documents
scientifiques de niveau recherche, publiés ou non,
émanant des établissements d’enseignement et de
recherche français ou étrangers, des laboratoires
publics ou privés.
High resolution modelling of the extreme precipitation
event over Algiers in November 2001
S. A. Moore, C. Wilson, S. Bell
To cite this version:
S. A. Moore, C. Wilson, S. Bell. High resolution modelling of the extreme precipitation event over
Algiers in November 2001. Advances in Geosciences, European Geosciences Union, 2005, 2,
pp.139-143. �hal-00296860�
SRef-ID: 1680-7359/adgeo/2005-2-139 European Geosciences Union
© 2005 Author(s). This work is licensed under a Creative Commons License.
Advances in
Geosciences
High resolution modelling of the extreme precipitation event over
Algiers in November 2001
S. A. Moore, C. Wilson, and S. Bell
Met Office, FitzRoy Road, Exeter, EX1 3PB, UK
Received: 24 October 2004 – Revised: 24 February 2005 – Accepted: 4 March 2005 – Published: 11 May 2005
Abstract. Between 18:00 UTC on Friday 9th November and
12:00 UTC on Saturday 10th November 2001 260 mm of rainfall was recorded at Bouzareah, compared to the Novem-ber average of just 96 mm. This extreme rainfall resulted in landslides and flooding, causing immense damage to the Bab-el-Oued district of Algiers and affected the lives of more than 2000 people. In this paper, key results from a modelling study of this event using the UK Met Office Unified Model at global (60 km), regional (20 km) and national (4 km) hor-izontal resolutions are described. In general, it is found that the event could be well forecast with increases in resolution leading to better predictions of both the distribution and in-tensity of the rainfall. The role of the local orography and latent heating are also discussed.
1 Introduction
Strong cyclogenesis events are not uncommon in the Mediterranean region but events of such severity as the one experienced in Algiers are. The extreme precipitation en-countered in Algiers was partly the result of a strong cycloge-nesis event that began with a low pressure system originating over Scandinavia moving south over Europe to the Mediter-ranean basin. Coupled with an influx of cold air over the course of the 9th November from the west, this led to a de-crease in atmospheric pressure of 1006 hPa to 997 hPa in the twenty four hours from 12:00 UTC on the 9th to 12:00 UTC on the 10th November. At the same time, an increase in the amount of warm, moist air being lifted up into the at-mosphere over the Mediterranean Sea ultimately led to the extreme amount of precipitation.
A multiple resolution modelling study of this event is con-ducted to investigate not only the predictability of the event, but also identify any potential factors that may have ampli-fied the total precipitation amounts. Numerical experiments at a resolution of 4 km looking into the role of the local orog-raphy and latent heating are therefore conducted.
Correspondence to: S. A. Moore
2 Numerical Modelling
All model runs conducted in this study are performed us-ing the UK Met Office Unified Model (UM). The underlyus-ing formulation of the model is a non-hydrostatic, semi-implicit semi-Lagrangian dynamical core called the “New Dynam-ics” and is described in Cullen et al. (1997) and Davies et al. (1999). The model physics includes a CAPE closure based convection scheme, a mixed phase large scale precipitation scheme and a Richardson Number based boundary layer mix-ing scheme. An overview of these schemes, as well as a de-scription of how orography is represented in the UM, is given by Webster et al. (2003).
The coarsest resolution model runs are performed using a 60 km global model with a full 6-hourly 3D-Var data assimi-lation cycle (Lorenc et al., 2000), using all available conven-tional and satellite observations. Two day (T+48) forecasts are produced at midnight and midday on each day. The same model runs generate lateral boundary conditions for the re-gional scale 20 km model. The 20 km mesoscale version of the UM, called the “North Atlantic European” model, is used for the regional scale part of the study. As shown in Fig. 1, the model domain covers Europe, much of the north Atlantic and north Africa. The initial conditions for this model are de-rived from interpolated 60 km model output. This model also uses a 6-hourly 3D-Var data assimilation cycle and is config-ured to provide T+36 hour forecasts beginning at 00:00 UTC, 06:00 UTC, 12:00 UTC and 18:00 UTC on each day up to and during the event, starting on the 7th November. This model also produces the lateral boundary conditions for the high resolution 4 km model.
The 4 km limited area model is centred on and covers an area of 577 600 km2 around Algiers using a 190×190 grid. It is run, without data assimilation, out to T+36 from 09:00 UTC on the 9th November1. The initial conditions for the 4 km model are derived by interpolating output from the 20 km model.
1The T+36 hour forecast length and 09:00 UTC start time was
140 S. A. Moore et al.: Modelling the extreme precipitation event over Algiers in November 2001
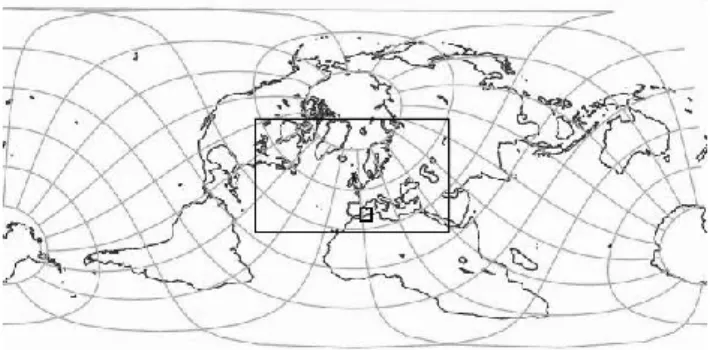
Fig. 1. Schematic showing the 20 km model domain nested within
the 60 km global model and the 4 km model domain nested within the 20 km domain and centred on Algiers.
3 Results
The nature of the event being studied means that the precipi-tation fields are the most important in terms of analysing the models ability to forecast an event as extreme as the one that hit Algiers. The following sections show how the forecasts of total precipitation amount, which comprises of the dynamic and convective rainfall and snowfall, vary as the model res-olution, domain orography and latent heating characteristics are varied.
3.1 Effect of change in horizontal resolution
Figure 2 shows 24-hour pointwise accumulations of the total model precipitation for the period 12:00 UTC on Friday 9th to 12:00 UTC on Saturday 10th November. The 60 km and 20 km forecasts were started at 00Z on the 9th while the 4 km forecast was started nine hours later at 09:00 UTC on the 9th. Both the 20 km and 4 km models have maximum accumu-lations greater than the 119 mm forecast by the 60 km model. However, these totals, 167 mm and 166 mm in the 20 km and 4 km models respectively, are much less than the observed maximum for the event of 260 mm recorded at Bouzareah during the period 18:00 UTC on the 9th to 12:00 UTC on the 10th November. Rainfall totals for Bouzareah and other se-lected rain gauge sites in the surrounding area are shown in Fig. 3. Despite this, the model accumulations still exceed the monthly average for November of just 96 mm and would have alerted forecasters to the occurrence of a major precip-itation event. While each model has the rainfall positioned correctly along the Algerian coastline, only the 20 km and 4 km models give some idea as to the localised nature of the most intense precipitation. However, it is noted that the po-sition of the maximum rainfall in all of the models is to the east of Algiers, away from the location of the recorded imum at Bouzareah to the west of Algiers. The area of max-imum precipitation in the 20 km and 4 km models in partic-ular is concentrated to the east of Algiers with less rainfall over Algiers itself. It is believed this is most likely due to the sensitivity of the model forecasts to the initial conditions. Indeed, forecasts from the 4 km model starting at 09:00 UTC
on the 8th November and 03:00 UTC and 15:00 UTC on the 9th November (not shown) do exhibit some sensitivity of the intensity and location of the precipitation field to the forecast start time.
A number of numerical experiments were carried out us-ing the 4 km model which looked at the role of orography and latent heating in the precipitation event. The following sections summarize the main results from these experiments. 3.2 Effect of orography
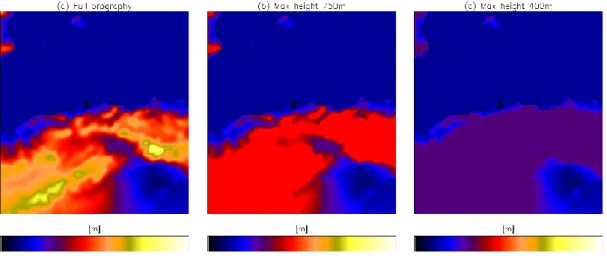
Two experiments were conducted which altered the orogra-phy of the 4 km model domain. The first imposed a maxi-mum orographic height of 750 m and the second a maximaxi-mum height of 400 m. The maximum height in the full orographic field is just over 1.6 km. Figure 4 compares the full, unal-tered orography (Fig. 4a) against the two scenarios where the maximum height is 750 m (Fig. 4b) and 400 m (Fig. 4c).
For the 24-hour period between 12:00 UTC on the 9th to 12:00 UTC on the 10th November, Fig. 5 compares the to-tal precipitation accumulation from the model run with un-altered orography with the accumulations from the two runs where the domain orography is altered.
Although there is little obvious difference to the distribu-tion of the precipitadistribu-tion, greater, more localised precipita-tion is forecast when the maximum orographic height is re-duced. This is evident in the coastal region to the east of Algiers where the precipitation totals for the 24-hour pe-riod increase from 166 mm using the unaltered orography to 177 mm where a maximum height of 750 m is imposed and 187 mm when the maximum height is 400 m. There is a second region of increased precipitation when the maximum orographic height is reduced further inland and to the south-west of Algiers. Here, an increase in total precipitation of up to 30 mm on the control run is found and appears related to the removal of a 1300 m peak that is present in the full orography field (Fig. 4a).
With the majority of the peaks removed from the local to-pography, the increase in precipitation is less likely due to orographic enhancement but rather the large scale flow ad-justing to the revised orography. In effect, the role of the local orography as a blocking feature has been reduced. In-deed, compared to the control run, the relative humidity at lower levels (not shown) reveals larger regions of moist air moving inland as the maximum orographic height is reduced. This result also lends support to the suggestion of Tripoli et al. (2002) that the precipitation event itself was not overly enhanced by the local orographic detail.
3.3 Effect of latent heat
The studies of Genov´es and Jans`a (2002) and Hamadache et al. (2002) discussed the role of the latent and sensible heat fluxes in the generation and subsequent development of the cyclone that was located over Algiers. To investigate this further, two runs of the 4 km model were made with the val-ues of the latent heat of condensation at 0◦C (Lc) and latent
Fig. 2. 24-hour accumulations of the total precipitation amount for the period 12:00 UTC on the 9th November to 12:00 UTC on the 10th
November for (a) the 60 km model, (b) the 20 km model and (c) the 4 km high resolution model. In each plot, the “X” marks the position of Algiers.
heat of fusion at 0◦C (Lf) reduced first by half and second
by a factor of four. The first run used Lc=1.251×10⁶Jkg−1
and Lf=0.167×10⁶Jkg−1, while the second run
re-duced these values further to Lc=0.626×10⁶Jkg−1 and Lf=0.084×10⁶Jkg−1. The control run used
Lc=2.502×10⁶Jkg−1 and Lf=0.334×10⁶Jkg−1.
Fig-ure 6 shows the differences in the total precipitation fields from the three runs for the 24-hour period 12:00 UTC on the 9th to 12:00 UTC on the 10th November.
Compared to the change in precipitation fields that resulted from changes to the domain orography, reducing the effect of latent heating has had a much larger effect on the total precipitation amounts, altering both the precipitation amount and its distribution. In general, reducing the role of latent heating has led to a decrease in precipitation, particularly in the regions of most intense rainfall along the coast to the east of Algiers.
Compared to the control run maximum accumulation of 166 mm, halving the contribution of latent heating (Fig. 6b) has resulted in a maximum accumulation of just 130 mm. This is less than the maximum accumulation for the same pe-riod forecast by the 20 km model. There are, however, a num-ber of small areas, particularly to the south and south west of Algiers, where the precipitation amount has increased com-pared to the control run.
When Lcand Lf are reduced by a factor of four (Fig. 6c),
the differences that were seen when Lcand Lf were halved
simply become more exaggerated and the maximum precip-itation accumulation is now only 125 mm. The region to the east of Algiers in particular is now indicating differences of up to 75 mm less precipitation than is found in the control run for the same 24-hour period. While, like in Fig. 6b, local increases in precipitation, compared to the control run, are found to the south and south west of Algiers, there is also a large region of less intense precipitation along the coast to the
Fig. 3. Rainfall map showing 18-hour accumulations of rainfall
(in mm) as recorded by various rain gauge sites located around Algiers. Bouzareah recored 260 mm while Cap-Tenes recorded 105 mm. The “X” marks the position of Algiers.
west of Algiers. Here, reducing the effect of latent heating has led to a 40 mm reduction in the amount of precipitation forecast by the model compared to the control run.
4 Conclusions
The numerical simulations presented in this paper have shown the extreme precipitation event of the 9th and 10th November 2001 to be well forecast at global (60 km), re-gional (20 km) and high resolution (4 km) scales. Whilst it is shown that high resolution limited area models clearly have an important role to play in being able to forecast and study such events, the use of data assimilation and supporting
142 S. A. Moore et al.: Modelling the extreme precipitation event over Algiers in November 2001
Fig. 4. Plots showing, for the 4 km model domain, (a) the unaltered domain orography, (b) the orography when a maximum height of 750 m
is imposed and (c) the orography when a maximum height of 400 m is imposed. In each plot, the “X” marks the position of Algiers.
Fig. 5. Plots showing (a) the 24-hour accumulation of the total precipitation amount for the period 12:00 UTC on 9th November to 12:00 UTC
on 10th November using the 4 km model with the original orography and for the same 24-hour period, (b) the difference in total precipitation amount between the control run and the run where the maximum orographic height is 750 m and (c) the difference in total precipitation amount between the control run and the run with a maximum orographic height of 400 m. In each plot, the “X” marks the position of Algiers.
Fig. 6. Plots showing (a) the 24-hour accumulation of the total precipitation amount for the period 12:00 UTC on 9th November to 12:00 UTC
on 10th November using the 4 km model where Lc and Lf have their original values and for the same 24-hour period, (b) the difference
in total precipitation amount between the control run and the run where Lcand Lf are halved and (c) the difference in total precipitation
amount between the control run and the run where Lcand Lf are reduced by a factor of four. In each plot, the “X” marks the position of
observations remain vital so that the location of the most in-tense precipitation may be better predicted.
In accordance with the results of earlier studies, experi-ments with the 4 km model suggest that latent heating played a major role in the development of this extreme precipitation event while the role of the local orography was to block low level moisture from reaching inland rather than enhance the precipitation.
Acknowledgements. The authors would like to thank B. Hamadache and K. Chikhar of the Office National de la M´et´eorologie, Alger for their contribution to this work.
Edited by: L. Ferraris
Reviewed by: C. Adamo and another referee
References
Cullen, M. J. P., Davies, T., Mawson, M. H., James, J. A., Coulter, S. C., and Malcolm, A.: An overview of numerical methods for the next generation of NWP and climate models, in: Numerical methods in atmospheric and ocean modelling. The Andre Robert memorial volume, edited by: Lin, C., Laprise, R., and Ritchie, H., pp. 425–444, Canadian Meteorological and Oceanographic Society, Ottawa, Canada, 1997.
Davies, T., Cullen, M. J. P., Mawson, M. H., and Malcolm, A. J.: A New Dynamical Formulation for the UK Meteorological Office Unified Model, in Proceedings of ECMWF seminar on recent de-velopments in numerical methods for atmospheric modelling, 7– 11 September 1998, pp. 202–225, European Centre for Medium-Range Weather Forecasts, Shinfield Park, Reading, Berkshire, RG2 9AX, UK, 1999.
Genov´es, A. and Jans`a, A.: Diabatic Processes Contribution to the November 2001 Storm, in: Mediterranean Storms: Proceed-ings of the 4th EGS Plinius Conference, published on CD-ROM (ISBN 84-7632-792-7), 2002.
Hamadache, B., Terchi, A., and Brachemi, O.: Study of the me-teorological situation which affected the west and the center of Algeria in general and Bab-el-Oued in particular in the 10th November 2001, in: Mediterranean Storms: Proceedings of the 4th EGS Plinius Conference, published on CD-ROM (ISBN 84-7632-792-7), 2002.
Lorenc, A. C., Ballard, S. P., Bell, R. S., Ingleby, N. B., Andrews, P. L. F., Barker, D. M., Bray, J. R., Clayton, A. M., Dalby, T., Li, D., Payne, T. J., and Saunders, F. W.: The Met. Office Global 3-Dimensional Variational Data Assimilation Scheme, Q. J. R. Meteorol. Soc., 126, 2991–3012, 2000.
Tripoli, G. J., Pinori, S., Dietrich, S., Panegrossi, G., Mugnai, A., and Smith, E.: The 9–10 November, 2001 Algerian Flood: A Po-lar Low?, in: Mediterranean Storms: Proceedings of the 4th EGS Plinius Conference, published on CD-ROM (ISBN 84-7632-792-7), 2002.
Webster, S., Brown, A. R., Cameron, D. R., and Jones, C. P.: Im-provements to the representation of orography in the Met Office Unified Model, Q. J. R. Meteorol. Soc., 129, 1989–2010, 2003.