HAL Id: hal-00296142
https://hal.archives-ouvertes.fr/hal-00296142
Submitted on 12 Feb 2007
HAL is a multi-disciplinary open access
archive for the deposit and dissemination of
sci-entific research documents, whether they are
pub-lished or not. The documents may come from
teaching and research institutions in France or
abroad, or from public or private research centers.
L’archive ouverte pluridisciplinaire HAL, est
destinée au dépôt et à la diffusion de documents
scientifiques de niveau recherche, publiés ou non,
émanant des établissements d’enseignement et de
recherche français ou étrangers, des laboratoires
publics ou privés.
Non-volatile residuals of newly formed atmospheric
particles in the boreal forest
M. Ehn, T. Petäjä, W. Birmili, H. Junninen, P. Aalto, M. Kulmala
To cite this version:
M. Ehn, T. Petäjä, W. Birmili, H. Junninen, P. Aalto, et al.. Non-volatile residuals of newly formed
atmospheric particles in the boreal forest. Atmospheric Chemistry and Physics, European Geosciences
Union, 2007, 7 (3), pp.677-684. �hal-00296142�
www.atmos-chem-phys.net/7/677/2007/ © Author(s) 2007. This work is licensed under a Creative Commons License.
Chemistry
and Physics
Non-volatile residuals of newly formed atmospheric particles in the
boreal forest
M. Ehn1, T. Pet¨aj¨a1, W. Birmili1,2, H. Junninen1, P. Aalto1, and M. Kulmala1
1Division of Atmospheric Sciences, Department of Physical Sciences, P.O. Box 64, 00014 University of Helsinki, Finland 2Leibniz-Institute for Tropospheric Research, Permoserstrasse 15, 04318, Leipzig, Germany
Received: 11 September 2006 – Published in Atmos. Chem. Phys. Discuss.: 17 October 2006 Revised: 16 January 2007 – Accepted: 9 February 2007 – Published: 12 February 2007
Abstract. The volatility of sub-micrometer atmospheric
aerosol particles was studied in a rural background environ-ment in Finland using a combination of a heating tube and a scanning mobility particle sizer. The analysis focused on nanoparticles formed through nucleation which were subse-quently observed during their growth in the diameter range between 5 and 60 nm. During the 6 days of new particle for-mation shown in detail, the concentrations of newly formed particles increased up to 10 000 cm−3. The number of nu-cleation mode particles measured after volatilization in the heating tube at 280◦C was up to 90% of the total number under ambient conditions. Taking into account the absolute accuracy of the size distribution measurements, all ambient particles found in the rural atmosphere could have a non-volatile core after volatilization at 280◦C. As the regional
new particle formation events developed over time as a re-sult of further vapor condensation, the newly formed parti-cles grew at an average growth rate of 2.4±0.3 nm h−1. Im-portantly, the non-volatile cores of nucleation mode parti-cles were also observed to grow over time, however, at a lower average growth rate of 0.6±0.3 nm h−1. One impli-cation of the volatility analysis is that the newly formed par-ticles, which have reached ambient diameters of 15 nm, are unlikely to consist of sulfuric acid, ammonium sulfate, and water alone. A relatively constant ratio between the growth rate of the ambient particles as well as their non-volatile cores indicates that non-volatile matter is formed only gradu-ally in the growing particles. The non-volatile fraction of the particles showed some correlation with the ambient tempera-ture. The composition and formation mechanism of this non-volatile material in nucleation mode particles are, to date, not known.
Correspondence to: M. Ehn ([email protected])
1 Introduction
Atmospheric aerosols play a key role in the balance of global climate, notably through their direct and indirect effects on incoming solar radiation (Houghton et al., 2001; Haywood and Boucher, 2000). Aerosol particles are directly injected into the atmosphere through a variety of mechanisms includ-ing combustion, sea-salt, and dust emission, which are com-monly termed as primary aerosol generation mechanisms. Secondary particle formation, in contrast, includes the for-mation of new atmospheric nuclei through the nucleation of supersaturated vapors. This process generates high number concentrations of new particles <10 nm, part of which will eventually grow further by condensation and reach particle sizes of about 100 nm where they become effective light scat-terers and cloud condensation nuclei.
New particle formation has been experimentally observed in many parts of the world, such as the free troposphere (Clarke, 1992), the marine boundary layer (Covert et al., 1992), the coastal environment (O’Dowd et al., 2002), and the continental boundary layer (Woo et al., 2001; Birmili et al., 2003; Dal Maso et al., 2005). Kulmala et al. (2004) reviewed over 100 ground-based and aircraft observations of new particle formation, and provide the most comprehensive summary of experimental efforts to date.
Despite the intensive experimental efforts reported, the ex-act nucleation mechanism and contributing compounds have still not been determined. However, activation theory re-cently developed by Kulmala et al. (2006) can, to a large ex-tent, explain the observed formation rates based on measured sulphuric acid concentrations. Due to the minuscule amounts of mass contained in nanoparticles, it has been extremely dif-ficult do develop methods for their chemical speciation. The most recently developed direct speciation method is aerosol mass spectrometry, which has been used to derive informa-tion on the chemical composiinforma-tion of nanoparticles as small as 6 nm in Atlanta (Smith et al., 2005). Instead of direct
678 M. Ehn et al.: Non-volatile residuals of newly formed particles speciation methods, indirect approaches have alternatively
been pursued, notably hygroscopicity and volatility analy-sis (e.g., Sakurai et al., 2005). The basic experimental ap-proach of volatility analysis involves the heating of a contin-uous stream of sample aerosol, thereby evaporating volatile matter from the particles. These devices used are known as “thermodenuders” (Burtscher et al., 2001), and have mainly been used to remove the volatile fractions in particles from engine exhaust. The heated sample is often cooled in a tube consisting of activated charcoal to remove the desorbed ma-terial and prevent it from re-adsorbing onto the particles.
Wehner et al. (2005) applied volatility analysis to the num-ber size distribution of sub-micrometer particles at a rural observation site in Melpitz, Eastern Germany. The study demonstrated that atmospheric particles originating from tro-pospheric nucleation bursts contain non-volatile residuals which are not volatile at 300◦C, which is a temperature where usually the overwhelming mass fraction of organic and ionic compounds relevant in tropospheric aerosols has evaporated (Turpin et al., 2000).
As the new particles grew in total diameter, the size frac-tion of the non-volatile core increased as well, but at a slower rate. Wehner et al. (2005) concluded that the formation of a non-volatile core, together with the condensation of sulfu-ric acid, could explain the growth of the new particles up to 10–20 nm. On the composition of the nano-sized non-volatile cores, however, only hypothetical conclusions could be made. One hypothesis included the gradual formation of organic polymers inside the newly formed particles, a mecha-nism which has been observed in chamber experiments using photo-oxidation products of aromatic compounds (Kalberer et al., 2004).
In this work we conducted a volatility analysis of newly formed atmospheric particles in the rural background at-mosphere of Finland, with the objective of quantifying the volatile and non-volatile size fractions during particle forma-tion and subsequent growth. We discuss the relaforma-tionship of our observations to former observations, and derive their im-plications on particle formation and growth in the boreal for-est.
2 Measurements
The measurements were performed at SMEAR II (Vesala et al., 1998; Kulmala et al., 2001) in Hyyti¨al¨a, Southern Finland as a part of the BACCI/QUEST-campaign between March and May 2005. The SMEAR station is located in a boreal coniferous forest and the largest city near the station is Tampere, about 60 km from the site. Continuous measure-ments of the dry aerosol number size distributions have been performed at the station since 1996 (M¨akel¨a et al., 1997) with a twin-DMPS system (Aalto et al., 2001). The system contains two Differential Mobility Particle Sizers (DMPS)
measuring in parallel, one optimized for small particles (3– 50 nm) and the other for larger sizes (10–1000 nm).
For the volatility analysis a Volatility-Scanning Mobility Particle Sizer (V-SMPS) was built. A SMPS (Wang and Fla-gan, 1990) is similar to a DMPS except that it does not sepa-rately measure the number concentration of a certain amount of size ranges. Instead it does a slow continuous scan of the entire size range. The V-SMPS used in our study contained a 10.9 cm long Hauke-type DMA (Winklmayr et al., 1991) and a TSI model 3025 butanol condensation particle counter (Stolzenburg and McMurry, 1991). The particles were neu-tralized with a 370 MBq Nickel-63 beta source. To mini-mize losses of small particles, the DMA was operated with high flowrates (sample flow of 4 liters per minute (LPM), sheath flow of 20 LPM). The system measured the dry size distribution from 3 to 40 nm every 5 min alternating between ambient air and air that had passed through a heating tube. This was a stainless steel tube of outer diameter 10 mm and length approximately 0.5 m heated to 280◦C. All species that evaporate below this temperature should be removed from the aerosol phase in the heating tube. Species that do not evaporate at this temperature are referred to as non-volatile. The alternating SMPS measurements will henceforth be re-ferred to as “ambient” and “heated”.
The V-SMPS was placed inside the same temperature con-trolled cottage as the twin-DMPS. The aerosol sample was taken from a height of 9 m above the ground through a large tube with a flow rate of 100 LPM, from which smaller sam-ple flows were distributed to the twin-DMPS and V-SMPS. All the times mentioned in this study are in Finnish winter time (UTC+2).
To ensure that volatile compounds are removed satisfac-torily in our system, the performance of the heating tube was compared to a previously characterized thermodenuder design, the “Leipzig” thermodenuder (Wehner et al., 2002). The design was developed at the Institute for Tropospheric Research in Leipzig, Germany, and consists of a 500 mm heating section and a 500 mm cooling desorption section containing active carbon. The comparison of aerosols down-stream the volatilization devices was conducted for urban background aerosols in Helsinki for the nominal operation conditions of the heating tube (T=280◦C) and the Leipzig thermodenuder (T=300◦C). During a 12-h comparison exper-iment, the size distributions downstream the heating tube and the Leipzig thermodenuder agreed within 10% for all parti-cle sizes between 10 and 900 nm, when the concentrations were sufficiently high. The absence of an explicit vapor des-orption section after the heating tube used in this work did not seem to limit the removal rate of volatilized particulate material. Thus, the performance of both devices can be con-sidered equivalent for particle concentrations as low as those found in rural and urban background air in Finland.
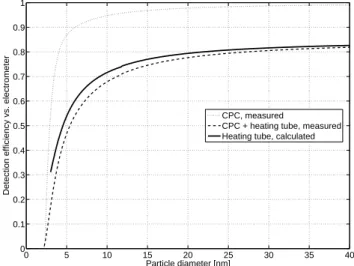
Particle losses inside the heating tube due to Brownian diffusion and thermophoresis was determined in the labora-tory by measuring the penetration of silver particles through
the oven, for a tube temperature of 280◦C. This was
accom-plished by first measuring the detection efficiency of a TSI 3025 CPC against a TSI 3068 Aerosol Electrometer. After this, the heating tube was added in front of the CPC, and the detection efficiency of the CPC and heating tube was mea-sured. By comparing these two results, the losses in the heat-ing tube were calculated. The results are shown in Fig. 1. The solid line corresponds to the penetration of particles through the tube as a function of particle size. For particles above 15 nm the losses are roughly 20%, for 5 nm particles already about 50% and for 3 nm:s almost 70%. Considering losses in the rest of the tubing and the DMA, this means that only very few particles of sizes below 5 nm will be detected, leading to poor counting statistics. We observe particles at Dp<5 nm, but the large fluctuations between two consecutive measure-ments suggest 5 nm as a lower detection limit of the V-SMPS. The inverted size distributions for the heated measurements were corrected according to the measured penetration. This is appropriate because size-dependent particle losses occur in the region where the overwhelming fraction of aerosol parti-cles is singly charged.
3 Determination of nucleation mode diameters
To simplify the analysis of the measured size distributions, we fitted modes to each scan. The parameterization of the size distributions was accomplished by assuming that the to-tal aerosol size distribution consisted of a sum of smaller aerosol distributions. With the problem expressed as a sum of underlying variables, factor analysis tools were used to solve it.
Thus, constrained matrix factorization (Paatero, 1997) was utilized. The underlying factors were thought to be log-normal probability distributions of width approximately 1 nm. The distributions had fixed area, width and position, and the task was to solve the matrix equation
X = GF + E (1)
in a least squares sense. X is a matrix that contains the to-tal aerosol size distributions, with time in rows and aerosol size bins in columns. G is a matrix containing the number concentrations of particles in small size ranges, with time in rows and the weights of the small distributions in columns. F is a matrix with log-normal probability distributions in rows and aerosol size bins in columns. Finally, E is the residual of the fit, so the only unknown in the equation is G.
The total aerosol size distribution at a certain time t is X(t, :) =
f X i=1
G(t, i)F(i, :). (2)
where : denotes a whole row of X and F, respectively. f is the number of probability distributions.
The modes in the total aerosol size distribution were found by increasing f from two until the resulting mode was no
0 5 10 15 20 25 30 35 40 0 0.1 0.2 0.3 0.4 0.5 0.6 0.7 0.8 0.9 1 Particle diameter [nm]
Detection efficiency vs. electrometer
CPC, measured
CPC + heating tube, measured Heating tube, calculated
Fig. 1. Transport efficiency of a TSI 3025 CPC and the heating
tube (at 280◦C) used in the V-SMPS setup as a function of particle size. The detection efficiency of the CPC (dotted line) is taken into account in the inversion of the data; the penetration efficiency of the heating tube (solid line) is considered in the final size distribution correction.
longer unimodal. At this point a new mode was started. The final positions of the modes were defined as the size where the modes had their maximum values.
The main advantages of the described method are its speed and robustness. Robustness means that there is a very small number of parameters that need to be defined before the anal-ysis. The most important ones, the number and the position of the aerosol modes are not predefined or limited. The algo-rithm runs in MatLab (The MathWorks Inc. MA, USA).
4 Results
4.1 Ambient aerosol formation
New particle formation occurs frequently in Hyyti¨al¨a, and continuous measurements have been conducted there since 1996 (Dal Maso et al., 2005). Both the probability of parti-cle formation, and the average growth rates are highest dur-ing sprdur-ing and autumn. We measured V-SMPS and DMPS size distributions concurrently between 18 March and 18 May 2005. As newly formed particles in Hyyti¨al¨a often con-tained non-volatile fractions, we studied six cases (21 March, 26 March, 31 March, 3 April, 16 April and 12 May) more closely. These days were selected for the following reasons: 1) New particle formation occurred, with a substantial
fraction of total particle number <20 nm.
2) The new particles formed a clear mode that could be followed over a long period of time (>10 h).
680 M. Ehn et al.: Non-volatile residuals of newly formed particles 00:00 06:00 12:00 18:00 00:00 06:00 12:00 10−9 10−8 10−7 Diameter [m] Heated SMPS, 26−27 March Time of day 00:00 06:00 12:00 18:00 00:00 06:00 12:00 10−9 10−8 10−7 Diameter [m] Ambient SMPS, 26−27 March 00:00 06:00 12:00 18:00 00:00 06:00 12:00 10−9 10−8 10−7 10−6 Diameter [m] DMPS, 26−27 March
Fig. 2. The particle number size distribution during 26–27 March 2006. The top figure shows the DMPS data, the middle figure the ambient
SMPS data, and the bottom figure the heated SMPS data.
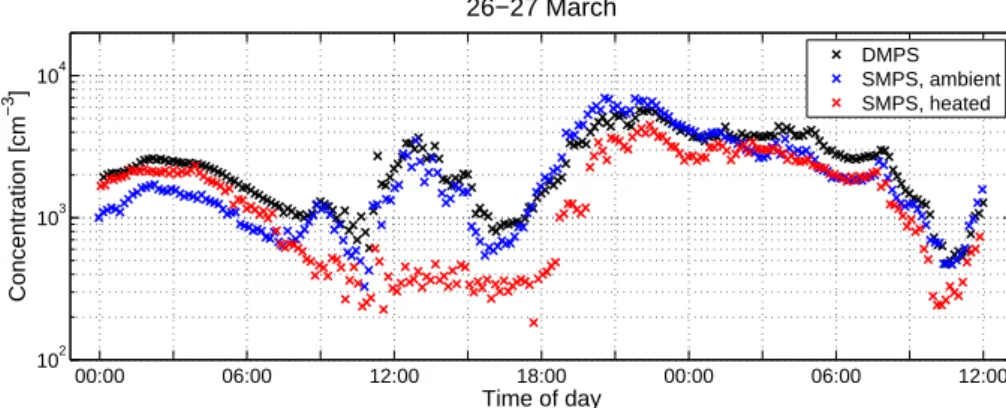
00:00 06:00 12:00 18:00 00:00 06:00 12:00 102 103 104 26−27 March Concentration [cm −3 ] Time of day DMPS SMPS, ambient SMPS, heated
Fig. 3. The particle concentrations measured with the DMPS, and the heated and non-heated SMPS.
3) Consecutive V-SMPS distributions were mostly coher-ent during the mcoher-entioned time period, i.e. the data did not fluctuate strongly from one measurement to the next.
The second criteria is also an indicator of particle forma-tion and subsequent growth happening fairly homogenously in larger air masses, implying that particle formation can be considered a regional event.
Figure 2 illustrates the particle size distributions measured with the twin-DMPS and V-SMPS during 26 and 27 March. New particles are detected before noon during the first day with both the twin-DMPS and the ambient SMPS. At this point only a background mode can be seen in the heated
spec-trum. In the evening around 21:00 the concentration of the mode increases and it starts growing more quickly. A short while later a mode also becomes visible in the heated SMPS distribution. At this point the particles have grown outside the measuring range of the ambient SMPS, but we can still follow the mode with the DMPS.
4.2 Aerosol number concentration
A comparison of the total particle concentrations measured by the DMPS and the V-SMPS during the previously stud-ied days (26–27 March) is plotted in Fig. 3. During the first night and morning almost all the particles contained non-volatile cores of sizes between 5 and 40 nm. When the
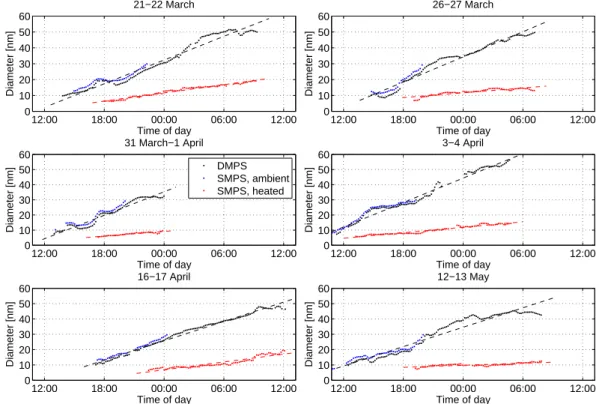
12:00 18:00 00:00 06:00 12:00 0 10 20 30 40 50 60 Time of day Diameter [nm] 21−22 March 12:00 18:00 00:00 06:00 12:00 0 10 20 30 40 50 60 Time of day Diameter [nm] 26−27 March 12:00 18:00 00:00 06:00 12:00 0 10 20 30 40 50 60 Time of day Diameter [nm] 31 March−1 April 12:00 18:00 00:00 06:00 12:00 0 10 20 30 40 50 60 Time of day Diameter [nm] 3−4 April 12:00 18:00 00:00 06:00 12:00 0 10 20 30 40 50 60 Time of day Diameter [nm] 16−17 April 12:00 18:00 00:00 06:00 12:00 0 10 20 30 40 50 60 Time of day Diameter [nm] 12−13 May DMPS SMPS, ambient SMPS, heated
Fig. 4. Positions of the fitted modes as a function of time. During the selected days, new particles appeared typically around mid-day and
a non-volatile mode was detected some hours later. The straight line indicates a linear fit to the modes and is used to calculate the average ambient and heated growth rates for each day.
particle formation started around noon, only about 10% of the particles had volatile cores. We assume that the non-volatile residues, if any exist, would be smaller than 5 nm, i.e. non-detectable with the heated SMPS. In the evening when the particle concentration and size increased, the con-centration of non-volatile fractions also increased, less than an hour later. During the night the concentrations became almost equal. A similar trend can be seen during the other studied days as well, with the fraction of particles contain-ing non-volatile cores increascontain-ing throughout the growth of the new particles. The fraction of particles containing non-volatile cores did not usually reach 100%, but stopped at 90%. The ambient SMPS, when compared to the DMPS, seems to slightly underestimate the particle concentration when the mode is below 10 nm, and slightly overestimate it at larger sizes.
There were small differences between the ambient SMPS and DMPS data, but this was to be expected since the sys-tems have different setups and use different inversion algo-rithms. The particles that contain non-volatile cores larger than 40 nm will not be detected by the heated SMPS. Also, the ambient SMPS showed lower concentrations than the DMPS for the smaller sizes, therefore the heated SMPS may be underestimating the concentration. This may be an addi-tional reason for the concentration of non-volatile cores al-ways being 10% or more below the total particle concentra-tion.
4.3 Ambient aerosol growth rates
As described in Sect. 3, modes were fitted to the measured distributions. In this study the placement of a fitted mode was defined as the point where it had its maximum value. The mode of new particles could not be followed reliably with the ambient SMPS once part of it had grown larger than the upper detection limit of 40 nm. Therefore the ambient SMPS modes are only fitted up to 30 nm.
The evolution of the modes of new particles and their non-volatile cores during the six studied days is plotted in Fig. 4. The DMPS and ambient SMPS agree fairly well, within 2 nm, which defines the accuracy of nucleation mode diameters determined by these two systems. By the time the new particles reached ambient sizes of around 20 nm, the non-volatile fractions had formed a stably developing mode as well. This mode continued to grow as the new particles grew, but at a lower growth rate. Table 1 gives the aver-age growth rates (GR) for each day, calculated by fitting a straight line to the size distributions in Fig. 4. As can be seen from the figure, the deviation from the straight line is usually small, especially for the heated SMPS plot. The relative fluc-tuations in particle GR are smaller than the flucfluc-tuations for the non-volatile cores. The particle GR is on average about 4 times the core GR. The table also gives the time difference between the detection of the particles and the non-volatile cores. However, “detection” in this case refers to the time
682 M. Ehn et al.: Non-volatile residuals of newly formed particles
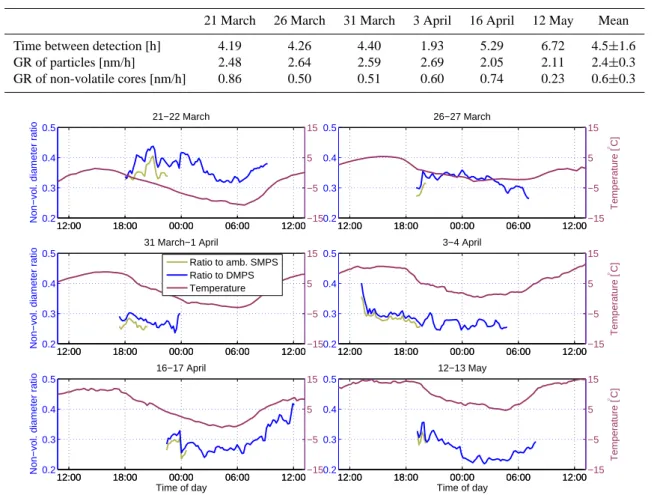
Table 1. Time differences between the detection of new particles and their cores, and the corresponding growth rates (GR). Particle GR were
calculated from the DMPS data, and the core GR from the heated SMPS data.
21 March 26 March 31 March 3 April 16 April 12 May Mean Time between detection [h] 4.19 4.26 4.40 1.93 5.29 6.72 4.5±1.6 GR of particles [nm/h] 2.48 2.64 2.59 2.69 2.05 2.11 2.4±0.3 GR of non-volatile cores [nm/h] 0.86 0.50 0.51 0.60 0.74 0.23 0.6±0.3 12:00 18:00 00:00 06:00 12:00 0.2 0.3 0.4 0.5 26−27 March 12:00 18:00 00:00 06:00 12:00 0.2 0.3 0.4 0.5 21−22 March
Non−vol. diameter ratio
12:00 18:00 00:00 06:00 12:00−15 −5 5 15 12:00 18:00 00:00 06:00 12:00−15 −5 5 15 Temperature [ °C] 12:00 18:00 00:00 06:00 12:00 0.2 0.3 0.4 0.5 31 March−1 April
Non−vol. diameter ratio
12:00 18:00 00:00 06:00 12:00−15 −5 5 15 12:00 18:00 00:00 06:00 12:00 0.2 0.3 0.4 0.5 3−4 April 12:00 18:00 00:00 06:00 12:00−15 −5 5 15 Temperature [ °C] 12:00 18:00 00:00 06:00 12:00 0.2 0.3 0.4 0.5 16−17 April
Non−vol. diameter ratio
Time of day 12:00 18:00 00:00 06:00 12:00−15 −5 5 15 Ratio to amb. SMPS Ratio to DMPS Temperature 12:00 18:00 00:00 06:00 12:00 0.2 0.3 0.4 0.5 12−13 May Time of day 12:00 18:00 00:00 06:00 12:00−15 −5 5 15 Temperature [ °C]
Fig. 5. The diameter ratio of non-volatile substance to the particles as a function of time. As the temperature increases in the morning, the
ratio also increases.
when a mode could be reliably fitted to the corresponding data.
Although the GR are fairly stable, some differences can be detected. This can be illustrated by closer examining the diameter ratio of the non-volatile cores to the particles. In Fig. 5 the diameter ratios, both compared to the DMPS and the ambient SMPS, are plotted together with the ambient temperature. During most of the days when the modes could be followed long enough, there is a steady decrease in the ratio during the night and an increase in the morning around 05:00 a.m. Interestingly, the same behavior is observed for the ambient temperature. Especially during 22 March, 17 April and 13 May the similarities are clearly noticeable. Dur-ing the other studied days the modes of new particles could not be followed until the time when the temperature started increasing.
5 Discussion
Wehner et al. (2005) have previously performed volatility analysis similar to ours in Melpitz where they made four case studies of days with new particle formation. Their re-sults agree very well with ours. They were able to follow the modes of new particles and the non-volatile cores start-ing from about 4 nm each day, whereas our experimental methods only allow detection of nucleation mode growth from above 6 nm. In Melpitz the particles formed around 08:00 a.m. and the non-volatile mode was detected at around 10:00 a.m. In Hyyti¨al¨a, we could start following the non-volatile mode in the late afternoon or evening. Wehner et al. (2005) focused only on the day of nucleation, but our analy-sis extends through the night and morning as long as we can follow the modes. They stated that all new particles in Mel-pitz contained non-volatile cores, and based on our measure-ments, this is also the case in Hyyti¨al¨a. The average diameter ratio of the non-volatile residuals to the particles in Melpitz was 0.3, with a corresponding value of 0.31 in Hyyti¨al¨a. This
value, however, showed some variation during the growth, with a slight decrease during the evening and night, and a in-crease in the early morning. Similar behavior was observed in a concurrent study of the hygroscopicity of new particles in Hyyti¨al¨a, implying changes in the condensing vapors dur-ing different stages of the growth (Ehn et al., 2007).
The method used in this study does not give any informa-tion on what the non-volatile cores consist of. But since the cores grow during particle growth, the non-volatile residual must form from the condensing vapors. Earlier studies (e.g. Kulmala et al., 2001) accredit a large part of the growth to organic substances. Kalberer et al. (2004) showed that or-ganics can, with time, form polymers which have very high volatilization temperatures. This would explain the observed growing non-volatile cores and Wehner et al. (2005) also concluded this to be the most probable explanation in Mel-pitz. Since ammonium sulfate should volatilize at around 200◦C and sulfuric acid at much lower temperatures, the
new particles can not have been formed by sulfuric acid, wa-ter and ammonia alone. Volatility analysis has previously been performed in Hyyti¨al¨a for accumulation mode particles (O’Dowd et al., 2000). All of these particles contained non-volatile material, which was thought to be soot carbon.
Explaining the observed similarities between diameter ra-tio and temperature is a difficult task. It is not known if the connection is due to the temperature, or if both the tem-perature and diameter ratio are functions of a third param-eter, such as global radiation. Assuming the temperature to be the influencing parameter, it may either be increas-ing the non-volatile substance in the particles, decreasincreas-ing the volatile substance, or both. Semi-volatile vapors that have condensed on the particles during the night would evapo-rate once the temperature again starts rising. On the other hand, the process or processes forming the non-volatile sub-stance may be temperature dependent. Looking solely at the small changes in GR for the particles and non-volatile resid-uals separately, no clear verifications can be found from this limited dataset. Interestingly, the temperature change, and not the absolute temperature, is the correlating parameter, as the absolute temperature is about 15 degrees lower during the particle formation events in March than during the one in May. This supports the theory of a third influencing parame-ter.
New particle formation events in Hyyti¨al¨a sometimes form a clear mode that grows up to Aitken mode sizes during the day, evening and night. These days were the ones selected for this study. Other days the mode of new particles abruptly or gradually disappears, and some days no mode at all can be distinguished. Since we can only use events of the first type for this analysis, there is the possibility that we are lim-iting the analysis to only one kind of events. Assuming, for example, that the particle formation and growth in Hyyti¨al¨a could be divided into “clean” and “polluted” cases, we might only get information on the “clean” cases in this study if the “polluted” cases would lead to stronger but shorter events.
The six studied days were fairly clean with northerly, north-westerly or north-westerly air masses.
6 Conclusions
The particle number size distribution from 3 to 40 nm was measured after heating to 280◦C in a boreal forest in South-ern Finland. The measurements were conducted between 18 March and 18 May 2005, with a Volatility-SMPS as part of the BACCI/QUEST campaign. The size distribution at room temperature was measured by a twin-DMPS.
The analysis focused on 6 days with new particle for-mation. During these days, a mode of new particles was detected around noon, and a mode of non-volatile material some hours later. The non-volatile cores grew at an average rate of 0.6±0.3 nm h−1, i.e. at about a fourth of the growth
rate of the particles (2.4±0.3 nm h−1). By dividing the di-ameter of the non-volatile cores with the particle didi-ameter, we obtain a value for the fraction of non-volatile material in the particles. This diameter ratio typically decreased slowly during the evening and night, and reached its minimum at the same time as the ambient temperature, whereafter it started to increase.
A similar volatility study was previously conducted at a rural site in Eastern Germany (Wehner et al., 2005). They reported on 4 days with new particle formation where new particles were detected in the morning around 08:00 a.m. and a growing non-volatile mode observed about 1–2 h later. They calculated an average diameter ratio of 0.3, which can be compared to the corresponding value of 0.31 in Hyyti¨al¨a. Both studies concluded that all new particles grad-ually formed non-volatile cores and that the most probable explanation for this was the formation of polymers from or-ganic vapors condensing on the particles.
Due to the many similarities during new particle forma-tion at the two sites in Germany and Finland, it can be con-cluded that the compounds and processes involved may also be very similar. Longer lasting measurements of the volatil-ity of nanoparticles, and possibly new measurement meth-ods, will hopefully shed more light on the topics discussed in this paper.
Acknowledgements. We are grateful to personnel at SMEAR II and
the Hyyti¨al¨a Forestry Station for their assistance during the mea-surements. This work was partly supported by the European Com-mission via the project “Quantification of Aerosol Nucleation in the European Boundary Layer” (QUEST) (EVK2-CT2001-00127). The Smart-SMEAR service (http://www.atm.helsinki.fi/∼junninen)
facilitated the comparison of meteorological and backtrajectory data.
684 M. Ehn et al.: Non-volatile residuals of newly formed particles References
Aalto, P., H¨ameri, K., Becker, E., Weber, R., Salm, J., M¨akel¨a, J. M., Hoell, C., O’Dowd, C. D., Karlsson, H., Hansson, H.-C., V¨akev¨a, M., Koponen, I. K., Buzorius, G., and Kulmala, M.: Physical characterization of aerosol particles during nucleation events, Tellus, 53B, 344–358, 2001.
Birmili, W., Berresheim, H., Plass-D¨ulmer, C., Elste, T., Gilge, S., Wiedensohler, A., and Uhrner, U.: The Hohenpeissenberg aerosol formation experiment (HAFEX): A long-term study in-cluding size-resolved aerosol, H2SO4, OH, and monoterpenes measurements, Atmos. Chem. Phys., 3, 361–376, 2003, http://www.atmos-chem-phys.net/3/361/2003/.
Burtscher, H., Baltensperger, U., Bukowiecki, N., Cohn, P., H¨uglin, C., Mohr, M., Matter, U., Nyeki, S., Schmatloch, V., Streit, N., and Weingartner, E.: Separation of volatile and non-volatile aerosol fractions by thermodesorption: instrumental develop-ment and applications, J. Aerosol Sci., 32, 427–442, 2001. Clarke, A.: Atmospheric nuclei in the remote free troposphere, J.
Atmos. Chem., 14, 479–488, 1992.
Covert, D. S., Kapustin, V. N., Quinn, P. K., and Bates, T. S.: New particle formation in the marine boundary layer, J. Geo-phys. Res., 97, 20 581–20 589, 1992.
Dal Maso, M., Kulmala, M., Riipinen, I., Wagner, R., Hussein, T., Aalto, P. P., and Lehtinen, K. E. J.: Formation and Growth of Fresh Atmospheric Aerosols: Eight Years of Aerosol Size Distri-bution Data from SMEAR II, Hyyti¨al¨a, Finland, Boreal Environ. Res., 10, 323–336, 2005.
Ehn, M., Pet¨aj¨a, T. Aufmhoff, H., Aalto, P., H¨ameri, K., Arnold, F., Laaksonen, A., and Kulmala, M.: Hygroscopic properties of ultrafine aerosol particles in the boreal forest: diurnal variation, solubility and the influence of sulfuric acid, Atmos. Chem. Phys., 7, 211–222, 2007,
http://www.atmos-chem-phys.net/7/211/2007/.
Haywood, J. and Boucher, O.: Estimates of the direct and indirect radiative forcing due to tropospheric aerosols: A review, Rev. Geophys., 38, 513–543, 2000.
Houghton, J. T., Ding, Y., Griggs, D. J., Noguer, M., van der Linden, P. J., Dai, X., Maskell, K., and Johnson, C. A. (Eds.): Climate Change 2001: The Scientific Basis, Cambridge University Press, Cambridge, United Kingdom and New York, NY, USA, 881 pp, 2001.
Kalberer, M., Paulsen, D., Sax, M., Steinbacher, M., Dommen, J., Prevot, A., Fisseha, R., Weingartner, E., Frankevich, V., Zenobi, R., and Baltensperger, U.: Identification of polymers as ma-jor components of atmospheric organic aerosols, Science, 303, 1659–1662, 2004.
Kulmala, M., H¨ameri, K., Aalto, P. P., M¨akel¨a, J. M., Pirjola, L., Nilsson, E. D., Buzorius, G., Rannik, ¨U., Dal Maso, M., Seidl, W., Hoffmann, T., Janson, R., Hansson, H.-C., Viisanen, Y., Laaksonen, A., and O’Dowd, C. D.: Overview of the interna-tional project on biogenic aerosol formation in the boreal forest (BIOFOR), Tellus B, 53, 324–343, 2001.
Kulmala, M., Vehkam¨aki, H., Pet¨aj¨a, T., Dal Maso, M., Lauri, A., Kerminen, V.-M., Birmili, W., and McMurry, P.: Formation and growth rates of ultrafine atmospheric particles: a review of ob-servations, J. Aerosol Sci., 35, 143–176, 2004.
Kulmala, M., Lehtinen, K. E. J., and Laaksonen, A.: Cluster activa-tion theory as an explanaactiva-tion of the linear dependence between formation rate of 3 nm particles and sulphuric acid concentration,
Atmos. Chem. Phys., 6, 787–793, 2006, http://www.atmos-chem-phys.net/6/787/2006/.
M¨akel¨a, J. M., Aalto, P., Jokinen, V., Pohja, T., Nissinen, A., Palm-roth, S., Markkanen, T., Seitsonen, K., Lihavainen, H., and Kul-mala, M.: Observations of ultrafine aerosol particle formation and growth in boreal forest, Geophys. Res. Lett., 24, 1219–1222, 1997.
O’Dowd, C., H¨ameri, K., M¨akel¨a, J., V¨akev¨a, M., Aalto, P., de Leeuw, G., Kunz, G., Becker, E., Hansson, H.-C., Allen, A., Harrison, R., Berresheim, H., Kleefeld, C., Geever, M., Jen-nings, S., and Kulmala, M.: Coastal new particle formation: Environmental conditions and aerosol physicochemical charac-teristics during nucleation bursts, J. Geophys. Res., 107, 8107, doi:10.1029/2001JD000206, 2002.
O’Dowd, C. D., Becker, E., M¨akel¨a, J. M., and Kulmala, M.: Aerosol physico-chemical chracterisctics over a boreal forest de-tremined by volatility analysis, Boreal Environ. Res., 5, 337– 348, 2000.
Paatero, P.: Least squares formulation of robust non-negative factor analysis, Chemometr. Intell. Lab., 37, 23–35, 1997.
Sakurai, H., Fink, M., McMurry, P., Mauldin, L., Moore, K., Smith, J., and Eisele, F.: Hygroscopicity and volatility of 4–10 nm particles during summertime, J. Geophys. Res., 110, D22S04, doi:10.1029/2005JD005918, 2005.
Smith, J. N., Moore, K. F., Eisele, F. L., Voisin, D., Ghimire, A. K., Sakurai, H., and McMurry, P. H.: Chemical composition of atmospheric nanoparticles during nucleation events in Atlanta, J. Geophys. Res., 110, D22S03, doi:10.1029/2005JD005912, 2005.
Stolzenburg, M. and McMurry, P.: An ultrafine aerosol condensa-tion nucleus counter, Aerosol Sci. Technol., 14, 48–65, 1991. Turpin, B., Saxena, P., and Andrews, E.: Measuring and simulating
particulate organics, Atmos. Environ., 34, 2983–3013, 2000. Vesala, T., Haataja, J., Aalto, P., Altimir, N., Buzorius, G., Garam,
E., H¨ameri, K., Ilvesniemi, H., Jokinen, V., Keronen, P., Lahti, T., Markkanen, T., M¨akel¨a, J., Nikinmaa, E., Palmroth, S., Palva, L., Pohja, T., Pumpanen, J., Rannik, ¨U., Siivola, E., Ylitalo, H., Hari, P., and Kulmala, M.: Long-term field measurements of atmosphere-surface interactions in boreal forest combining for-est ecology, micrometeorology, aerosol physics and atmospheric chemistry, Trends Heat, Mass Mom. Trans., 4, 17–35, 1998. Wang, S. and Flagan, R.: Scanning electrical mobility spectrometer,
Aerosol Sci. Technol., 13, 230–240, 1990.
Wehner, B., Philippin, S., and Wiedensohler, A.: Design and cal-ibration of a thermodenuder with and improved heating unit to measure the size-dependent volatile fraction of aerosol particles, J. Aerosol Sci., 33, 1087–1093, 2002.
Wehner, B., Pet¨aj¨a, T., Boy, M., Engler, C., Birmili, W., Tuch, T., Wiedensohler, A., and Kulmala, M.: The contribution of sulfu-ric acid and non-volatile compounds on the growth of freshly formed atmospheric aerosols, Geophys. Res. Lett., 32, L17810, doi:10.1029/2005GL023827, 2005.
Winklmayr, W., Reischl, G., Lindner, A., and Berner, A.: A new electromobility spectrometer for the measurement of aerosol size distributions in the size range from 1 to 1000 nm, J. Aerosol Sci., 22, 289–296, 1991.
Woo, K. S., Chen, D. R., Pui, D. Y. H., and McMurry, P. H.: Mea-surements of Atlanta Aerosol Size Distributions: Observations of Ultrafine Particles, Aerosol Sci. Technol., 34, 75–87, 2001.