HAL Id: hal-00295778
https://hal.archives-ouvertes.fr/hal-00295778
Submitted on 7 Nov 2005
HAL is a multi-disciplinary open access
archive for the deposit and dissemination of
sci-entific research documents, whether they are
pub-lished or not. The documents may come from
teaching and research institutions in France or
abroad, or from public or private research centers.
L’archive ouverte pluridisciplinaire HAL, est
destinée au dépôt et à la diffusion de documents
scientifiques de niveau recherche, publiés ou non,
émanant des établissements d’enseignement et de
recherche français ou étrangers, des laboratoires
publics ou privés.
Seasonal variations in the horizontal wind structure
from 0-100 km above Rothera station, Antarctica (67° S,
68° W)
R. E. Hibbins, J. D. Shanklin, P. J. Espy, M. J. Jarvis, D. M. Riggin, D. C.
Fritts, F.-J. Lübken
To cite this version:
R. E. Hibbins, J. D. Shanklin, P. J. Espy, M. J. Jarvis, D. M. Riggin, et al.. Seasonal variations
in the horizontal wind structure from 0-100 km above Rothera station, Antarctica (67° S, 68° W).
Atmospheric Chemistry and Physics, European Geosciences Union, 2005, 5 (11), pp.2973-2980.
�hal-00295778�
www.atmos-chem-phys.org/acp/5/2973/ SRef-ID: 1680-7324/acp/2005-5-2973 European Geosciences Union
Chemistry
and Physics
Seasonal variations in the horizontal wind structure from 0–100 km
above Rothera station, Antarctica (67
◦
S, 68
◦
W)
R. E. Hibbins1, J. D. Shanklin1, P. J. Espy1, M. J. Jarvis1, D. M. Riggin2, D. C. Fritts2, and F.-J. L ¨ubken3 1Physical Sciences Division, British Antarctic Survey, High Cross, Madingley Road, Cambridge, CB3 0ET, UK 2Colorado Research Associates, 3380 Mitchell Lane, Boulder, CO 80301, USA
3Leibniz-Institute of Atmospheric Physics, Schloss-Str. 6, 18 225, K¨uhlungsborn, Germany
Received: 2 May 2005 – Published in Atmos. Chem. Phys. Discuss.: 1 July 2005
Revised: 22 September 2005 – Accepted: 26 October 2005 – Published: 7 November 2005
Abstract. A medium frequency spaced-antenna radar has
been operating at Rothera station, Antarctica (67◦S, 68◦W)
for two periods, between 1997–1998 and since 2002, measur-ing winds in the mesosphere and lower thermosphere. In this paper monthly mean winds are derived and presented along with three years of radiosonde balloon data for comparison with the HWM-93 model atmosphere and other high latitude southern hemisphere sites. The observed meridional winds are slightly more northwards than those predicted by the model above 80 km in the winter months and below 80 km in summer. In addition, the altitude of the summer time zero crossing of the zonal winds above the westward jet is overestimated by the model by up to 8 km. These data are then merged with the wind climatology obtained from falling sphere measurements made during the PORTA campaign at Rothera in early 1998 and the HWM-93 model atmosphere to generate a complete zonal wind climatology between 0 and 100 km as a benchmark for future studies at Rothera. A west-wards (eastwest-wards) maximum of 44 ms−1 at 67 km altitude occurs in mid December (62 ms−1at 37 km in mid July). The 0 ms−1wind contour reaches a maximum altitude of 90 km in mid November and a minimum altitude of 18 km in Jan-uary extending into mid March at 75 km and early October at 76 km.
1 Introduction
The polar mesosphere and lower thermosphere is strongly coupled to the stratosphere and troposphere below by tides and upward propagating gravity waves. This coupling drives the mean circulation to states far removed from radiative equilibrium, and understanding the extent and degree of this coupling is vital to quantifying the main contributions to the
Correspondence to: R. E. Hibbins
energy and momentum budget of this region of the atmo-sphere. Rothera station is ideally situated for such studies on the Antarctic Peninsula at the edge of the wintertime po-lar vortex. Previous studies from Rothera have looked at the height of polar mesospheric clouds (Chu et al., 2004), the relationship between meridional wind and temperature in the winter mesopause (Espy et al., 2003), turbulence due to grav-ity waves in the mesosphere (Jones et al., 2004), the nature of the 12 h wave (Murphy et al., 2003; Riggin et al., 1999, 2003) and the temperature and horizontal wind structure in the summer mesosphere (L¨ubken et al., 1999, 2004).
This paper presents data from the Rothera MF radar (Jarvis et al., 1999) and radiosonde balloon launches which are com-bined with those from the Rothera PORTA rocket campaign in order to modify the HWM-93 model atmosphere zonal wind field above Rothera. The resulting climatology repre-sents the mean structure of the zonal wind field from ground level to 100 km altitude.
2 Data sources
The MF profiler radar at Rothera is a coherent spaced-sensor radar system used for measuring horizontal winds in the mesosphere and lower thermosphere through the observation and analysis of D-region partial reflection echoes. The radar employs a single broad-beam transmit antenna and three spaced receive antennas in a triangular array. The radar op-erates at a frequency of 1.98 MHz with a transmitter power of 25 kW and full width half maximum pulse width of 25 µs. This corresponds to a height resolution of ∼4 km sampled at 2 km height intervals between 50 and 100 km, with the majority of echoes returned from altitudes between 75 and 95 km. The system utilizes a full correlation analysis (Briggs, 1984; Holdsworth and Reid, 1995) to determine the wind field across the range of observations. A total of 1398 full or
2974 R. E. Hibbins et al.: Horizontal winds at Rothera
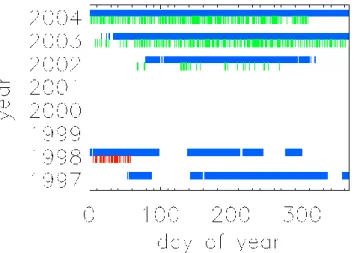
Fig. 1. Coverage of MF radar data recorded at Rothera used in this
study (blue) together with falling sphere rocket launch times (red) and radiosonde balloon launch times (green).
partial days of data recorded between 23 February 1997 and 31 December 2004 are included in this study.
A routine radiosonde program of between 2 and 4 launches per week has operated at Rothera since early 2002. Launches are normally timed for the 12:00 UT main synoptic hour, however, during the winter of 2003, balloons were launched for a special ozonesonde campaign at non standard times to obtain “matches” with other Antarctic stations. The diosonde system at the station uses Vaisala RS80 GPS ra-diosondes in conjunction with an MW15 processor, which processes the GPS signal to produce 1 min mean winds from near the surface to balloon burst, which is typically at around 20 km altitude. The balloons normally rise at ∼4.5 ms−1. The results presented here include data recorded from 339 balloon launches between 22 February 2002 and 8 Novem-ber 2004, of which 87% were launched between 10:00 and 14:00 UT.
The falling sphere technique, and the PORTA rocket cam-paign at Rothera in early 1998 have been extensively de-scribed elsewhere (Schmidlin, 1991; L¨ubken et al., 1999, 2005). Horizontal winds between 35 and 80 km are derived from high-precision radar tracking of the descent of a 1 m metalized mylar sphere released from a rocket at a typi-cal altitude of 110 km. A total of 26 rocket launches were undertaken at Rothera between 4 January and 27 February 1998 (75% of which were launched within 2 h of local noon, 16:33 UT, to minimise tidal influence from one launch to the next) and the monthly mean zonal wind reproduced here is taken from the climatology derived from these observations published in L¨ubken et al. (2004). L¨ubken et al. (2004) do not publish a meridional wind climatology from the Rothera falling sphere data, since they showed that meridional winds (unlike the zonal winds) are significantly biased by tidal ef-fects (see M¨ullemann and L¨ubken, 2005).
Figure 1 summarises the data coverage from all sources used in this study, showing the two periods of operation of the MF radar coincident with the rocket launches in 1998 and the balloons in 2002–2004.
3 Data analysis
3.1 MF radar
Zonal and meridional wind data for each height range be-tween 64 and 98 km were binned into half hourly means. These half hourly means were then combined into daily run-ning three-day segments to which a 12 and 24 h sine wave and mean bias were fitted. Thus, a mean wind and a 12 and 24 h tidal phase and amplitude were calculated for each day of operation to separate the mean background wind from the tidal influence. Three-day periods with less than one third of available data (48 half hourly means) were excluded from the fitting process to reduce the number of spurious data points. Individual three-day mean winds were then combined to give a mean wind for each calendar month of operation. The standard deviation was determined from the spread of data recorded each month at each height bin and typically ranged from 2 ms−1 in the summer at high altitudes to as high as 20 ms−1at low altitudes in winter.
3.2 Radiosondes
Wind speed and direction data from each successful balloon flight was converted into zonal and meridional components and averaged into 1 km altitude bins between 0 and 21 km (the maximum height reached by 50% of the balloons). These were then combined by calendar month into monthly mean wind components with variability calculated from the standard deviation for all the mean measurements made in each height bin for a given month. These monthly standard deviations are typically 8 ms−1, but range from 2 ms−1to a maximum of 18 ms−1at around 8 km altitude in wintertime. 3.3 Falling spheres
January and February mean zonal winds for each 1 km height bin between 35 and 70 km were calculated by averaging the climatology published in tenths of a month in L¨ubken et al. (2004). Errors were taken from the quoted RMS devia-tion from the fit increasing linearly from 4 ms−1at 35 km to 10 ms−1at 70 km.
4 Mean winds
Rothera monthly mean zonal and meridional winds recorded between 0 and 21 km and 63 and 99 km are reproduced in Fig. 2. In the mesosphere and lower thermosphere the main features of the data are a strong reversal of the zonal jet below
Fig. 2. Monthly mean zonal and meridional winds recorded from Rothera with the MF radar (top panels) and radiosondes (bottom panels).
The thick red line represents the 0 ms−1contour with other contours drawn at 10 ms−1intervals for the zonal winds and 5 ms−1intervals for the meridional winds (blue: westwards/southwards).
85 km from a summertime westward maximum of 44 ms−1
in mid December to a wintertime eastward maximum of 40 ms−1 in early July. The wintertime eastward zonal jet
lessens with height to around 10 ms−1at 95 km altitude. The
same applies to the summertime westward jet, which under-goes a westward to eastward reversal around 87 km contin-uing to a maximum of 15 ms−1eastward at 95 km although the apparent reduction in the magnitude of the summertime zonal wind shear observed above ∼90 km could be an arte-fact of the MF radar techniques as discussed below. The meridional winds are generally much weaker than the zonal winds. In wintertime the meridional wind is southward (up to 15 ms−1)at low altitudes, reverses its direction around 75 km and reaches 10 ms−1 northwards at 95 km. In summer the meridional winds are northwards (10 ms−1) between 75 and 90 km and fall to around zero above and below this.
Between 0 and 21 km the wintertime zonal winds increase eastwards with increasing altitude reaching a maximum of 40 ms−1 at 21 km in August. In summer the low altitude zonal winds are light (<10 ms−1) eastwards. In general the monthly zonal winds are less variable in the lower strato-sphere than they are in the tropostrato-sphere, except in late win-ter and spring. At this time the station is sometimes inside and sometimes outside the strong circumpolar vortex. This strong winter circulation usually begins to break down in late October or early November, and by late December a gen-erally stagnant summer circulation is in place. The vortex then begins to build again during the autumn. The meridional winds are southwards (<10 ms−1) in summer and late win-ter/spring reversing northwards (<15 ms−1) in autumn and late spring.
4.1 Comparison with other southern hemisphere sites Several authors have investigated inconsistencies between winds derived from MF radars and other techniques (e.g. Khattatov et al., 1996; Manson et al., 2004; Hock-ing and Thayaparan, 1997; Thayaparan and HockHock-ing, 2002; Portnyagin et al., 2004a). MF radars are believed to un-derestimate wind speeds above ∼90 km (especially in win-ter) relative to meteor radars, and to suffer from group re-tardation (Namboothiri et al., 1993) and E-region echo con-tamination (Hocking, 1997) in summertime above ∼95 km. For instance, the zonal wind at Molodezhnaya (68◦S, 45◦E) recorded between 1967 and 1987 with a meteor radar ap-proximating to 95 km altitude varies between 20 ms−1
east-wards in the winter and 12 ms−1 westwards in November
(Portnyagin et al., 1993). At Rothera the winds at the same altitude are eastwards all year between 15 ms−1 in sum-mer down to <5 ms−1around the equinoxes, and the zonal wind reversal between October and December at Molodezh-naya is not seen at Rothera. The corresponding merid-ional wind at Molodezhnaya is northward (0–5 ms−1) around the equinoxes as seen at Rothera, but at mid winter turns southwards (5–10 ms−1) and strongly northwards (15 ms−1) in mid summer, the opposite of the behaviour observed at Rothera at 95 km.
However, Rothera is at a similar latitude to several stations where long-term obsevations of winds in the mesosphere and lower thermosphere have been undertaken with MF radars. Hence, comparison can be made with climatologies gener-ated from data recorded at longitudinally distinct sites us-ing the same technique, though from different times. As
2976 R. E. Hibbins et al.: Horizontal winds at Rothera
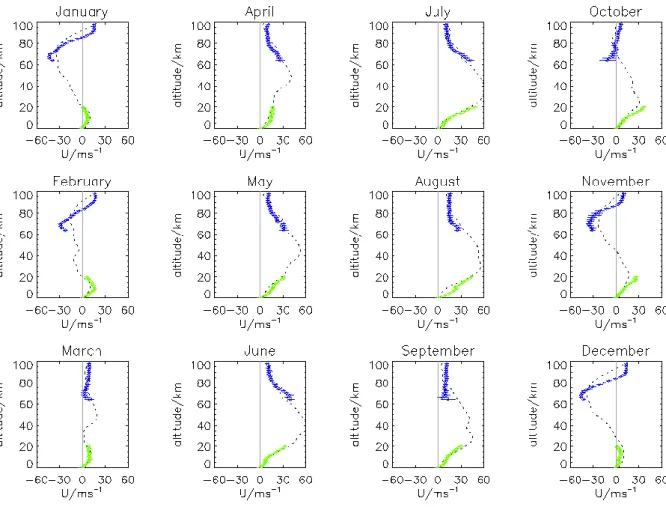
Fig. 3. Rothera monthly mean meridional winds below 100 km. Green diamonds: radiosonde data; blue diamonds MF radar winds. The
error bars represent the standard error of the mean. The dotted black line is the monthly mean HWM-93 model meridional wind for Rothera.
Portnyagin et al. (1993) have shown, significant year on year variability exists in the mean winds in the mesosphere and lower thermosphere (at Molodezhnaya annual mean zonal winds recorded between 1968 and 1985 have a standard de-viation about the mean of ∼6 ms−1) similar to the standard error on the mean MF radar winds presented here. At Maw-son station (67◦S, 63◦E) observations undertaken between 1984 and 1986 show that the summertime westwards to east-wards wind reversal occurs significantly higher than that ob-served at Rothera, ranging from 100 km in October to 90 km in March (Portnyagin et al., 1993). The wintertime eastward wind is slightly stronger (10–15 ms−1) at Mawson between 80 and 98 km than that observed at Rothera (5–10 ms−1). The meridional winds at Mawson and Rothera are very simi-lar with the only notable difference occurring in March where the meridional wind turns southwards (5–10 ms−1)at
Maw-son between 80 and 100 km, a feature not observed in the Rothera data. The mean zonal winds at Davis (69◦S, 78◦E)
between 1994 and 2003 and Syowa (69◦S, 40◦E) between 1999 and 2003 are very similar (Dowdy et al., 2001, 2004; Kishore et al., 2003). At 80 km altitude both sites see a rever-sal of the mean wind field in mid March and early October as
seen at Rothera. The winter time eastward jet at Syowa and Davis is between 10 and 20 ms−1at 80 km, slightly stronger
than that observed at Rothera, and the westward summer time jet at Davis and Syowa is also around 10 ms−1stronger than at Rothera.
4.2 Comparison with Andøya (69◦N, 16◦E)
M¨ullemann and L¨ubken (2005) have presented a summer-time zonal wind climatology from Andøya rocket range (69◦N, 16◦E) between 35 and 80 km based on falling sphere data gathered over 125 rocket flights recorded during var-ious campaigns between 1991 and 2002. Comparison be-tween this and the Rothera zonal winds over the common range of altitudes shows that in the southern hemisphere the westwards maximum wind occurs much earlier in the sum-mer and at a much lower altitude than at a comparable north-ern hemisphere latitude (67 km in mid December at Rothera compared to above 80 km in mid August at Andøya). The autumn westward to eastward wind reversal occurs at a simi-lar time of year at each site (∼80 days after solstice at 70 km altitude) although the rate at which the wintertime eastwards
Fig. 4. As Fig. 3 but for Rothera zonal winds.
wind increases is much greater in the northern hemisphere, e.g. at 70 km altitude the wind increases from 0 to 25 ms−1 within 20 days at Andøya whereas 20 days after the au-tumn zero crossing at Rothera the 70 km zonal wind is only 15 ms−1eastwards.
4.3 Comparison with empirical models
Figures 3 and 4 show the monthly mean meridional and zonal winds recorded with the MF radar and radiosonde balloon launches for comparison with the HWM-93 model atmo-sphere (Hedin et al., 1996). There is a tendency for the mean observed meridional winds to be more northwards than the HWM-93 model atmosphere winds, particulary above 80 km in winter time (April to September) and between 65 and 80 km in the summer months (November to February). The wintertime transition from poleward to equatorward merid-ional flow at Rothera occurs up to 15 km lower than that pre-dicted by the model (e.g. in June, 78 km rather than 91 km). However, elsewhere the model meridional winds agree with the observational data to within natural variability and ex-perimental uncertainty. For the zonal wind component the only point at which the model deviates significantly from
the observed winds occurs at high altitudes in summertime (November to February). The maximum extent of the west-ward summertime zonal jet is observed to be up to 10 ms−1 stronger than that predicted by the model and occurs ∼7 km lower than HWM-93. This is also the case in compari-son with the zonally-averaged GEWM-1 empirical model of Portnyagin et al. (2004b) indicative of atypical summer time gravity wave breaking at Rothera (Lindzen, 1981; Garcia and Solomon, 1985). In all other cases the observed zonal winds and the HWM-93 model winds are in excellent agreement.
5 Zonal wind climatology
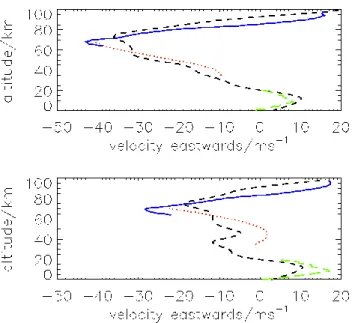
Figure 5 shows the monthly mean zonal winds recorded with the MF radar for comparison with the falling sphere data recorded in January and Febraury 1998 at Rothera. Where the data overlap (between 64 and 70 km) the two techniques are found to agree to within 4 ms−1in January and 10 ms−1 in February. This agreement is within the individual errors associated with each technique at these altitudes (10 ms−1 for the falling spheres and ∼5 ms−1for the MF radar in sum-mer), though both techniques show a greater westward extent
2978 R. E. Hibbins et al.: Horizontal winds at Rothera
Fig. 5. Mean zonal wind recorded with the MF radar (solid blue
line), falling spheres (short dashed red line) and radiosondes (long dashed green line) for January (upper panel) and February (lower panel). HWM-93 model zonal winds are shown for comparison (dashed black line). Error bars (see Figs. 3 and 4) are omitted for clarity.
Fig. 6. Mean zonal wind above Rothera from 0–100 km. Generated
from 6th order polynomial fits to the monthly mean data and, within the hatched area, monthly mean HWM-93 model winds. The thick red line represents the 0 ms−1contour, other contours are drawn at 10 ms−1intervals (blue: westwards).
of the summer time zonal jet around 60 to 70 km altitude than the HWM-93 model.
The two data sets were combined to give a weighted aver-age zonal wind between 64 and 70 km for January and Febru-ary. Then, in order to generate a complete zonal wind clima-tology below 100 km, gaps in the altitude coverage of the mean monthly data (22–34 km in January and February and
Fig. 7. Rothera zonal wind climatology (see Fig. 5) minus the
HWM-93 model zonal winds. Hatched area and solid red line as in Fig. 6, contours are drawn at 5 ms−1intervals (blue: negative).
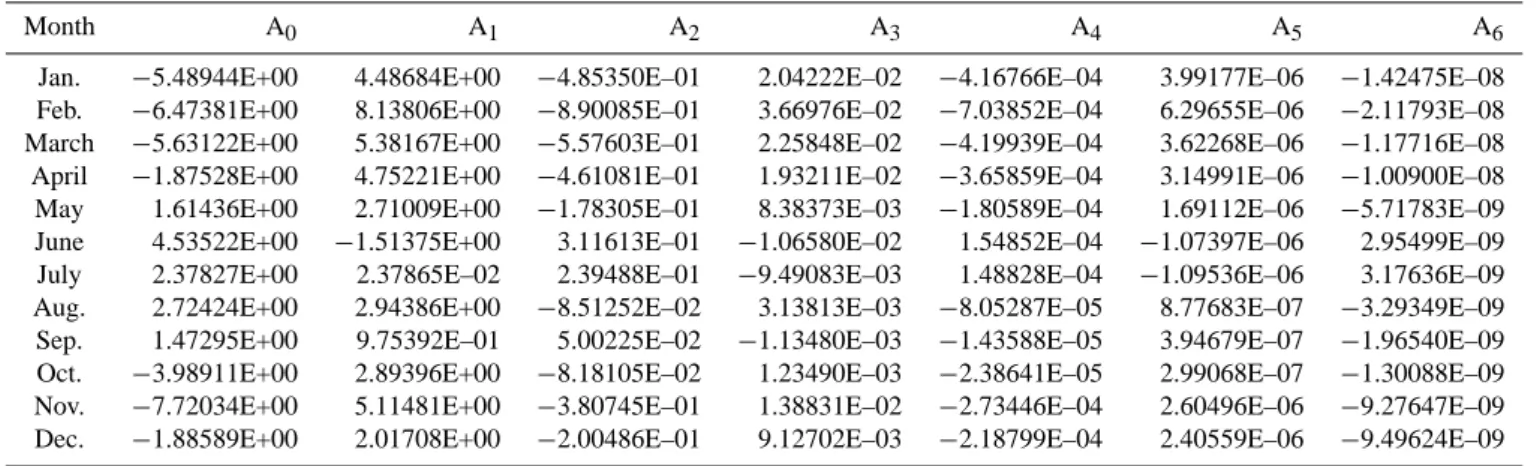
22–62 km in all other months) were filled with the monthly mean zonal winds generated from the HWM-93 model. The resulting monthly wind profiles were then fitted with poly-nomials of increasing order until the goodness of fit (as mea-sured by the chi squared of the polynomial fit to the data) did not significantly improve. The resulting sixth order polyno-mial fits to the monthly profiles, the coefficients of which are listed in Table 1, were then combined to generate the con-tour plot reproduced in Fig. 6 which clearly illustrates the seasonal variations in the zonal wind field from summertime westwards to wintertime eastwards flow.
A westwards maximum of 44 ms−1 at 67 km altitude occurs in mid December with an eastwards maximum of 62 ms−1at 37 km in mid July. The 0 ms−1wind contour,
rep-resenting the transition from westwards to eastwards zonal flow, extends into early March at 75 km and is crossed again in early October in the transition from wintertime eastwards to summertime westwards flow. The maximum altitude of the 0 ms−1 contour occurs at 90 km at the beginning of November, before the summertime westward zonal jet is fully established, and then descends to 82 km by the end of February.
Figure 7 shows the difference between the Rothera monthly zonal wind climatology and the HWM-93 monthly mean zonal winds. The lack of agreement between the data and the model in the height and extent of the summertime westward jet above Rothera is clearly visible in the difference contours with a large positive difference peaking at 90 km in December and a negative difference around 70 km in spring and summer.
Table 1. Coefficients for the monthly sixth order polynomial fits to the mean zonal wind in ms−1 at Rothera between z=0 and 99 km: U (z)= 6 P n=0 Anzn. Month A0 A1 A2 A3 A4 A5 A6
Jan. −5.48944E+00 4.48684E+00 −4.85350E–01 2.04222E–02 −4.16766E–04 3.99177E–06 −1.42475E–08 Feb. −6.47381E+00 8.13806E+00 −8.90085E–01 3.66976E–02 −7.03852E–04 6.29655E–06 −2.11793E–08 March −5.63122E+00 5.38167E+00 −5.57603E–01 2.25848E–02 −4.19939E–04 3.62268E–06 −1.17716E–08 April −1.87528E+00 4.75221E+00 −4.61081E–01 1.93211E–02 −3.65859E–04 3.14991E–06 −1.00900E–08 May 1.61436E+00 2.71009E+00 −1.78305E–01 8.38373E–03 −1.80589E–04 1.69112E–06 −5.71783E–09 June 4.53522E+00 −1.51375E+00 3.11613E–01 −1.06580E–02 1.54852E–04 −1.07397E–06 2.95499E–09 July 2.37827E+00 2.37865E–02 2.39488E–01 −9.49083E–03 1.48828E–04 −1.09536E–06 3.17636E–09 Aug. 2.72424E+00 2.94386E+00 −8.51252E–02 3.13813E–03 −8.05287E–05 8.77683E–07 −3.29349E–09 Sep. 1.47295E+00 9.75392E–01 5.00225E–02 −1.13480E–03 −1.43588E–05 3.94679E–07 −1.96540E–09 Oct. −3.98911E+00 2.89396E+00 −8.18105E–02 1.23490E–03 −2.38641E–05 2.99068E–07 −1.30088E–09 Nov. −7.72034E+00 5.11481E+00 −3.80745E–01 1.38831E–02 −2.73446E–04 2.60496E–06 −9.27647E–09 Dec. −1.88589E+00 2.01708E+00 −2.00486E–01 9.12702E–03 −2.18799E–04 2.40559E–06 −9.49624E–09
6 Summary
Data from an MF radar, radiosonde balloon launches and falling sphere measurements have been used to modify the HWM-93 model to generate a new wind climatology show-ing the seasonal variation in the zonal wind field above Rothera station, Antarctica. Differences are observed be-tween the modified and unmodified model particularly in the height and extent of the westwards zonal jet observed in the summertime high altitude winds. These differences are also seen in comparisons between the mean winds observed at Rothera and those from other northern and southern hemi-sphere sites of similar latitude indicative of an atypical grav-ity wave field around Rothera. Combined lidar and airglow imager studies are currently underway to further investigate the nature of the gravity wave activity at Rothera.
Acknowledgements. The authors would like to thank the staff of the
Engineering and Data Management Group and of the Meteorologi-cal and Ozone Monitoring Unit of the PhysiMeteorologi-cal Sciences Division at the British Antarctic Survey for their technical assistance, and for the maintenance and operation of the MF radar and radiosonde system. Research support for D. C. Fritts and D. M. Riggin was provided under NSF Office of Polar Programs grant OPP-0438777.
Edited by: W. Ward
References
Briggs, B. H.: The analysis of spaced sensor records by correla-tion techniques, Handbook for Middle Atmosphere Program, 13, 1984.
Chu, X., Nott, G. J., Espy, P. J., Gardner, C. S., Diettrich, J. C., Clilverd, M. A., and Jarvis, M. J.: Lidar observations of polar mesospheric clouds at Rothera, Antarctica (67.5◦S, 68.0◦W),
Geophys. Res. Lett., 31, L02114, doi:10.1029/2003GL018638, 2004.
Dowdy, A., Vincent, R. A., Igarashi, K., Murayama, Y., and Mur-phy, D. J.: A comparison of mean winds and gravity wave activ-ity in the northern and southern polar MLT, Geophys. Res. Lett., 28(8), 1475–1478, 2001.
Dowdy, A., Vincent, R. A., Murphy, D. J., Tsutsumi, M., Rig-gin, D. M., and Jarvis, M. J.: The large scale dynamics of the mesosphere-lower thermosphere during the Southern Hemi-sphere stratospheric warming of 2002, Geophys. Res. Lett., 31, L14102, doi:10.1029/2004GL020282, 2004.
Espy, P. J., Hibbins, R. E., Jones, G. O. L., Riggin, D. M., and Fritts, D. C.: Rapid, large-scale temperature changes in the polar mesosphere and their relationship to meridional flows, Geophys. Res. Lett., 30(5), 1240, doi:10.1029/2002GL016452, 2003. Garcia, R. R. and Solomon, S.: The effect of breaking gravity waves
on the dynamics and chemical composition of the mesosphere and lower thermosphere, J. Geophys. Res., 90(D2), 3850–3868, 1985.
Hedin, A. E., Fleming, E. L., Manson, A. H., Schmidlin, F. J., Av-ery, S. K., Clark, R. R., Franke, S. J., Fraser, G. J., Tsuda, T., Vial, F., and Vincent, R. A.: Empirical wind model for the up-per, middle and lower atmosphere, J. Atmos. Terr. Phys., 58(13), 1421–1447, 1996.
Hocking, W. K.: Strengths and limitations for MST radar measure-ments of middle atmosphere winds, Ann. Geophys., 15, 1111– 1122, 1997,
SRef-ID: 1432-0576/ag/1997-15-1111.
Hocking, W. K. and Thayaparan, T.: Simultaneous and colocated observation of winds and tides by MF and meteor radars over London, Canada (43◦N, 81◦W), during 1994–1996, Radio Sci., 32(2), 833–866, doi:10.1029/96RS03467, 1997.
Holdsworth, D. A. and Reid, I. M.: A simple model of atmospheric radar backscatter: description and application to the full correla-tion analysis of spaced antenna data, Radio Sci., 30, 1263–1280, 1995.
2980 R. E. Hibbins et al.: Horizontal winds at Rothera
Jarvis, M. J., Jones, G. O. L., and Jenkins, B.: New initiatives in ob-serving the Antarctic mesosphere, Adv. Space Res., 24(5), 611– 619, 1999.
Jones, G. O. L., Clilverd, M. A., Espy, P. J., Chew, S., Fritts, D. C., and Riggin, D. M.: An alternative explanation of PMSE-like scatter in MF radar data, Ann. Geophys., 22, 2715–2722, 2004,
SRef-ID: 1432-0576/ag/2004-22-2715.
Khattatov, B. V., Geller, M. A., Yudin, V. A., Hays, P. B., Skin-ner, W. R., Burrage, M. D., Franke, S. J., Fritts, D. C., Isler, J. R., Manson, A. H., Meek, C. E., McMurray, R., Singer, W., Hoffmann, P., and Vincent, R. A.: Dynamics of the mesosphere and lower thermosphere as seen by MF radars and by the high-resolution Doppler imager/UARS, J. Geophys. Res., 101(D6), 10 393–10 404, 1996.
Kishore, P., Namboothiri, S. P., Igarashi, K., Murayama, Y., Vin-cent, R. A., Dowdy, A., Murphy, D. J., and Watkins, B. J.: Fur-ther evidence of hemispheric differences in the MLT mean wind climatology: Simultaneous MF radar observations at Poker Flat (65◦N, 147◦W) and Davis (69◦S, 78◦E), Geophys. Res. Lett., 30(6), 1336, doi:10.1029/2002GL016750, 2003.
Lindzen, R. S.: Turbulence and stress owing to gravity wave and tidal breakdown, J. Geophys. Res., 86, 9707–9714, 1981. L¨ubken, F.-J., Jarvis, M. J., and Jones, G. O. L.: First insitu
temper-ature measurements at the Antarctic summer mesopause, Geo-phys. Res. Lett., 26, 3581–3584, 1999.
L¨ubken, F.-J., M¨ullemann, A., and Jarvis, M. J.: Temperatures and horizontal winds in the Antarctic summer mesosphere, J. Geophys. Res., 109(D24), D24112, doi:10.1029/2004JD005133, 2004.
Manson, A. H., Meek, C. E., Hall, C. M., Nozawa, S., Mitchell, N. J., Pancheva, D., Singer, W., and Hoffmann, P.: Mesopause dynamics from the Scandinavian triangle of radars within the PSMOS-DATAR project, Ann. Geophys., 22, 367–386, 2004,
SRef-ID: 1432-0576/ag/2004-22-367.
M¨ullemann, A. and L¨ubken, F.-J.: Horizontal winds in the meso-sphere at high latitudes, Adv. Space Res., 35(11), 1890–1894, doi:10.1016/j.asr.2004.11.014, 2005.
Murphy, D. J., Tsutsumi, M., Riggin, D. M., Jones, G. O. L., Vin-cent, R., Hagan, M. E., and Avery, S. K.: Observations of a nonmigrating component of the semidiurnal tide over Antarctica, J. Geophys. Res., 108(D8), 4241, doi:10.1029/2002JD003077, 2003.
Namboothiri, S. P., Manson, A. H., and Meek, C. E.: E region real heights and their implications for MF-radar derived wind and tidal climatologies, Radio Sci., 28, 187–202, 1993.
Portnyagin, Y. I., Forbes, J. M., Fraser, G. J., Vincent, R. A., Av-ery, S. K., Lysenko, I. A., and Makarov, N. A.: Dynamics of the Antarctic and Arctic mesosphere and lower thermosphere regions-I, The prevailing wind, J. Atmos. Terr. Phys., 55(6), 827– 841, 1993.
Portnyagin, Y. I. , Solovjova, T. V., Makarov, N. A., Merzlyakov, E. G., Manson, A. H., Meek, C. E., Hocking, W., Mitchell, N., Pancheva, D., Hoffmann, P., Singer, W., Murayama, Y., Igarashi, K., Forbes, J. M., Palo, S., Hall, C., and Nozawa, S.: Monthly mean climatology of the prevailing winds and tides in the Arc-tic mesosphere/lower thermosphere, Ann. Geophys., 22, 3395– 3410, 2004a,
SRef-ID: 1432-0576/ag/2004-22-3395.
Portnyagin, Y. I., Solovjova, T., Merzlyakov, E., et al.: Meso-sphere/lower thermosphere prevailing wind model, Adv. Space Res., 34, 1755–1762, 2004b.
Riggin, D., Fritts, D. C., Jarvis, M. J., and Jones, G. O. L.: Spatial structure of the 12-hour wave in the Antarctic as observed by radar, Earth Planets Space, 51, 621–628, 1999.
Riggin, D., Meyer, C. K., Fritts, D. C., Murayama, Y., Igarashi, K., Vincent, R. A., Singer, W., and Murphy, D. J.: MF radar observations of semidiurnal motions in the mesosphere at high northern and southern latitudes, J. Atmos. Solar-Terr. Phys., 65, 483–493, 2003.
Schmidlin, F. J.: The inflatable sphere: A technique for the accurate measurement of middle atmosphere temperatures, J. Geophys. Res., 96, 22 673–22 682, 1991.
Thayaparan, T. and Hocking, W. K.: A long-term comparison of winds and tides measured at London, Canada (43◦N, 81◦W) by co-located MF and meteor radars during 1994–1999, J. Atmos. Solar-Terr. Phys., 64, 931–946, 2002.