HAL Id: hal-00963439
https://hal.archives-ouvertes.fr/hal-00963439
Submitted on 21 Jan 2021
HAL is a multi-disciplinary open access
archive for the deposit and dissemination of
sci-entific research documents, whether they are
pub-lished or not. The documents may come from
teaching and research institutions in France or
abroad, or from public or private research centers.
L’archive ouverte pluridisciplinaire HAL, est
destinée au dépôt et à la diffusion de documents
scientifiques de niveau recherche, publiés ou non,
émanant des établissements d’enseignement et de
recherche français ou étrangers, des laboratoires
publics ou privés.
(CPO) and microstructures - implications for CPO
origin, strength, symmetry and seismic anisotropy in
gabbroic rocks
Takako Satsukawa, Benoit Ildefonse, David Mainprice, Luis Morales, K.
Michibayashi, Fabrice Barou
To cite this version:
Takako Satsukawa, Benoit Ildefonse, David Mainprice, Luis Morales, K. Michibayashi, et al.. A
database of plagioclase crystal preferred orientations (CPO) and microstructures - implications for
CPO origin, strength, symmetry and seismic anisotropy in gabbroic rocks. Solid Earth, European
Geosciences Union, 2013, 4 (2), pp.511-542. �10.5194/se-4-511-2013�. �hal-00963439�
www.solid-earth.net/4/511/2013/ doi:10.5194/se-4-511-2013
© Author(s) 2013. CC Attribution 3.0 License.
Solid Earth
A database of plagioclase crystal preferred orientations (CPO) and
microstructures – implications for CPO origin, strength, symmetry
and seismic anisotropy in gabbroic rocks
T. Satsukawa1,2,*, B. Ildefonse2, D. Mainprice2, L. F. G. Morales3, K. Michibayashi1,4, and F. Barou2 1Graduate School of Science and Technology, Shizuoka University, Ohya 836, Shizuoka 422-8529, Japan 2Géosciences Montpellier, Université Montpellier 2 and CNRS, CC 060, 34095 Montpellier cedex 5, France
3Helmholtz Zentrum Potsdam, Deutsches GeoForschungsZentrum (GFZ), Telegrafenberg, 14473 Potsdam, Germany 4Institute of Geosciences, Shizuoka University, Ohya 836, Shizuoka 422-8529, Japan
*present address: ARC Center of Excellence for Core to Crust Fluid Systems (CCFS) and GEMOC National Key Centre,
Department of Earth and Planetary Sciences, Macquarie University, Sydney, NSW 2109, Australia
Correspondence to: T. Satsukawa ([email protected])
Received: 3 August 2013 – Published in Solid Earth Discuss.: 14 August 2013
Revised: 14 November 2013 – Accepted: 19 November 2013 – Published: 18 December 2013
Abstract. This study presents a unique database of 172
pla-gioclase Crystallographic Preferred Orientations (CPO) of variously deformed gabbroic rocks. The CPO characteris-tics as a function of the deformation regime (magmatic or crystal-plastic) are outlined and discussed. The studied sam-ples are dominantly from slow- and fast-spread present-day ocean crust, as well as from the Oman ophiolite. Plagioclase is the dominant mineral phase in the studied samples. Plagio-clase CPOs are grouped into three main categories: Axial-B, a strong point alignment of (010) with a girdle distribution of [100]; Axial-A, a strong point maximum concentration of [100] with parallel girdle distributions of (010) and (001); and P-type, point maxima of [100], (010), and (001). A ma-jority of CPO patterns are Axial-B and P-type, in samples showing either magmatic or crystal-plastic deformation tex-tures. Axial-A CPOs are less common; they represent 21 % of the samples deformed by crystal-plastic flow. Although fabric strength (ODF J index) does not show any consis-tent variation as a function of the CPO patterns, there is a significant difference in the relationship between the ODF and pole figures J indices; the magmatic type microstruc-tures have high (010) pole figures J indices, which increase linearly with ODF J index, whereas the high [100] pole fig-ures J indices of plastically deformed samples vary in a more scattered manner with ODF J index. The multistage na-ture of plastic deformation superposed on a magmatic
struc-ture compared with magmatic flow, and the large number of possible slip-systems in plagioclase probably account for these differences. Calculated seismic properties (P wave and Swave velocities and anisotropies) of plagioclase aggregates show that anisotropy (up to 12 % for P wave and 14 % for Swave) tends to increase as a function of ODF J index. In comparison with the olivine 1998 CPO database, the magni-tude of P wave anisotropy for a given J index is much less than olivine, whereas it is similar for S wave anisotropy. De-spite a large variation of fabric patterns and geodynamic set-ting, seismic properties of plagioclase-rich rocks have simi-lar magnitudes of anisotropy. There is a small difference in the aggregate elastic symmetry, with magmatic microstruc-tures having higher orthorhombic and hexagonal compo-nents, whereas plastic deformation microstructures have a slightly higher monoclinic component, possibly correlated with predominant monoclinic simple shear flow in plastically deformed samples. Overall, plots for CPO strength (ODF J index), pole figure strength, CPO symmetry and seismic anisotropy show significant scattering. This could be related to sampling statistics, although our database is a factor of ten higher than the olivine database of 1998, or it could be re-lated to the low symmetry (triclinic) structure of plagioclase resulting in the addition of degrees of freedom in the pro-cesses creating the CPOs.
1 Introduction
The study of the crystallographic preferred orientations (CPO) of naturally and experimentally deformed materials provides crucial insight into geodynamic processes (e.g., Nicolas and Christensen, 1987; Karato, 2008). They are a key component of our understanding of the material pro-cesses, mechanical behavior and deformation strain history, from the crustal levels to the deep mantle. The CPOs also induces anisotropic behavior of certain physical properties commonly measured in rocks, such as seismic velocity (e.g., Ben Ismaïl and Mainprice, 1998; Jung and Karato, 2001; Tommasi et al., 2008; Lloyd et al., 2009), thermal diffusivity (e.g., Tommasi et al., 2001; Gibert and Mainprice, 2009) and chemical diffusivity (e.g., Mackwell and Kohlstedt, 1990).
Plagioclase CPO is a common feature in both oceanic and continental crust (e.g., Kruhl, 1987; Mainprice and Nicolas, 1989; Benn and Allard, 1989; Ji and Mainprice, 1988; Boudier and Nicolas, 1995; Lamoureux et al., 1999; Yaouancq and Macleod, 2000; Harigane et al., 2008, 2011; Mehl and Hirth, 2008; Svahnberg and Piazolo, 2010; Díaz-Azpiroz et al., 2011; Morales et al., 2011; Pearce et al., 2011; Jousselin et al., 2012; Higgie and Tommasi, 2012), in which it primarily controls the rheology of the lower crust. Sim-ilar to a number of typically “crustal” phases (e.g. quartz, K-feldspars, phyllosilicates), the CPOs vary from mineral fabrics typically formed by magmatic processes to crys-tallographic orientations resulting from crystal-plastic pro-cesses. These two processes are commonly superposed in the same aggregate, with crystal-plastic deformation overprint-ing magmatic fabrics, leadoverprint-ing to complex fabrics that cannot be easily attributed to a dominant process. Although not yet quantified, dissolution processes during metamorphic reac-tions can be attributed to plagioclase deformation (e.g. Imon et al., 2002), and might also result in the development of crystallographic preferred orientations.
One of the main difficulties when dealing with crystallo-graphic preferred orientation of plagioclase is that the CPOs resulting from magmatic flow and dislocation creep are gen-erally similar to each other. In dislocation creep, the main slip systems in plagioclase are [001](010), [100](001) and h110i (001) (Marshal and McLaren, 1997; Montardi and Main-price, 1987; Stünitz et al., 2003). On the other hand, the crys-tallographic planes (010), and less commonly (001) tend to align and form a foliation in magmatic flow. The [100] axes (or less commonly [001]) are usually parallel to the magma flow direction. This relates to the shape of plagioclase grains in a magma, with the normal to (010) that tends to be short. Therefore, the coupling between optical and electron-optical microstructures with CPO data is necessary for a complete understanding of the origin of plagioclase crystallographic orientation.
The effect of plagioclase on the seismic properties is also not yet well documented when compared to olivine. Seront et al. (1993) demonstrated that maximum Vp(7.8 km s−1)is
normal to the foliation (with the direction normal to (010) being the fast direction for plagioclase), and S waves are po-larized parallel to the foliation or parallel to the lineation in foliated anorthosites.
A database that jointly document plagioclase microstruc-tures, crystallographic orientations and CPO-derived seismic properties is described and discussed herein, with the aim to provide an overview of plagioclase CPO characteristics as a function of the deformation regime (magmatic flow or crystal-plastic flow), and of the implications on seismic prop-erties of plagioclase-bearing rocks. This is the first attempt to develop such a database because in contrast with olivine CPOs in peridotites (e.g., Ben Ismaïl and Mainprice, 1998; Tommasi et al., 2000), the plagioclase preferred orientation is much more complex to measure by optical methods due to its low crystallographic symmetry (e.g. Benn and Main-price, 1989). However, the growing use of the EBSD (elec-tron backscattered diffraction) technique over the last ∼ 15 yr allowed the complete fabric characterization of virtually any type of mineral, regardless of its crystal symmetry. Problems to indexing albite have been reported (Prior and Wheeler, 1999; Jiang et al., 2000). For plagioclase with high anorthite contents (≥ An 50) as measured herein, we did not encoun-tered difficulties indexing the diffraction patterns. The struc-ture reference file usually used is that of bytownite (devel-oped in Montpellier), which gives excellent results. Here we present a large (172 samples) database of plagioclase CPOs that documents various geodynamic settings and deforma-tion condideforma-tions. The samples have been measured using the EBSD facilities at Géosciences Montpellier.
2 Sample locations and Geological Background
Table 1 lists the 172 gabbro samples compiled in this study, which represent various geodynamic settings. References to published data are also given in Table 1. A majority of sam-ples comes from present-day ocean crust (54 %), or former ocean crust in the Oman ophiolite (25 %).
2.1 Fast-spread ocean crust samples
Most of the samples presented here (54 %) are from gabbroic rocks formed in fast-spreading environments, collected in the Oman ophiolite, and in present-day ocean crust in the Hess Deep rift valley and in ODP Hole 1256D. Although the pre-cise initial geodynamic setting of the Oman ophiolite is still a matter of debate, the nearly continuous ocean crust present in this ophiolite makes it a classical analogue for present-day fast-spreading systems (e.g., Nicolas et al., 2000; MacLeod and Yaouancq, 2000). Hess Deep (2◦140N; 101◦330W; Hey et al., 1972; Francheteau et al., 1990) is the deepest part of a westward-propagating rift valley that is opening up in the eastern flank of the equatorial East Pacific Rise (EPR), in ad-vance of the westward-propagating Cocos-Nazca spreading
Table 1. Geodynamic environment, deformation type, CPO type, locality and related references of each sample in this study. B, P and A in the CPO type column are Axial-B, type P and Axial-A, respectively.
Geodynamic environment Amount Deformation CPO Locality and related references of samples of samples type type
Fast spread oceanic crust 93 (54.1 %) plastic 0.0 % B 53.3 %; Oman ophiolite (1) (2) (3) (4) (5) (6) (7) (8), ODP magmatic 100.0 % P 46.7 % Hole 1256D (8), Hess Deep (9) (10) (11)
A 0.0 %
Slow spread oceanic crust 43 (25 %) plastic 58.1 % B 35.7 %; ODP Hole 735B (12), ODP Leg 209 (8) magmatic 41.9 % P 42.9 %;
A 21.4 %
Others (various Massifs 36 (20.6 %) plastic 50.0 % B 65.6 %; Brazil (13) (14), La Réunion (15), St-Thibéry (16), and Lavas) magmatic 50.0 % P 31.3 %; Oklahama (17)
A 3.1 %
(1) Ildefonse et al. (1999). Some of the data are unpublished. (2) Nicolas et al. (2008).
(3) Nicolas et al. (2009). (4) Morales et al. (2011). (5) Lamoureux et al. (1999). (6) Fontaine et al. (2005).
(7) Unpublished data from G. Lamoureux (PhD thesis, Université Montpellier 2, 1999). (8) Unpublished data from B. Ildefonse.
(9) MacLeod et al. (1996).
(10) Unpublished data from G. Yaouancq (Ms thesis, Université Montpellier 2, 1999).
(11) Unpublished data from K. A. Howard and B. Ildefonse (James Cook 21 Cruise samples, 2008). (12) Unpublished data from B. Ildefonse, T. Satsukawa, L. Morales, and F. Barou.
(13) Egydio-Silva et al. (2002), and unpublished data from J. Bascou (PhD Thesis, Université Montpellier 2, 2002). (14) Unpublished data from C. Burgos (PhD thesis, Universidade Federal da Bahia, Brazil, 2005).
(15) Unpublished data from M. Drouin and B. Ildefonse. (16) Bascou et al. (2005)
(17) Seront et al. (1993).
center (e.g., Schouten et al., 2008; Smith et al., 2011). The samples used here were collected on the intra-rift ridge dur-ing ODP Leg 147 (Gillis et al., 1993), and with the UK ROV ISIS during the RSS James Cook JC21 Cruise in January– February 2008 (MacLeod et al., 2011; Harris et al., 2012; Lissenberg et al., 2013).
ODP Hole 1256D (6◦44.20N; 91◦56.10W) is located in an area of the Cocos plate crust that was formed 15 million years ago on the eastern flank of the EPR at a superfast spreading rate (∼ 220 mm yr−1; Wilson, 1996). It is situated on a ridge segment of at least 400 km in length, located ∼ 100 km north of the triple ridge junction between the Cocos, Pacific, and Nazca plates. All samples from Hole 1256D come from the petrologically complex sheeted dike – gabbro transition zone (Wilson et al., 2006; France et al., 2009; Koepke et al., 2008, 2011).
2.2 Slow-spread ocean crust samples
Overall, 25 % of the samples come from slow-spreading oceanic crust environments. A majority was collected in ODP Hole 735B, at the Southwest Indian ridge. The ODP Site 735 is located on the Atlantis Bank, a 11 m.y. old shal-low oceanic core complex located 18 km east of the Atlantis II Transform Fault (Dick et al., 2000). Hole 735B was drilled to the depth of 1503 m below seafloor, over two ODP Legs (118 and 176; Robinson et al., 1989; Dick et al., 1999, 2000). Recovered samples are predominantly medium to
coarse-grained crystalline gabbroic rocks from a tectonically ex-posed lower crustal section. Additional samples come from ODP Holes 1270B, 1275B and 1275D, drilled during ODP Leg 209 at the Mid-Atlantic Ridge in the 15◦200N fracture zone area (Kelemen et al., 2004).
2.3 Other samples
The remaining samples compiled herein (21 %) come from various locations and represent a variety of gabbroic rocks (sensu lato) from different geodynamic settings. They in-clude gabbros and charnockites from igneous intrusions in the Itabuna belt, in the São Francisco craton, Bahia, Brazil, granulites from the Neoproterozoic Ribeira belt, southeastern Brazil (Egydio-Silva et al., 2002), layered gabbros from La Réunion (Piton des Neiges volcano, Cirque de Salazie), one foliated anorthosite sample from the Precambrian Grenvil-lian basement in Oklahoma, USA (Seront et al., 1993), and basaltic lava flow samples from Saint Thibéry, southern France (Bascou et al., 2005).
3 Method
3.1 Crystallographic preferred orientation measurements
To evaluate the plagioclase fabric characteristics, crystallo-graphic orientation measurements were obtained by tron backscatter diffraction (EBSD) in a scanning elec-tron microscope (SEM). For that, we have used the JEOL JSM 5600 and the CamScan X500FE Crystal Probe SEMs, both equipped with Oxford/Nordlys EBSD detectors and the Channel 5®suite of programs, installed at Géosciences Montpellier (CNRS and Université Montpellier 2). Details about the EBSD technique are given in Engler and Randle (2009) and Prior et al. (2009).
For most measured samples, we have made extensive use of the automated crystallographic orientation mapping of whole thin sections (usually 35 mm long and 20 mm wide). The resolution of individual maps was variable, depending on the mean grain size or individual samples; on average the used step sizes ranged from 30 to 35 µm. The indexing rates in the raw maps range from 50 % to 80 %. Post-acquisition data processing included the extrapolation of well-indexed neighboring points to non-indexed points, and removal of grains (as defined by continuous domains characterized by an internal misorientation < 10◦) smaller than 5 pixels in
av-erage diameter. Pole figures were calculated using processed map data (herein called gridded data), and, in order to avoid the overrepresentation of coarse grains in individual sample, using one point per grain (herein called 1 point-per-grain data, or 1 ppg data). The oldest crystallographic orientation data sets measured more than 10 yr ago, when the automatic mapping was not yet fully functional in our system, were ob-tained manually, in an interactive mode (i.e., the user can select the appropriate indexation pattern for each measured point) with a one-point-per-grain data strategy. Hence 1 ppg data allows us a homogenous presentation of the older and more recent data. The 1 ppg data are used below to plot the CPO pole figures and calculate their strength and symmetry; gridded data are used to calculate seismic properties when available.
3.2 CPO strength
We determined the fabric strength and distribution density of the principal crystallographic axes by calculating the J index of the orientation distribution function (ODF), simply called “J index” here, and J index of pole figures called “pfJ in-dex” (e.g. Bunge 1982, Mainprice and Silver, 1993). The ro-tation matrix between crystal and sample co-ordinates is used to describe the orientation g of a crystal in sample coordi-nates. In practice, it is convenient to describe the rotation by a triplet of Euler angles (ϕ1, 8, ϕ2; Bunge, 1982). The ODF
f (g)is defined as the volume fraction of orientations with an orientation in the interval between g and g + dg in a space
containing all possible orientations given by 1V
V = Z
f (g)dg. (1)
In this equation, 1V /V is the volume fraction of crystals with orientation g, dg = 1/8π2sin 8dϕ1d8dϕ2 is the
frac-tional volume of integration in orientation space. To quantify the strength of CPOs, Mainprice and Silver (1993) used the Jindex of the ODF, defined by Bunge (1982) as
J = Z
f (g)2dg. (2)
The J index ranges from 1 for a random distribution to infin-ity for a single crystal. In a similar manner, the strength of a pole figure can be analytically defined by the pfJ index as pfJ =
Z
Phkl2 (α, β) dω, (3)
where α and β are the spherical co-ordinates of the consid-ered direction in the pole figure, Phkl2 (α, β) is the density squared in that direction for a given crystallographic pole de-fined by hkl and dω = 1/2π sin αdαdβ is the fractional vol-ume of integration. The index has a value of 1 for a ran-dom distribution and infinity for a single crystal. The recent MTEX MatLab toolbox (Hielscher and Schaeben, 2008) now allows one to calculate J for aggregates of triclinic minerals using the de la Vallée Poussin kernel that is exactly defined in Fourier coefficients (Schaeben, 1999); we used half-width of 10◦, which corresponds exactly to a series expansion of
28.
The analysis of the pole figure symmetry was carried out through the evaluation of the parameters P (point), G (girdle) and R (random) fabric indexes. These indexes are calculated from the eigenvalues (λ1≥λ2≥λ3, with λ1+λ2+λ3=1)
of the normalized orientation matrices for the principal crys-tallographic axes and can be described as P = λ1−λ3 (P
has a high value when λ1>λ2≈λ3), G = 2(λ2−λ3)(G has
a high value when λ1≈λ2> λ3) and R = 3λ3 (R has a
high value when λ1≈λ2≈λ3)(Woodcock, 1977; Vollmer,
1990). These indices range from 0 to 1, and P +G+R = 1. P and G are the values for a given crystallographic pole figure, which represents a set of vectors of pole to planes ⊥ (hkl) or directions [uvw] used for eigenvalue calculations. The nota-tion ⊥ (hkl) is simplified to (hkl) below. P and G are used in the eigenvalue analysis (Sects. 5 and 7) when introducing the BA-index.
3.3 Calculation of elastic symmetry
We have calculated the elastic symmetry of hypothetical 100 % plagioclase aggregates to further characterize the sym-metry aspect associated with CPOs. The analysis of elas-tic symmetry of minerals and mineral aggregates has been previously applied to mantle samples by Harder (1988) and
Mainprice and Silver (1993). More recently Browaeys and Chevrot (2004) have re-formulated the problem in terms of an Euclidean norm for an elastic tensor of arbitrary sym-metry. The elastic constants are transformed into an eigen-tensor representation and stored as a vector X, the Euclidean norm is simply given as√(X · X). The Euclidean norm gives the measure of the distances between the different elastic symmetry solutions and their relative proportions in the ini-tial arbitrary elastic tensor being analyzed. We have applied the method using the holohedral symmetry classes trigonal, monoclinic, orthorhombic, tetragonal, and hexagonal plus isotropic, which always represents the major fraction. To use this method the Voigt average elastic constants were calcu-lated, as Euclidean norm is only valid for this average.
3.4 Calculation of seismic properties
Seismic properties of the polycrystalline aggregates were computed by averaging individual grain elastic-constant ten-sors as a function of the CPO and modal composition of a sample (e.g. Mainprice, 1990) through the Voigt–Reuss– Hill averaging scheme. Whenever available, the gridded data were used to calculate the seismic properties of the samples, and the modal compositions were derived from these maps as seismic properties dependent on the fractional volume or in present case the fractional area. This method enables the calculation of the three-dimensional distribution of seismic velocities in an anisotropic polycrystalline aggregate (Main-price and Humbert, 1994). We have used the following elas-tic constants experimentally determined at ambient condi-tions (plagioclase: Aleksandrov et al., 1974; clinopyroxene: Collins and Brown, 1998; orthopyroxene: Chai et al., 1997; olivine: Abramson et al., 1997; amphibole: Aleksandrov and Ryzhova, 1961). Anisotropy of seismic velocities (AVp and
AVs) is defined (in percent) as 200 (Vmax−Vmin)/(Vmax+
Vmin).
4 Microstructures
Rock types, modal compositions and microstructural observations are listed in Table 2 for all samples presented here. Some of the modal compositions are shown as 100 % of plagioclase when measure-ments were done manually. Mineral composition is plagioclase + clinopyroxene ± olivine ± amphibole (± orthopyroxene). Typical plagioclase microstructures in this study are shown in Fig. 1. The samples can be classified into two types, those that have a predominant magmatic microstructure (Fig. 1a to d) and those that have crystal-plastic microstructures (Fig. 1e and f). The magmatic flow textures display straight or curvilinear grain boundaries (Fig. 1a and b). Plagioclase grains are commonly oriented and their shape defines a foliation (Fig. 1a). In some samples grain boundaries have more irregular shapes, and grain
Fig. 1. Photomicrographs (cross-polarized light) of plagioclase mi-crostructures in gabbros from the Oman ophiolite (a), Hess Deep (b), and ODP Hole 735B (c–f). (a, b) Magmatic flow microstruc-ture. (c, d) Magmatic flow microstructure with weak to crystal-plastic overprint. Porphyroclastic deformation microstructure (e, f) and mylonitic texture are produced by crystal-plastic flow. Porphy-roclasts consist of plagioclase and clinopyroxene, whereas neoblast are only plagioclase.
size becomes bi-modal with a few recrystallized grains (Fig. 1c and d). These microstructures are characteristics of incipient high temperature plastic deformation, which overprint magmatic flow textures. Samples deformed by significant crystal-plastic flow (Fig. 1e and f) are character-ized by the joint occurrence of porphyroclasts and neoblasts. Porphyroclasts consist of plagioclase and clinopyroxene, whereas neoblasts are commonly only plagioclase. Some ultramylonitic samples from Hole 735B also show recrystal-lized olivine and clinopyroxene. Small-grained size textures (Fig. 1e and f) are from localized shear zones, associated with enhanced strain rate and/or decreasing lithospheric temperature. For all samples in this study, deformation type was defined for each sample (Table 2). More than 60 % of samples have a magmatic flow texture.
5 Crystallographic preferred orientation of plagioclase
Measured CPOs are presented in equal-area, lower-hemisphere stereographic projections (Figs. 2 and 3, and Supplement Figs. 1 to 7). Pole figures of plagioclase crystal orientations are in the thin section reference frame; the long axis of thin section is parallel to the east–west horizontal di-rection in the pole figure. The significance of this reference
Table 2. Modal composition (%), rock type, deformation type and related references for the gabbros studied here. Mode: modal composition; Pl: plagioclase; Cpx; clinopyroxene; Ol: olivine, Opx: orthopyroxene; Amp: amphibole, respectively. * An contents of plagioclase from the crustal section in the Oman ophiolite are on average in the range 60–90 (e.g., Pallister and Hopson, 1981). ** An contents of plagioclase from the sheeted dike/gabbro transition zone in Hole 1256D, from which these samples are from, range from 44 to 76, and are 62 on average (Yamazaki et al., 2009). *** An contents of plagioclase from gabbroic rocks in ODP Hole 894G range from ∼ 43 to 90, and are ∼ 65 on average (Pedersen et al., 1996; Natland and Dick, 1996).
Sample# Mode (%) Rock type Deformation plg Data source
Pl Cpx Ol Opx Amp An % (see Table 1)
Oman ophiolite
86OA20C 100 0 0 0 0 anorthositic gabbro magmatic (7)
88OA13 59 14 27 0 0 olivine gabbro magmatic (7)
88OA14b 77 23 0 0 0 gabbro magmatic (7)
90OA68 59 29 11 0 0 olivine bearing gabbro magmatic (7)
90OA77 47 37 16 0 0 gabbro magmatic (7)
90OF11 70 25 5 0 0 olivine bearing gabbro magmatic (5)
92OB100b 71 29 0 0 0 gabbro magmatic (7)
92OB101 59 41 0 0 0 gabbro magmatic (7)
92OB134 67 33 0 0 0 oxide gabbro magmatic (7)
92OB139 46 43 11 0 0 olivine bearing gabbro magmatic (7)
92OB140a 59 22 19 0 0 gabbro magmatic (7)
92OB140c 54 46 0 0 0 olivine bearing gabbro magmatic (7)
92OB142 80 20 0 0 0 gabbro magmatic (7)
92OB143 55 37 7 0 0 olivine gabbro magmatic (7)
93OB157 94 6 0 0 0 gabbro magmatic (7)
94OB28 87 12 1 0 0 gabbro magmatic (7)
95OA129 100 1 0 0 0 gabbro magmatic (5)
95OB4 63 10 27 1 0 gabbro magmatic + weak HT plastic (8) 97OB1C 46 14 0 41 0 gabbronorite magmatic (recrystallized) 92 (6)
98OB10a 46 50 4 0 0 cpx-ol gabbro magmatic (1)
98OB10e 30 64 6 0 0 cpx-ol gabbro magmatic (1)
98OB10g 40 38 23 0 0 cpx-ol gabbro magmatic (1)
98OB7a 86 14 0 0 0 gabbro magmatic (1)
98OB8b 55 38 7 0 0 gabbro magmatic (1)
06OA31b 64 36 0 0 0 diabase magmatic (2)
07_2_OA_10B 96 3 1 0 0 anorthosite magmatic 81/96 (4)
07_2_OA_18b 98 2 0 0 0 anorthosite magmatic 82 (4)
07_2_OA_18c 98 2 0 0 0 anorthosite magmatic 82–84 (4)
07_2_OA_30b 98 0 2 0 0 anorthosite magmatic 70/57 (4)
07_2_OA_30h 93 6 0 0 0 anorthosite magmatic 81/86 (4)
07_2_OA_37 89 11 0 0 0 anorthosite magmatic (4)
07_2_OA_37b 100 0 0 0 0 anorthosite magmatic 83–85 (4)
07_2_OA_41g 78 16 3 3 0 anorthosite magmatic (4)
07_2_OA_42c 89 9 1 0 0 anorthosite magmatic (4)
07_2_OA_45c3 97 2 1 0 0 anorthosite magmatic 80/59 (4) 07_2_OA_45c4 83 17 0 0 0 anorthosite magmatic 79/71 (4)
07_2_OA_66 95 5 0 0 0 anorthosite magmatic (4)
07_OA_8g_2S 88 12 0 0 0 anorthosite magmatic (4)
07-2OA13 34 58 5 4 0 gabbro magmatic (3)
07OA20a 34 58 5 4 0 gabbro magmatic (3)
07OA20c1 77 28 0 0 0 gabbro magmatic (3)
07OA20d 77 23 0 0 0 gabbro magmatic (3)
07OA20e 80 20 0 0 0 gabbro magmatic (3)
Cocos Plate (East-Pacific Rise), ODP Hole 1256D
312-1256D-202R1-8 81 12 0 1 6 diabase magmatic 56 (8)
312-1256D-213R1-52 41 20 7 0 32 gabbro magmatic 53 (8) 312-1256D-223R3-5 58 33 0 4 5 gabbro magmatic 60–66 (8) 312-1256D-230R1-15 33 54 0 7 6 diabase magmatic 54 (8) 312-1256D-230R1-73 61 28 0 4 7 diabase & gabbro magmatic 55 (8) 312-1256D-230R1-118-a 68 22 0 6 4 diabase & gabbro magmatic 55 (8) 312-1256D-230R1-118-b 62 25 0 10 3 diabase & gabbro magmatic 55 (8)
Table 2. Continued.
Sample# Mode (%) Rock type Deformation plg Data source
Pl Cpx Ol Opx Amp An % (see Table 1)
312-1256D-232R1-71 65 20 0 10 6 diabase & gabbro magmatic 61 (8) 312-1256D-232R1-82-a 60 24 0 10 6 diabase & gabbro magmatic 58/75 (8) 312-1256D-232R1-82-b 63 14 0 16 6 diabase & gabbro magmatic 58/75 (8) 312-1256D-232R2-37-a 62 26 0 12 0 diabase & gabbro magmatic 61 (8) 312-1256D-232R2-37-b 66 25 0 3 5 diabase & gabbro magmatic 61 (8)
Hess Deep (East-Pacific Rise)
147-894G-12R2 59 30 0 5 6 gabbro magmatic (10)
147-894G-12R3-142 59 37 0 0 4 gabbro magmatic (9)
147-894G-13R1 65 29 0 2 4 gabbro magmatic (10)
147-894G-11R2 66 27 0 0 7 gabbro magmatic (10)
HD69r6_a 84 2 13 0 0 troctolite magmatic 87 (11)
HD69r10_a 57 39 0 2 2 olivine-bearing gabbro magmatic 63–66 (11) HD69r16_a 69 28 0 1 1 olivine oxide gabbro magmatic 44–48 (11)
HD70r2_a 53 19 28 0 0 troctolite magmatic 74–75 (11)
HD70r14_a 52 19 28 0 1 olivine gabbro magmatic 75–76 (11) HD70r15_a 58 30 0 1 11 olivine gabbro magmatic 73–77 (11)
HD70r17_a 87 10 0 0 3 gabbro magmatic 70–76 (11)
HD70r18_a 54 46 0 0 0 oxide gabbronorite magmatic 47–48 (11) HD70r20_a 62 30 0 0 8 oxide gabbro magmatic 43–50 (11) HD73r2_a 79 7 12 0 1 olivine gabbro magmatic 79–83 (11)
HD73r4_a 62 34 3 1 0 olivine gabbro magmatic (11)
HD73r5_a 69 26 1 1 3 olivine gabbro magmatic 73 (11)
HD73r9_a 68 29 1 2 0 olivine gabbro magmatic 58–59 (11) HD73r13_a 59 38 0 2 0 olivine-bearing gabbro magmatic 66–73 (11) HD73r15_a 45 41 0 1 13 olivine gabbro magmatic 76–78 (11)
HD73r16_a 87 1 11 0 1 troctolite magmatic 72–77 (11)
HD73r18_a 58 25 12 2 3 olivine gabbro magmatic 74–77 (11) HD73r20_a 79 13 1 0 7 olivine gabbro magmatic 74–75 (11) HD75r5_a 68 21 7 1 3 olivine gabbro magmatic 72–73 (11) HD75r8_a 50 49 0 0 0 olivine gabbro magmatic 78–79 (11) HD75r11_a 58 40 0 1 1 olivine gabbro magmatic 68–73 (11) HD76r1_a 66 34 0 0 0 olivine gabbro magmatic 60–63 (11)
HD76r3_a 75 24 0 0 0 olivine gabbro magmatic 61 (11)
HD76r8_a 58 41 0 1 0 olivine gabbro magmatic (11)
HD76r10_a 68 31 0 0 1 olivine gabbronorite magmatic (11) HD76r11_a 76 21 0 0 3 olivine-bearing gabbro magmatic 63–68 (11) HD76r14_a 58 22 0 0 20 olivine gabbronorite magmatic 59–60 (11)
HD78r1_a 60 38 0 0 2 gabbronorite magmatic (11)
HD78r2_a 98 2 0 0 0 oxide gabbro magmatic 44–45 (11)
HD78r5a 62 33 0 3 1 oxide gabbronorite magmatic 36–50 (11) HD78r5b 71 26 0 1 2 oxide gabbronorite magmatic 57–59 (11) HD78r5x4 64 32 0 2 3 oxide gabbronorite magmatic 38–49 (11) HD78r6_a 62 26 9 3 0 gabbronorite magmatic 63–61 (11)
HD78r7_a 66 19 0 6 9 gabbronorite magmatic (11)
Southwest Indian Ridge, ODP Hole 735B (ODP Leg 176)
176-735B-93R2-105 59 33 8 0 0 olivine gabbro magmatic + weak plastic 52–54 (12) 176-735B-93R4-45 62 31 7 0 0 gabbro magmatic + weak plastic 52–54 (12) 176-735B-95R2-34 57 38 4 1 1 oxide olivine gabro plastic 42–43 (12) 176-735B-114R5-108 71 22 2 0 6 oxide gabbronorite plastic 34–35 (12) 176-735B-116R4-127 68 16 11 2 3 opx-bearing gabbro magmatic + weak plastic ∼45–50 (12) 176-735B-116R5-2 54 42 3 0 0 gabbro magmatic + plastic (12) 176-735B-117R3-15 60 15 16 1 9 olivine gabbronorite plastic 45–49 (12) 176-735B-120R1-16 71 22 2 0 6 olivine gabbro magmatic (12) 176-735B-121R2-73 52 18 29 1 0 olivine microgabbro magmatic ∼50 (12) 176-735B-130R3-115 67 18 13 1 0 olivine gabbro magmatic 50–57 (12) 176-735B-132R5-94 46 45 4 4 1 oxide gabbro olivine gabbro plastic 36–51 (12)
Table 2. Continued.
Sample# Mode (%) Rock type Deformation plg Data source
Pl Cpx Ol Opx Amp An % (see Table 1)
176-735B-133R1-35 74 18 3 1 4 oxide gabbro plastic 37–40 (12) 176-735B-133R3-0 63 28 7 1 1 olivine gabbro plastic ∼55 (12) 176-735B-137R6-103 73 13 10 3 1 leucocratic troctolitic microgabbro plastic 39–56 (12) 176-735B-142R5-6 59 22 19 0 0 olivine gabbro magmatic + weak plastic ∼50–55 (12) 176-735B-147R6-39 71 18 7 1 3 gabbro plastic ∼50–60 (12)
176-735B-149R2-104 65 29 4 2 0 gabbro plastic (12)
176-735B-149R3-63 55 39 4 2 0 gabbro plastic 50–55 (12) 176-735B-149R3-75 60 37 3 0 0 troctolite plastic 50–60 (12) 176-735B-150R5-96 55 35 9 0 0 gabbro magmatic + plastic 49–53 (12) 176-735B-150R5-98 69 24 7 0 0 gabbro magmatic + plastic 49–53 (12) 176-735B-150R5-100 51 43 5 1 0 gabbro plastic 49–53 (12) 176-735B-150R5-102 51 42 7 0 0 gabbro plastic 49–53 (12) 176-735B-153R4-92 61 26 5 8 1 olivine gabbro magmatic (+ very ∼47 (12)
weak plastic)
176-735B-154R3-118 54 36 9 0 0 olivine gabbro magmatic 46–47 (12) 176-735B-154R5-42 55 42 3 1 0 olivine gabbro magmatic + weak plastic ∼45 (12) 176-735B-156R5-107 77 20 3 0 0 olivine gabbro magmatic + plastic ∼55 (12) 176-735B-165R3-111 58 32 7 2 0 olivine microgabbro magmatic 54–56 (12) 176-735B-165R3-115 54 36 9 1 0 olivine gabbro magmatic 51–57 (12) 176-735B-167R6-103 68 22 8 2 0 gabbro magmatic ∼50–55 (12) 176-735B-170R1-99 62 14 23 1 0 disseminated oxide olivine gabbro plastic 52–55 (12) 176-735B-179R5-97 75 15 10 0 1 olivine gabbro magmatic ∼55–60 (12) 176-735B-189R3-110 58 34 5 3 0 microgabbro and olivine gabbro magmatic 54–59 (12) 176-735B-189R7-94 61 32 4 3 0 gabbro plastic 54–59 (12) 176-735B-189R7-98 67 29 3 1 0 olivine gabbro plastic 54–59 (12) 176-735B-190R4-87 64 27 6 2 0 troctolitic gabbro magmatic + weak plastic ∼50–60 (12) 176-735B-191R1-36 73 19 6 1 0 leucocratic disseminated oxide plastic ∼50 (12)
microtroctolite
176-735B-191R1-39 70 22 6 2 0 olivine gabbro plastic ∼50 (12) 176-735B-206R6-138 48 40 12 0 0 olivine microgabbro magmatic 57–61 (12) 176-735B-209R7-100 67 23 10 0 0 olivine gabbro magmatic ∼55–60 (12)
Mid-Atlantic ridge, ODP Leg 209
209-1270B-3M1-43 98 2 0 0 0 oxide gabbronorite plastic (8) 209-1275B-16R2-52 64 28 5 4 0 oxide gabbro magmatic (8) 209-1275D-43R1-106 55 45 0 0 0 oxide gabbro magmatic (8)
Reunion, Cirque de Salazie
SaG1 56 44 0 0 0 gabbro magmatic (15)
SaG2 55 45 0 0 0 gabbro magmatic (15)
SaG3 42 58 0 0 0 gabbro magmatic (15)
SaG4 18 76 6 0 0 olivine gabbro magmatic (15)
SaG5 84 14 2 0 0 olivine gabbro magmatic (15)
and anorthosite
SaG6 18 73 8 0 0 olivine gabbro magmatic (15)
SaG6b 23 69 8 0 0 olivine gabbro magmatic (15)
SaG7 50 50 0 0 0 gabbro magmatic (15)
SaG8 47 43 10 0 0 olivine gabbro magmatic (15)
SaG9 43 51 6 0 0 olivine gabbro magmatic (15)
SaG10 15 56 29 0 0 olivine gabbro magmatic (15)
SaG11 29 46 26 0 0 olivine gabbro magmatic (15)
Brazil, Itabuna and Ribeira belts
CM08 67 14 0 15 3 charnokite HT plastic (14) CM09 69 15 0 16 0 charnokite HT plastic 53–62 (14) CM19 86 6 0 7 0 charnokite HT plastic 60–64 (14) CM20 70 16 0 14 0 charnokite HT plastic (14) CM22 63 20 0 18 0 charnokite HT plastic (14) CM29 60 34 0 1 5 charnokite HT plastic 63–70 (14) RMB20 99 0 1 0 0 gabbro magmatic (14)
Table 2. Continued.
Sample# Mode (%) Rock type Deformation plg Data source
Pl Cpx Ol Opx Amp An % (see Table 1)
RB538 granulite HT plastic, recrystallized 22–23 (13) RB540 granulite HT plastic, recrystallized 23–24 (13) RB546 granulite HT plastic, recrystallized 33–35 (13) RB548 granulite HT plastic, recrystallized 24–25 (13) RB559 granulite HT plastic, recrystallized 39–47 (13) RB566 granulite HT plastic, recrystallized 84–90 (13) RB5E granulite HT plastic, recrystallized 37 (13) RB607A granulite HT plastic, recrystallized 36–39 (13) RB607B granulite HT plastic, recrystallized 54–58 (13) RB609A granulite HT plastic, recrystallized 19–20 (13) RB614 granulite HT plastic, recrystallized 27–32 (13) RB689 granulite HT plastic, recrystallized 43–50 (13)
St Thibéry lava flows
005 magmatic 52 (16)
016 98 1 1 0 0 magmatic 52 (16)
029 100 0 0 0 0 magmatic 52 (16)
074 60 40 0 0 0 magmatic 52 (16)
Oklahoma
89ANOK 100 0 0 0 0 Anorthosite magmatic 65 (17)
frame differs with the sample provenance. The samples from Oman ophiolite, Brazil and Oklahoma, and the dive samples from Hess Deep were cut in (or close to) the structural XZ plane (parallel to the lineation and normal to the foliation). Samples from ocean drill cores were cut in the core refer-ence frame, with the core vertical direction either parallel or perpendicular to the long axis of thin section. To obtain a rep-resentative CPO of the rock, the number of measured crystals must be at least 100 grains (e.g. Ben Ismaïl and Mainprice, 1998); the automated mapping of CPOs allows one to mea-sure many more than this in general (see Table 3).
5.1 Fast-spread ocean crust samples
About 43 plagioclase CPOs from gabbros and anorthosites from the Oman ophiolite (Fig. 2b and c, Supplement Fig. 1, and Morales et al., 2011) show relatively high concentrations of (010) poles in a point maximum with a perpendicular gir-dle concentration of [100] axes. Some samples show CPO patterns with concentration of both (010) and (001) poles perpendicular to the foliation, and with [100] axes distributed along the foliation plane (e.g., 95OB4, 98OB10g, 90OA77). From ODP Hole 1256D in the East Pacific crust, we have 12 samples (Supplement Fig. 2). The CPOs are generally weak, (010) poles show relatively high concentrations (230R1-15, 230R1-73, and 312-1256D-230R1-118-a). The CPOs of 38 samples from Hess Deep (Supplement Fig. 3) have variable intensities, and most also have relatively high concentration of (010) poles (Fig. 2a).
5.2 Slow-spread ocean crust samples
ODP Hole 735B in slow-spread crust provides the second largest single data set of 40 samples in the database. They display various types of CPO (Supplement Fig. 4). Slip sys-tems cannot be uniquely inferred from the CPO in plas-tically deformed samples. The majority of samples shows CPO patterns with girdle concentrations of both (010) and (001) poles and with [100] axes distributed normal to them (Fig. 2f to h). Another type of pattern shows no girdle con-centration, [100] and (010) are both concentrated as point maxima (e.g., 176-735B-130R3-115, 176-735B-189R7-98). A few samples have the pattern commonly described in fast-spread ocean crust, with strong (010) concentration (e.g., 176-735B-165R3-111). The three samples from the Mid-Atlantic Ridge have relatively weak CPOs with no girdle concentration (Supplement Fig. 5).
5.3 Other samples
The remainder of the samples compiled herein comes from various locations (Supplement Figs. 5 to 7). Samples of gab-bros and charnockites from igneous intrusions in the Itabuna belt (Sao Francisco craton, Bahia, Brazil) and granulites from the Neoproterozoic Ribeira belt (southeastern Brazil) show generally weak plagioclase CPOs and do not show a strong concentration of any particular axis in relation to the speci-men reference frame. The CPOs of layered gabbros from La Réunion (Piton des Neiges volcano, Cirque de Salazie; Sup-plement Fig. 5) show the same common type of CPO as in
Fig. 2. CPOs of plagioclase, and corresponding photomicrographs. (a–d) B-type CPOs of plagioclase of magmatic deformed samples. (a) HD70r14a from Hess Deep, (b) 98OB8B from Oman ophiolite, (c) 86OA20A from Oman ophiolite, (d) 89anok3 from Oklahoma. (e–f) Plastically deformed samples from ODP Hole 735B. (e) Type-P CPO and mylonitic texture deformed at low temperature, (f) Axial-A CPO and mylonitic texture deformed at low temperature, (g) Type-P CPO and porphyroclastic texture deformed at low temperature, (h) Axial-A CPO and medium grained deformed at high temperature. N is the number of measurements, pfJ is an index of pole figure intensity, and MD is the maximum pole figure density in times uniform distribution. Dotted lines and stars represent the trace of the foliation, and the vertical in the drill core, respectively.
fast-spread ocean crust; (010) poles are strongly concentrated with girdle concentration of [100] and/or (001). Samples of basaltic lava flow samples from Saint Thibéry (Southern France; Supplement Fig. 7) show plagioclase CPOs with rel-atively strong (010) maxima. The foliated anorthosite sam-ple from the Precambrian Grenvillian basement in Oklahoma (USA; Seront et al., 1993; Fig. 2d; Supplement Fig. 7) shows a very strong concentration of (010) with clear girdle con-centration of [100] and (001).
5.4 Classification of the plagioclase CPOs
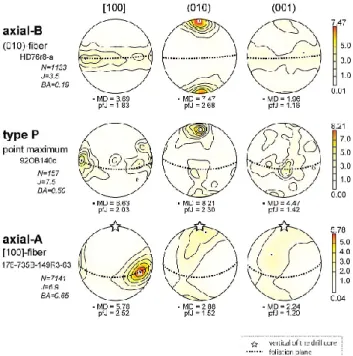
There is a large variability in the plagioclase CPOs in the database and we need to introduce some descriptive methods. We can classify them into three main groups (Fig. 3). The Axial-B fabric is defined by a strong point maximum con-centration of (010) and perpendicular girdle distributions of [100] and (001), and it can be also called (010)-fiber pattern or texture. The type-P CPO shows point maxima of the three pole figures [100], (010) and (001), however the concentra-tion of (001) poles is often weaker than the others. Lastly the Axial-A fabric has a strong point maximum
concentra-tion of [100] with perpendicular girdle distribuconcentra-tions of (010) and (001), this is a [100]-fiber pattern or texture. Nearly all of the plagioclase fabrics compiled in this study fall into one of these three groups, as reported in the last column of Table 3. However, some samples are noted in Table 3 as having weak or not identifiable CPOs.
5.5 Plagioclase CPO and microstructure
Figure 2 shows typical examples of magmatic flow and crystal-plastic flow textures, with corresponding CPOs. Sam-ples with typical magmatic textures systematically show Axial-B fabric when CPO is developed, with a strong con-centration of (010) planes parallel to the magmatic foliation of those samples (Fig. 2a to d). The systematic relationship between plagioclase (010) concentration and magmatic foli-ation is related to the tabular shape of plagioclase grains, and commonly described in other studies (e.g., Lamoureux et al., 1999; Morales et al., 2011).
Fig. 3. Typical plagioclase Crystallographic preferred orientation (CPO) patterns. Lower hemisphere, equal-area stereographic pro-jections, contours at one multiple of uniform distribution. The fo-liation plane, as defined by the preferred alignment of (010) is in-dicated by dashed great circles. N is the number of measurements, pfJ is an index of fabric intensity, and MD is the maximum density. Stars represent the vertical in the drill core, respectively. All plagio-clase CPOs are classified within these three main types. Axial-B is defined by a strong point concentration of (010) perpendicular to the foliation and a girdle distribution of [100] parallel to the foliation; it can be also called (010)-fiber. Type P CPO shows point maxima of the three axes, with the (010) maximum perpendicular to the fo-liation. Type Axial-A has a strong point maximum concentration of [100] parallel to the lineation, and parallel girdle distributions of (010) and (001), perpendicular to the foliation.
Sample 176-735B-133R1-35 shows type-P CPO, with [100] being sub-parallel to the foliation, and (010) normal to foliation (Fig. 2e), which is consistent with the classically described (010)[100] slip system (e.g., Montardi and Main-price, 1987; Rosenberg and Stünitz, 2003). The other plasti-cally deformed samples show Axial-A CPOs that have high concentrations of [100], consistent with the lineation direc-tion, indicating that the activated plagioclase slip system is [100](010) and/or [100](001) (Fig. 2e to f), as described also by Mehl and Hirth (2008) in similar samples from ODP Hole 735B.
5.6 Fabric strength
The literature on olivine CPOs is abundant and their rela-tionships with deformation processes and intensity are well documented (e.g., Ben Ismail and Mainprice, 1998; Dijkstra et al., 2002; Tommasi et al., 2004; Linckens et al., 2011). In
contrast, because of the inherent difficulty to measure low-symmetry crystal orientations in pre-EBSD times, the litera-ture on plagioclase CPOs is much less abundant and relation-ships with deformation processes remain poorly documented (see references in the introduction). The calculated J index of all plagioclase fabrics reported in this study is shown in Figs. 4 and 5, and Table 3. We have removed from further analysis the three files with less than 100 measurements, as J is then abnormally high. The ODF J index ranges from 1.1 to 14.3, with a mean value of 4.1 and a standard devia-tion of 2.43. The fabric strength of samples with magmatic flow textures is slightly more variable than that of plastically deformed samples (Fig. 5a), both types of textures have dom-inantly weak J indices (Fig. 5a and d).
5.7 Eigenvalue analysis of (010) and [100] pole figure symmetry
To characterize (010) and [100] pole figure symmetry, as it is important to identify the differences between Axial-B type and Axial-A type, we use the BA-index defined by the eigen-value analysis, which does not depend on contouring meth-ods and is independent on the sample reference frame. This method is based on well-established technique of eigenvalue analysis of pole figures, and is presented in detail by Ulrich and Mainprice (2005), who used a similar index to quantify CPO variations in omphacite.
In the present study, there is a clear variation of the (010) and [100] pole figures from point maxima to girdle distri-butions, with associated changes in the (001) pole figures. We introduce the BA-index (similar to the LS index used Ul-rich and Mainprice (2005) to described variations between the symmetry of (010) and [001] pole figures in omphacite) to characterize the symmetry variation of the (010) and [100] pole figures, which is defined as 1/2[2 − {P(010)/(G(010)+
P(010))} − {P[100]/(G[100]+P[100])}]. P and G are defined in
Sect. 3.2 above.
A perfect Axial-B fabric has a (010) point maximum and [100] girdle, which results in a BA-index of 0. A perfect P-type fabric has point maxima of (010) and [100], which results in a BA-index of 0.5. A perfect Axial-A fabric has a [100] point maximum and (010) girdle, which results in a BA-index of 1. The BA-index of the studied samples is shown in Fig. 6 and Table 3, and ranges from 0.09 to 0.85. Samples with magmatic textures show a dominant Axial-B signature (Fig. 6a), consistent with our observation that mag-matic sample CPOs are dominated by a strong maximum of (010). BA-indices related to CPOs of plastically deformed samples are more randomly distributed (Fig. 6b).
The variation of the ODF and pole figure J indices as a function of fabric symmetry shows some differences between samples with the magmatic (Fig. 6c) and plastic (Fig. 6d) deformation microstructures. Although ODF J indices have similar ranges in both microstructural types, pole figure J in-dices are nearly twice as strong for magmatic samples as
Table 3. CPO characteristics for the gabbros studied here. I: data from interactive mode; M: data from mapping mode; N : number of measurements; BA: BA index. B, P and A in the CPO type column are Axial-B, type P and Axial-A, respectively; n.i.: not identified.
Sample# EBSD N J Max density pfJ BA CPO [100] (010) (001) [100] (010) (001) type Oman ophiolite 86OA20C I 335 5.4 5.69 8.83 4.87 2.75 2.69 2.69 0.164 B 88OA13 I 117 8.1 4.74 7.27 3.43 2.16 2.75 1.46 0.203 B 88OA14b I 253 4.9 4.69 8.12 2.94 1.77 2.53 1.27 0.205 B 90OA68 I 147 7.2 5.70 4.62 3.60 2.40 2.13 1.35 0.507 P 90OA77 I 317 9.0 5.74 5.34 4.28 2.31 2.46 1.65 0.495 P 90OF11 I 189 5.6 5.03 5.09 2.88 2.07 1.95 1.22 0.312 B 92OB100b I 213 5.2 4.05 6.15 2.18 1.82 2.28 1.19 0.199 B 92OB101 I 165 5.2 3.73 4.75 3.13 1.58 1.88 1.29 0.185 B 92OB134 I 165 5.2 3.73 4.75 3.13 1.58 1.88 1.29 0.185 B 92OB139 M 117 9.2 5.12 4.93 5.23 1.86 1.90 1.55 0.384 P weak 92OB140a I 187 9.0 6.68 9.21 5.23 2.58 1.90 1.55 0.357 B 92OB140c I 157 7.5 6.33 8.21 4.47 2.03 2.30 1.42 0.497 P 92OB142 I 253 6.7 4.99 9.70 4.00 2.50 3.12 1.53 0.310 B 92OB143 I 171 9.0 5.66 11.55 3.53 2.41 4.42 1.61 0.284 B 93OB157 I 191 6.7 5.70 7.86 3.49 2.29 2.72 1.37 0.264 B 94OB28 I 288 5.8 4.93 9.58 3.23 2.25 3.64 1.37 0.201 B 95OA129 I 426 3.2 4.24 3.36 3.07 1.48 1.39 1.19 0.534 P weak 95OB4 I 1345 2.7 2.72 2.51 1.67 1.30 1.29 1.07 0.599 P 97OB1C M 1268 2.9 3.24 5.87 1.71 1.64 2.05 1.07 0.265 B 98OB10a I 519 3.7 3.59 4.13 2.37 1.61 1.92 1.19 0.245 B 98OB10e I 377 4.1 3.47 4.61 2.37 1.50 2.08 1.22 0.223 B 98OB10g I 466 3.8 4.29 3.69 2.32 2.01 1.69 1.16 0.843 A 98OB7a I 824 5.2 4.85 8.70 2.73 2.09 3.65 1.32 0.243 B 98OB8b I 467 4.2 3.55 4.96 2.32 1.53 2.15 1.21 0.285 B 06OA31b M 102 8.5 4.14 4.77 4.26 1.56 1.95 1.52 0.346 P weak 07_2_OA_10B M 5183 4.4 2.66 5.06 12.97 1.86 2.49 1.17 0.591 P 07_2_OA_18b M 5070 8.7 2.31 4.89 11.78 2.40 4.71 1.48 0.553 P 07_2_OA_18c M 3690 3.7 2.30 6.24 13.12 1.68 2.23 1.12 0.555 P 07_2_OA_30b M 1725 3.8 2.53 5.50 16.55 1.98 1.65 1.24 0.602 P 07_2_OA_30h M 2254 4.9 3.05 5.72 14.48 1.83 2.90 1.21 0.566 P 07_2_OA_37 M 885 4.6 3.37 6.46 19.15 2.10 2.12 1.33 0.735 P 07_2_OA_37b M 1846 4.0 2.09 4.87 10.96 2.09 2.14 1.18 0.737 P 07_2_OA_41g M 1213 2.7 2.80 5.82 14.87 1.59 1.25 1.33 0.621 P 07_2_OA_42c M 3817 2.6 2.82 5.47 13.96 1.35 1.74 1.08 0.661 P 07_2_OA_45c3 M 1392 11.9 2.72 6.34 12.21 2.14 4.54 1.46 0.354 P 07_2_OA_45c4 M 2801 7.9 2.46 5.46 12.38 2.77 5.39 2.00 0.445 P 07_2_OA_66 M 1961 9.1 3.93 4.98 12.65 2.26 5.11 1.52 0.532 P 07_OA_8g_2S M 3066 2.1 2.56 5.61 14.05 1.20 1.42 1.05 0.712 P 07-2OA13 M 330 3.7 3.87 4.22 3.73 1.32 1.47 1.21 0.553 P weak 07OA20a M 418 2.5 1.92 2.20 2.15 1.10 1.08 1.08 0.412 P n.i. 07OA20c1 M 2235 1.4 1.70 1.66 1.42 1.07 1.07 1.03 0.514 P weak 07OA20d M 2873 1.5 1.77 2.52 1.50 1.15 1.22 1.02 0.291 B weak 07OA20e M 2518 1.5 1.71 2.43 1.47 1.13 1.19 1.02 0.302 B weak Cocos Plate (East-Pacific Rise), ODP Hole 1256D
312-1256D-202R1-8 M 1925 1.7 1.64 1.91 1.73 1.05 1.07 1.05 0.534 A weak 312-1256D-213R1-52 M 512 4.4 3.78 5.17 3.74 1.27 1.33 1.22 0.502 P weak 312-1256D-223R3-5 M 4289 1.2 1.65 1.31 1.30 1.04 1.02 1.01 0.565 P n.i. 312-1256D-230R1-15 M 633 2.7 2.36 3.03 2.80 1.18 1.32 1.17 0.300 B weak 312-1256D-230R1-73 M 2632 1.6 1.87 2.26 1.53 1.12 1.17 1.03 0.411 B weak
Table 3. Continued.
Sample# EBSD N J Max density pfJ BA CPO [100] (010) (001) [100] (010) (001) type 312-1256D-230R1-118-a M 3007 1.5 2.24 2.92 1.46 1.17 1.23 1.04 0.385 B weak 312-1256D-230R1-118-b M 846 2.2 2.54 2.60 2.10 1.22 1.18 1.06 0.527 A weak 312-1256D-232R1-71 M 2205 1.3 1.57 1.53 1.37 1.04 1.04 1.02 0.489 P weak 312-1256D-232R1-82-a M 6965 1.1 1.29 1.26 1.20 1.01 1.01 1.00 0.686 P n.i. 312-1256D-232R1-82-b M 2463 1.4 1.38 1.64 1.63 1.03 1.03 1.04 0.371 P n.i. 312-1256D-232R2-37-a M 5952 1.2 1.51 1.36 1.33 1.03 1.04 1.01 0.791 P n.i. 312-1256D-232R2-37-b M 1473 1.4 1.54 1.52 1.52 1.03 1.03 1.03 0.479 P weak Hess Deep (East-Pacific Rise)
147-894G-12R2 M 896 2.5 2.93 3.39 1.86 1.36 1.39 1.09 0.538 P 147-894G-12R3-142 M 442 3.5 3.10 5.49 2.53 1.51 2.18 1.18 0.275 B 147-894G-13R1 M 800 2.1 2.66 2.86 1.88 1.18 1.19 1.06 0.276 B n.i. 147-894G-11R2 M 389 3.2 2.95 3.47 2.83 1.27 1.39 1.15 0.480 P weak HD69r6_a M 412 2.8 2.36 2.34 2.19 1.12 1.15 1.09 0.609 P n.i. HD69r10_a M 572 2.7 2.86 3.40 2.62 1.22 1.26 1.10 0.159 P weak HD69r16_a M 1503 1.7 2.11 2.43 1.54 1.16 1.21 1.04 0.599 P weak HD70r2_a M 674 2.3 2.31 3.29 2.10 1.20 1.41 1.11 0.325 B HD70r14_a M 984 2.1 2.73 3.67 1.60 1.34 1.41 1.06 0.179 B HD70r15_a M 245 4.4 3.18 3.73 3.09 1.35 1.67 1.26 0.215 B HD70r17_a M 2437 1.9 2.35 3.80 1.57 1.34 1.54 1.04 0.225 B HD70r18_a M 209 7.6 4.13 5.49 3.69 1.63 1.83 1.42 0.477 B weak HD70r20_a M 68 14.3 0.533 HD73r2_a M 2916 2.1 2.19 4.23 1.84 1.31 1.76 1.10 0.225 B HD73r4_a M 675 2.8 3.34 4.39 2.21 1.42 1.67 1.12 0.271 B HD73r5_a M 1050 2.2 2.66 3.23 1.62 1.29 1.43 1.05 0.300 B HD73r9_a M 1400 2.4 2.89 4.44 1.83 1.38 1.73 1.05 0.257 B HD73r13_a M 824 2.2 3.04 3.15 1.67 1.41 1.35 1.05 0.401 B HD73r15_a M 265 3.8 3.82 4.46 2.16 1.43 1.64 1.17 0.173 P weak HD73r16_a M 1315 2.6 2.41 5.03 2.21 1.36 2.01 1.16 0.085 B HD73r18_a M 445 3.3 3.09 4.92 2.15 1.49 1.71 1.10 0.253 B HD73r20_a M 357 3.6 3.49 4.54 2.14 1.46 1.74 1.14 0.317 B HD75r5_a M 1454 2.2 2.61 3.54 1.83 1.31 1.51 1.07 0.248 B HD75r8_a M 943 1.9 2.25 2.42 1.84 1.15 1.25 1.06 0.306 P weak HD75r11_a M 312 3.9 3.63 5.67 2.35 1.70 2.03 1.19 0.174 B HD76r1_a M 486 3.7 3.87 5.82 2.41 1.87 2.09 1.19 0.380 B HD76r3_a M 409 6.0 4.31 8.50 3.13 2.11 3.40 1.29 0.360 B HD76r8_a M 1138 3.5 3.69 7.47 1.96 1.83 2.68 1.16 0.193 B HD76r10_a M 517 2.6 2.79 2.84 1.90 1.23 1.20 1.07 0.273 B HD76r11_a M 939 1.9 1.94 2.14 1.80 1.18 1.19 1.04 0.181 B HD76r14_a M 706 2.5 3.32 3.19 1.65 1.40 1.44 1.07 0.559 P HD78r1_a M 1091 1.8 2.50 2.40 1.81 1.25 1.23 1.05 0.304 B HD78r2_a M 145 6.4 3.15 2.88 3.53 1.31 1.34 1.34 0.742 P n.i. HD78r5a M 1650 1.7 2.22 2.61 1.57 1.33 1.27 1.03 0.244 B HD78r5b M 250 4.0 2.81 2.54 3.00 1.27 1.30 1.25 0.671 P n.i. HD78r5x4 M 317 3.2 2.27 2.58 2.63 1.12 1.19 1.21 0.582 P n.i. HD78r6_a M 235 4.9 4.20 4.66 2.71 1.79 1.74 1.19 0.442 P HD78r7_a M 1276 1.6 1.75 1.72 1.55 1.07 1.05 1.03 0.794 P n.i. Southwest Indian Ridge, ODP Hole 735B (ODP Leg 176)
176-735B-93R2-105 I 124 7.5 3.92 4.00 3.08 1.76 1.81 1.31 0.137 P 176-735B-93R4-45 M 1173 2.8 2.99 3.56 1.78 1.53 1.57 1.08 0.438 P 176-735B-95R2-34 M 9010 2.4 2.35 2.10 1.55 1.21 1.20 1.05 0.669 A weak 176-735B-114R5-108 M 2305 2.6 3.76 1.92 2.62 1.65 1.20 1.21 0.755 A 176-735B-116R4-127 I 855 4.0 3.20 3.73 2.42 1.30 1.31 1.20 0.596 B weak
Table 3. Continued.
Sample# EBSD N J Max density pfJ BA CPO [100] (010) (001) [100] (010) (001) type 176-735B-116R5-2 M 1098 3.1 3.64 2.40 2.51 1.50 1.29 1.14 0.550 P 176-735B-117R3-15 I 1090 3.2 3.93 2.68 2.40 1.63 1.42 1.15 0.792 P 176-735B-120R1-16 M 1531 2.3 2.41 2.04 1.56 1.15 1.19 1.04 0.479 P weak 176-735B-121R2-73 M 545 2.6 2.43 2.48 1.83 1.17 1.17 1.07 0.213 B weak 176-735B-130R3-115 I 452 3.7 3.84 3.64 1.81 1.58 1.55 1.08 0.538 P 176-735B-132R5-94 M 161 5.8 2.90 2.92 3.42 1.26 1.22 1.34 0.427 P n.i. 176-735B-133R1-35 M 2871 2.7 2.94 2.55 1.70 1.43 1.26 1.08 0.512 P 176-735B-133R3-0 M 1418 3.0 3.96 2.70 1.84 1.69 1.37 1.11 0.680 A 176-735B-137R6-103 M 810 2.7 2.65 2.76 1.88 1.24 1.23 1.07 0.423 B weak 176-735B-142R5-6 M 913 4.2 4.04 2.68 2.52 1.70 1.40 1.23 0.849 A 176-735B-147R6-39 I 929 2.9 2.72 2.21 1.96 1.25 1.22 1.11 0.356 B weak 176-735B-149R2-104 M 5440 3.3 4.95 3.04 1.90 2.11 1.47 1.16 0.653 A 176-735B-149R3-63 M 7144 4.7 5.78 2.88 2.24 2.52 1.52 1.20 0.652 A 176-735B-149R3-75 M 4448 2.0 2.20 1.76 1.93 1.15 1.06 1.11 0.567 A 176-735B-150R5-96 M 180 8.8 2.28 2.37 1.81 1.17 1.21 1.06 0.472 B weak 176-735B-150R5-98 M 255 4.7 3.03 2.63 2.56 1.40 1.43 1.21 0.214 B weak 176-735B-150R5-100 M 1823 2.4 2.34 2.13 1.83 1.15 1.13 1.08 0.440 B weak 176-735B-150R5-102 M 626 3.4 2.68 2.71 1.66 1.25 1.21 1.13 0.259 P weak 176-735B-153R4-92 M 1125 3.2 3.78 2.63 2.06 1.74 1.37 1.12 0.658 A 176-735B-154R3-118 M 336 4.7 3.59 4.05 2.18 1.61 1.56 1.13 0.577 P weak 176-735B-154R5-42 M 441 4.0 3.62 2.86 2.37 1.56 1.41 1.13 0.608 A 176-735B-156R5-107 M 693 4.0 4.31 4.09 2.09 1.77 1.72 1.10 0.336 P 176-735B-165R3-111 M 424 3.7 2.68 4.56 2.35 1.55 1.90 1.11 0.182 B 176-735B-165R3-115 M 899 2.7 2.82 2.95 1.53 1.40 1.46 1.03 0.458 B weak 176-735B-167R6-103 I 657 3.1 2.93 3.33 2.13 1.23 1.32 1.09 0.433 B weak 176-735B-170R1-99 M 1229 3.3 2.55 2.87 1.81 1.47 1.38 1.08 0.096 B 176-735B-179R5-97 I 420 9.7 6.49 5.76 6.46 1.71 1.99 1.80 0.369 P weak 176-735B-189R3-110 M 107 8.8 4.53 7.07 4.20 1.65 2.00 1.46 0.290 B weak 176-735B-189R7-94 M 4683 2.7 4.01 3.29 1.85 1.71 1.52 1.10 0.550 p 176-735B-189R7-98 M 498 4.7 3.83 4.24 2.32 1.71 1.79 1.14 0.374 P 176-735B-190R4-87 I 935 2.9 2.61 2.68 1.87 1.34 1.34 1.09 0.392 B weak 176-735B-191R1-36 M 524 3.6 2.45 2.31 2.61 1.15 1.24 1.24 0.445 P weak 176-735B-191R1-39 M 1147 4.0 5.53 4.08 2.32 2.32 1.68 1.26 0.603 B 176-735B-206R6-138 M 310 5.0 4.25 3.97 2.74 1.44 1.61 1.18 0.298 B weak 176-735B-209R7-100 I 489 4.3 3.01 3.29 2.56 1.30 1.29 1.20 0.776 P n.i. Mid-Atlantic ridge, ODP Leg 209
209-1270B-3M1-43 I 93 10.3 0.330
209-1275B-16R2-52 I 285 4.0 2.82 2.89 1.15 1.34 1.34 1.16 0.418 P weak 209-1275D-43R1-106 I 127 8.4 4.25 4.52 3.85 1.67 1.91 1.45 0.472 P weak Reunion, Cirque de Salazie
SaG1 M 24 SaG2 M 1529 2.6 2.44 3.73 1.57 1.42 1.67 1.04 0.160 B SaG3 M 656 2.4 1.88 3.03 2.16 1.11 1.28 1.13 0.461 B weak SaG4 M 715 3.3 2.75 3.69 2.19 1.47 1.86 1.12 0.184 B SaG5 M 50 12.6 0.405 SaG6 M 705 2.2 2.00 2.37 1.62 1.17 1.22 1.05 0.246 B weak SaG6b M 2323 1.5 1.76 1.85 1.45 1.09 1.12 1.02 0.361 B weak SaG7 M 279 4.1 3.41 5.18 2.20 1.65 1.80 1.14 0.128 B SaG8 M 2874 2.3 2.78 4.84 1.77 1.49 1.85 1.10 0.176 B SaG9 M 3178 2.1 2.90 3.92 1.82 1.47 1.67 1.07 0.269 B SaG10 M 1391 1.9 2.33 3.07 1.41 1.27 1.34 1.03 0.271 B weak SaG11 M 795 1.9 1.82 2.17 1.71 1.10 1.12 1.05 0.322 B weak
Table 3. Continued.
Sample# EBSD N J Max density pfJ BA CPO [100] (010) (001) [100] (010) (001) type Brazil, Itabuna and Ribeira belts
CM08 I 523 4.7 3.99 4.45 2.93 1.43 1.58 1.16 0.198 B weak CM09 I 538 2.8 2.77 2.73 2.52 1.23 1.19 1.12 0.553 P weak CM19 I 947 5.0 3.79 5.91 3.06 1.54 1.55 1.40 0.185 B weak CM20 I 490 3.2 3.75 3.73 3.24 1.31 1.20 1.21 0.238 P weak CM22 I 481 3.3 3.42 3.43 2.88 1.27 1.30 1.18 0.352 P weak CM29 I 193 4.3 3.12 2.49 2.83 1.35 1.16 1.23 0.519 P n.i. RMB20 I 148 6.1 3.25 3.10 3.03 1.44 1.47 1.43 0.341 B weak RB538 I 203 5.5 3.57 4.60 3.23 1.44 1.47 1.41 0.191 B weak RB540 I 256 4.4 2.66 2.76 2.98 1.29 1.31 1.19 0.657 P n.i. RB546 I 362 3.2 1.98 2.28 2.89 1.16 1.18 1.32 0.437 B weak RB548 I 282 3.8 1.98 2.28 2.89 1.16 1.18 1.32 0.619 P n.i. RB559 I 372 3.9 2.42 3.42 2.76 1.33 1.43 1.27 0.234 B RB566 I 289 4.0 2.38 2.37 3.22 1.22 1.16 1.43 0.616 P n.i. RB5E I 306 4.2 2.97 2.85 2.14 1.31 1.30 1.18 0.191 B weak RB607A I 505 4.3 2.41 3.46 2.60 1.34 1.48 1.21 0.383 B weak RB607B I 351 3.3 2.79 2.18 2.32 1.19 1.18 1.21 0.520 P n.i. RB609A I 146 5.5 2.46 2.88 3.89 1.33 1.36 1.54 0.167 B n.i. RB614 I 249 4.1 2.22 2.31 2.96 1.20 1.22 1.33 0.168 B weak RB689 I 362 4.4 4.10 4.09 2.64 1.69 1.65 1.26 0.638 A weak St Thibéry lava flows
005 I 19 016 I 313 4.0 3.10 3.97 3.00 1.34 1.73 1.22 029 I 164 4.6 3.41 4.15 5.29 1.38 1.68 1.80 0.702 P 074 I 231 3.9 2.91 3.63 2.90 1.41 1.56 1.22 0.621 P Oklahoma 89ANOK I 370 13.6 7.63 24.33 4.88 2.95 10.68 2.37 0.144 B
for plastic ones. The magmatic flow CPOs are more tightly grouped between Axial-B and P types with a BA-index of 0.1 to 0.6, whereas the plastic deformation CPOs are wildly spread over the full BA-index range. The (001) pole figure J index is the lowest pole figure value in both microstruc-tural types. In the magmatic samples, the (010) pole figure J index is the highest values and the [100] pfJ has an inter-mediate value, but both decrease as the BA-index increases from 0.1 to about 0.6. In contrast, in the plastically deformed samples the (010) and (001) pfJ linear fit are almost con-stant, whereas the [100] pfJ increases with increasing BA-index, and is the highest pfJ value for BA-indices > 0.3.
5.8 Elastic symmetry analysis
Here we use the decomposition of the elastic tensors cal-culated using plagioclase CPOs (see Sect. 3) as additional information about fabric related symmetry. Both magmatic and plastic deformation microstructural types have very high isotropic components, 95.9 and 96.2 % respectively, and among the anisotropic components triclinic is the highest, 2.1 and 2.3 % respectively (Fig. 7, Table 4). The magmatic
type has higher orthorhombic (1.0 %) and hexagonal (0.4 %) components whereas the plastic deformation has a relatively high monoclinic (0.8 %) component.
6 Seismic properties
We calculated two versions of the seismic properties, de-pending on the type of CPO data (1 ppg or gridded data) to show the effect of these parameters on the calculated proper-ties:
1. 1 ppg data considering just the plagioclase CPOs (pla-gioclase 100 %, Table 5), and
2. gridded data considering just the plagioclase CPOs (plagioclase 100 %, Table 6).
The results for 1 sample are shown in Fig. 8 as an ex-ample. Seismic properties are calculated from 1 ppg data (Fig. 8a and c) and gridded data (Fig. 8b and d). P wave propagation is fastest parallel to the highest density of (010) and slowest in the orthogonal direction (Fig. 9a and b).
Fig. 4. Relationship between the fabric strength (J index) and the number of measured grains. CPOs with less than 100 measurements show abnormally high J values, and are not considered.
The polarization plane of the fastest S wave (Vs1)is
dom-inantly sub-perpendicular to the great circle that defines the preferred alignment of (010) planes. Vp ranges from
6.56 to 6.80 km s−1for the 1 ppg version, and from 6.51 to 6.91 km s−1for the gridded data version. The differences be-tween 1 ppg and gridded CPO data is the effect of the grain size heterogeneity that is only recorded in the gridded data; this effect is particularly marked in the case of a porphy-roclastic texture with large porphyroclast grains as in sam-ple 176-735B-133R1-35 (Fig. 2e). Gridded data in this case also produces higher values of anisotropy for both P wave and S wave, but does not markedly change the anisotropy direction; P wave anisotropy (AVp) changes from 3.6 % to
5.9 %, and maximum S wave anisotropy (AVsmax)changes
from 4.3 % to 7.3 % (Fig. 8).
To calculate seismic properties of the complete CPO database in a consistent way, including oldest data sets that were acquired manually, we have to use the 1 ppg data. This also has the advantage to allow a direct com-parison with the other existing CPO database for olivine of Ben Ismaïl and Mainprice (1998). We should point out that 100 % plagioclase aggregates do not realistically rep-resent the seismic properties of polyphased rocks such as gabbro, it does however allow us to quantify the contribu-tion of plagioclase to the anisotropy of crustal rocks. The 100 % plagioclase aggregate P wave velocity varies from 6.38 km s−1to 7.30 km s−1, the mean S wave velocity varies from 3.29 km s−1 to 3.56 km s−1, P wave anisotropy varies from 1.0 % to 11.0 %, and the maximum S wave anisotropy varies from 0.99 % to 13.85 %.
Fig. 5. (a, b) Histograms of J index. Data are grouped as a func-tion of deformafunc-tion type (a) and CPO type (b). See text for further description. (c, d) Relation between ODF and pole figure J indices for magmatic (c) and plastic deformation microstructures (d). The straight lines [100], ⊥(010) and ⊥(001) are linear fits to scattered data for J index of pole figures of the plagioclase CPOs of individ-ual samples.
The seismic properties of the three CPO symmetry types defined above, Axial-B, P-type and Axial-A, are presented in Fig. 9 for 100 % plagioclase aggregates. The P wave ve-locity distribution illustrates the changes with CPO symme-try; the Axial-B has a high Vp point maximum normal to
the foliation, the P-type has similar high velocity normal to the foliation and north-south girdle of high velocity, and the Axial-A has a high velocity girdle normal to the foliation. The evolution of the S wave anisotropy is more complex as Axial-B has two symmetrical girdles of high anisotropy. The P-type has two less symmetrical girdles of high anisotropy. The Axial-A has a large girdle of high anisotropy nearly par-allel to the foliation. The Vs1polarization pattern has no
sim-ple relationship to the foliation orientation, but is essentially sub-perpendicular to the foliation in all three types of CPO.
7 Discussion
7.1 Relationships between seismic anisotropy, fabric strength and symmetry
The effect of plagioclase CPO symmetry on seismic prop-erties is directly illustrated in Fig. 9. In all three types of
Fig. 6. (a, b) Histograms of BA-index. Data are grouped as a func-tion of deformafunc-tion type; (a) magmatic microstructure and (b) plas-tic deformation microstructure. (c, d) The variation of J index of ODFs and pole figures as a function of symmetry defined by BA-index for magmatic (c) and plastic deformation microstructures (d). The straight lines J , [100], ⊥(010) and ⊥(001) are linear least-squared fits to scattered data for J index of ODFs and pole figures of the plagioclase CPOs of individual samples.
CPO, the fast velocity direction of the samples is that of the preferred orientation of the normal to planes (010), i.e., perpendicular to the foliation in foliated samples. The P-type symmetry is clearly a transitional symmetry between the two Axial-B and Axial-A end-members, with fast directions defining a point maximum, and a girdle, respectively. The magnitude of anisotropy does not change greatly between the three CPO symmetries, for both P wave (7.2, 7.7 and 6.4 %) and S wave (6.7, 8.2 and 7.2 %). The variation of the P wave velocities follows a simple pattern, the S wave anisotropy and Vs1 polarization have more complex distributions in all
the CPO symmetry types.
In our database, the range of J index for plagioclase CPOs covers a slightly smaller range (1.1 to 14.3; Table 3) than that documented for olivine (2.3 to 16.9) when recalculated here using our MTEX code (Hielscher and Schaeben, 2008; Mainprice et al., 2011) for the data used by Ben Ismaïl and Mainprice (1998). Figure 10 shows the seismic anisotropy as a function of the ODF J index for both P waves (Fig. 10a) and S waves (Fig. 10b), we have also plotted a trend line for the olivine CPO data from Ben Ismaïl and Mainprice (1998). The seismic anisotropy increases as a non-linear function of fabric strength, up to 11 % for P wave and 14 % for S wave. The P wave anisotropy is higher for magmatic than plastic deformation microstructures (Fig. 10a), whereas for S wave anisotropy both microstructures have similar anisotropies.
Fig. 7. Decomposition of elastic symmetry into anisotropic triclinic, monoclinic, orthorhombic, tetragonal and hexagonal components of Voigt averages calculated using plagioclase CPOs. The frequencies are mean values of all samples. N.B. the isotropic symmetry compo-nent is not shown here, it represents 95.9 % of magmatic microstruc-ture and 96.2 % of plastic deformation microstrucmicrostruc-ture.
The scatter in anisotropy values for P and S waves for both microstructural types increases with increasing J index (Fig. 10a, b). This is more prominent for S waves, and was not observed for olivine by Ben Ismaïl and Mainprice (1998). The anisotropy of P waves (AVp) varies between 1.0 and
11.0 %, with a mean value of 4.7 % and a standard deviation of 2.0, whereas the maximum shear wave splitting (AVsmax)
varies between 1.0 % and 13.8 %, with a mean value of 4.7 % and a standard deviation of 2.2. AVp is smaller than those
reported for olivine aggregates and AVs has similar range
(in olivine aggregates, AVp varies between 3.1 % to 19.1%
and AVsmax varies between 2.5 % to 13.5 %; Ben Ismaïl and
Mainprice, 1998). The trend line for AVp of olivine
aggre-gates on Fig. 10a shows a much stronger anisotropy at low to moderate J index than that for plagioclase aggregates. Although seismic anisotropy (for both P and S waves) in-creases non-linearly as a function of fabric strength for both plagioclase (Fig. 10a and b) and olivine, the non-linearity is stronger for olivine. AVp is significantly higher in olivine,
whereas for AVs olivine anisotropy is only slightly higher
than that of plagioclase.
The plots of anisotropy as a function of fabric symmetry using the BA-index (Fig. 10c and d) shows similar trends for P and S wave, including high values for Axial-A and P-type for the magmatic microstructures. AVp and AVs do
not vary significantly with fabric symmetry for the plastic deformation microstructure. The scatter is more apparent in the symmetry plots than for fabric strength, suggesting that fabric strength is the first-order control of the magnitude of anisotropy.
7.2 The effect of plastic deformation overprint of a mag-matic microstructure on CPO type
In most plastically deformed samples, it is highly likely that crystal-plastic deformation is superposed on pre-existing
Fig. 8. Seismic properties of sample 176-735B-133R1-35 (ODP Hole 735B oxide gabbro, crystal-plastic microstructure). Plagioclase CPOs plotted from 1 ppg (a) and gridded (b) data (see Secti. 3.1 for further explanation). Dotted lines and stars represent the trace of the foliation, and the vertical in the drill core, respectively. Seismic properties are calculated from 1 ppg (c) and gridded (d) data. The differences between 1 ppg data and gridded data reflect the effect of the heterogeneity of grain size. Contours are multiples of uniform density; Vpis the
three-dimensional distribution of the P wave velocity; anisotropy is 100(Vpmax−Vpmin)/(Vpmean); AVs is the three-dimensional distribution of
the polarization anisotropy of S waves due to S wave splitting; and VS1 is the velocity of the fast S wave (S1); each small segment represents the orientation of the polarization plane at the point at which S1 penetrates the hemisphere.
Fig. 9. Seismic properties of samples (a) Axial-B (HD76r8_a), (b) P-type (92OB140c) and (c) Axial-A (176-735B-149R3-75) calcu-lated from plagioclase CPOs in the 1 ppg format (Fig. 2). The folia-tion is approximately horizontal east–west. Lower hemisphere pro-jections.
magmatic microstructure. This crystal-plastic overprint of magmatic textures is commonly described in slow-spread crust drill cores (e.g., Dick et al., 1999, 2000; Blackman et al., 2006). In our plagioclase database, the factors that are consistent with such plastic deformation overprint are:
Fig. 10. Relation between P and S wave anisotropy of 100 % pla-gioclase aggregates with CPO strength measured by the J index of the ODF (a, b), and CPO symmetry measured by the BA-index for magmatic and plastic deformation microstructures (c, d). Red and blue curves lines in are power-law least-square fits (a, b) and linear least-square fits (c, d) for plagioclase. The green curve is the loga-rithmic least-square fit to the Ben Ismaïl and Mainprice (1998) data base of olivine CPOs.
Table 4. Elastic symmetry decomposition for the gabbros studied here. Tri: triclinic; Mono: monoclinic; Ortho: orthorhombi; Tetra: tetrago-nal; Hex: hexagotetrago-nal; Iso: isotropic, respectively.
Sample# Tri Mono Ortho Tetra Hex Iso Oman ophiolite 86OA20C 2.801 2.076 0.910 0.213 0.940 93.060 88OA13 1.973 0.592 2.376 0.503 0.420 94.138 88OA14b 2.502 0.941 1.198 0.025 0.537 94.796 90OA68 1.611 0.765 4.068 0.380 0.052 93.123 90OA77 3.141 0.294 3.593 0.295 0.160 92.517 90OF11 1.828 0.308 1.943 0.376 1.011 94.534 92OB100b 1.746 0.259 2.232 0.063 1.001 94.700 92OB101 1.886 0.506 2.019 0.198 0.461 94.931 92OB134 1.886 0.506 2.019 0.198 0.461 94.931 92OB139 3.306 0.238 1.733 0.105 0.086 94.532 92OB140a 3.054 0.057 4.341 0.186 0.152 92.210 92OB140c 3.511 0.087 2.465 0.034 0.148 93.756 92OB142 2.447 0.276 4.013 0.510 0.622 92.132 92OB143 2.366 3.629 2.572 0.007 0.127 91.298 93OB157 1.828 0.673 3.752 0.128 0.236 93.383 94OB28 1.260 0.884 4.285 0.265 0.331 92.976 95OA129 3.092 0.675 0.054 0.004 0.285 95.889 95OB4 2.212 0.076 1.764 0.023 0.182 95.744 97OB1C 1.564 0.247 2.128 0.117 1.675 94.269 98OB10a 1.540 0.427 3.021 0.005 0.103 94.904 98OB10e 1.447 0.351 2.842 0.177 0.069 95.115 98OB10g 4.031 0.125 2.271 0.056 0.170 93.347 98OB7a 5.199 1.418 1.162 0.030 0.028 92.164 98OB8b 3.067 0.424 2.015 0.152 0.144 94.198 06OA31b 3.093 0.123 1.428 0.375 0.020 94.961 07_2_OA_10B 1.217 0.142 1.117 0.826 2.317 94.381 07_2_OA_18b 1.645 0.188 0.920 0.952 1.375 94.921 07_2_OA_18c 1.266 0.297 1.015 1.408 1.943 94.072 07_2_OA_30b 1.279 0.200 1.167 0.686 2.741 93.928 07_2_OA_30h 1.237 0.228 1.232 0.697 2.832 93.774 07_2_OA_37 1.421 0.402 1.284 1.127 3.193 92.574 07_2_OA_37b 1.004 0.171 0.848 1.316 2.049 94.612 07_2_OA_41g 1.093 0.251 1.278 1.082 2.698 93.598 07_2_OA_42c 1.133 0.268 1.501 0.750 2.414 93.934 07_2_OA_45c3 2.154 0.289 0.209 2.146 1.563 93.640 07_2_OA_45c4 2.357 0.221 0.494 1.144 1.457 94.328 07_2_OA_66 2.890 0.266 0.993 0.416 1.993 93.442 07_OA_8g_2S 0.664 0.162 1.300 1.098 2.477 94.300 07-2OA13 2.582 0.508 0.506 0.001 0.035 96.368 07OA20a 0.629 0.395 0.042 0.284 0.146 98.503 07OA20c1 1.284 0.023 0.104 0.001 0.333 98.255 07OA20d 1.490 0.363 0.280 0.008 0.654 97.205 07OA20e 1.260 0.403 0.334 0.006 0.582 97.415 Cocos Plate (East-Pacific Rise), ODP Hole 1256D
312-1256D-202R1-8 0.922 0.088 0.172 0.002 0.049 98.768 312-1256D-213R1-52 2.958 0.013 0.593 0.014 0.245 96.176 312-1256D-223R3-5 1.006 0.096 0.052 0.009 0.071 98.766 312-1256D-230R1-15 1.603 0.017 0.668 0.249 0.548 96.914 312-1256D-230R1-73 2.499 0.094 0.007 0.027 0.057 97.316 312-1256D-230R1-118-a 2.177 0.116 0.028 0.010 0.046 97.623 312-1256D-230R1-118-b 2.243 0.104 0.217 0.035 0.033 97.368 312-1256D-232R1-71 0.602 0.156 0.049 0.000 0.410 98.783