HAL Id: hal-01059422
https://hal.archives-ouvertes.fr/hal-01059422
Submitted on 4 Apr 2015
HAL is a multi-disciplinary open access
archive for the deposit and dissemination of
sci-entific research documents, whether they are
pub-lished or not. The documents may come from
teaching and research institutions in France or
abroad, or from public or private research centers.
L’archive ouverte pluridisciplinaire HAL, est
destinée au dépôt et à la diffusion de documents
scientifiques de niveau recherche, publiés ou non,
émanant des établissements d’enseignement et de
recherche français ou étrangers, des laboratoires
publics ou privés.
properties retrieved from space-based thermal infrared
radiometry
T. Fauchez, P. Dubuisson, C. Cornet, Frédéric Szczap, Anne Garnier, Jacques
Pelon, Kerry Meyer
To cite this version:
T. Fauchez, P. Dubuisson, C. Cornet, Frédéric Szczap, Anne Garnier, et al.. Impacts of cloud
hetero-geneities on cirrus optical properties retrieved from space-based thermal infrared radiometry.
Atmo-spheric Measurement Techniques, European Geosciences Union, 2015, 8, pp.633-647.
�10.5194/amt-8-633-2015�. �hal-01059422�
www.atmos-meas-tech.net/8/633/2015/ doi:10.5194/amt-8-633-2015
© Author(s) 2015. CC Attribution 3.0 License.
Impacts of cloud heterogeneities on cirrus optical properties
retrieved from space-based thermal infrared radiometry
T. Fauchez1, P. Dubuisson1, C. Cornet1, F. Szczap2, A. Garnier3,4, J. Pelon5, and K. Meyer6,71Laboratoire d’Optique Atmosphérique, Université Lille 1, Villeneuve d’Ascq, France 2Laboratoire de Météorologie Physique, Université Blaise Pascal, Clermont Ferrand, France 3Science Systems and Applications, Inc., Hampton, Virginia, USA
4NASA Langley Research Center, Hampton, Virginia, USA
5Laboratoire Atmosphères, Milieux, Observations Spatiales, UPMC-UVSQ-CNRS, Paris, France
6Goddard Earth Sciences Technology and Research (GESTAR), Universities Space Research Association,
Columbia, Maryland, USA
7NASA Goddard Space Flight Center, Greenbelt, Maryland, USA
Correspondence to: C. Cornet ([email protected])
Received: 20 May 2014 – Published in Atmos. Meas. Tech. Discuss.: 27 August 2014 Revised: 2 January 2015 – Accepted: 12 January 2015 – Published: 9 February 2015
Abstract. This paper presents a study, based on simulations,
of the impact of cirrus cloud heterogeneities on the retrieval of cloud parameters (optical thickness and effective diam-eter) for the Imaging Infrared Radiometer (IIR) on board CALIPSO. Cirrus clouds are generated by the stochastic model 3DCLOUD for two different cloud fields and for sev-eral averaged cloud parameters. One cloud field is obtained from a cirrus observed on 25 May 2007 during the airborne campaign CIRCLE-2 and the other is a cirrus uncinus. The radiative transfer is simulated with the 3DMCPOL code. To assess the errors due to cloud heterogeneities, two related re-trieval algorithms are used: (i) the split-window technique to retrieve the ice crystal effective diameter and (ii) an al-gorithm similar to the IIR operational alal-gorithm to retrieve the effective emissivity and the effective optical thickness. Differences between input parameters and retrieved param-eters are compared as a function of different cloud proper-ties such as the mean optical thickness, the heterogeneity pa-rameter and the effective diameter. The optical thickness het-erogeneity for each 1 km × 1 km observation pixel is repre-sented by the optical thickness standard deviation computed using 100 m × 100 m subpixels. We show that optical thick-ness heterogeneity may have a strong impact on the retrieved parameters, mainly due to the plane-parallel approximation (PPA assumption). In particular, for cirrus clouds with ice crystal diameter of approximately 10 µm, the averaged
er-ror on the retrieved effective diameter and optical thickness is about 2.5 µm (∼ 25 %) and −0.20 (∼ 12 %), respectively. Then, these biases decrease with increasing effective size due to a decrease of the cloud absorption and, thus, the PPA bias. Cloud horizontal heterogeneity effects are greater than other possible sources of retrieval errors such as those due to cloud vertical heterogeneity impact, surface temperature or atmo-spheric temperature profile uncertainty and IIR retrieval un-certainty. Cloud horizontal heterogeneity effects are larger than the IIR retrieval uncertainty if the standard deviation of the optical thickness, inside the observation pixel, is greater than 1.
1 Introduction
In the context of global climate change, the representation and role of clouds are still uncertain. For example, ice clouds play an important role in the climate and on the Earth’s ra-diation budget (Liou, 1986). Cirrus clouds lead mainly to a positive radiative forcing due to their high temperature con-trast with respect to the surface. However, the cirrus radiative forcing could depend on the cirrus optical thickness, altitude and ice crystal effective size (Katagiri et al., 2013). Conse-quently, to improve our knowledge, it is essential to assess the feedback and climate effects of these clouds (Stephens,
1980). Global satellite observations are well suited to moni-toring and investigating cloud evolution and characteristicsm because passive top-of-atmosphere (TOA) radiometric mea-surements allow for retrievals of cloud properties such as op-tical thickness and ice crystal effective diameter. In this work, we focus on infrared measurements obtained by the Imag-ing Infrared Radiometer (IIR; Garnier et al., 2012, 2013) on-board the Cloud-Aerosol Lidar and Infrared Pathfinder Satel-lite Observations (CALIPSO).
Because of operational constraints (lack of information re-garding the 3-D structure of the atmosphere, time constraints, etc.), satellite-based cloud retrieval algorithms assume that clouds are homogeneous and infinite between two planes. This assumption of 1-D radiative transfer is called the ho-mogeneous independent pixel approximation (Cahalan et al., 1994) or independent column approximation (Stephens et al., 1991). However, in a real atmosphere, clouds have 3-D struc-tures, i.e, horizontal and vertical heterogeneities and the sim-plified 1-D atmosphere assumption may lead to biased cloud property retrievals (Fauchez et al., 2014). Many studies have been conducted to determine the impact of cloud hetero-geneities on cloud products derived from solar spectral mea-surements. These studies primarily focused on warm clouds such as stratocumulus (Varnai and Marshak, 2001; Zinner and Mayer, 2006; Kato and Marshak, 2009, etc.) and showed that the sign and amplitude of retrieval errors depend on nu-merous factors, such as the spatial resolution, wavelength, geometry of observation and cloud morphology. Concerning cirrus clouds, Fauchez et al. (2014) showed that cirrus cloud heterogeneities lead to non-negligible effects on brightness temperatures (BT) and that these effects mainly depend on the standard deviation of the optical thickness inside the ob-servation pixel. The retrieval of cloud properties using ra-diances or BT may thus be impacted by the heterogeneity effects. In this work, we extend the study of Fauchez et al. (2014) to investigate the impacts of cirrus heterogeneities on cloud optical property (optical thickness and ice crystal ef-fective size) retrievals using simulations of radiometric mea-surements of IIR in three typical spectral bands, namely 8.65, 10.60 and 12.05 µm.
In the thermal infrared atmospheric window (8–13 µm), cloud optical properties (optical thickness and ice crystal effective size) are retrieved using the split-window tech-nique (SWT) (Inoue, 1985; Parol et al., 1991; Dubuisson et al., 2008). This method is generally limited to thin cirrus clouds (optical thickness less than approximately 3 at 12 µm) and small crystals (effective diameters smaller than approxi-mately 40 µm). In the visible and near-infrared spectra, cloud optical properties are commonly retrieved using the Naka-jima and King method (NakaNaka-jima and King, 1990) that com-bines measurements in visible and near-infrared channels for optically thicker cirrus clouds and larger ice crystals. Cooper et al. (2007) combined these two methods for MODIS mea-surements to treat thin and thick cirrus simultaneously.
The paper is organized as follows. In Sect. 2, we present a short description of the modeling tools used in this study: (i) the cloud generator 3DCLOUD (Szczap et al., 2014), (ii) the radiative transfer code 3DMCPOL (Cornet et al., 2010; Fauchez et al., 2014) and (iii) two related retrieval al-gorithms. In Sect. 3, we present possible retrieval errors due to the 1-D approximation. In Sect. 4, we compare hetero-geneity effects with other possible error sources considered in this paper such as those due to cloud vertical heterogene-ity, surface temperature or atmospheric temperature profile uncertainty, as well as the IIR retrieval uncertainty. Conclu-sions and perspectives are given in Sect. 5.
2 Numerical models
2.1 3-D ice water content generation
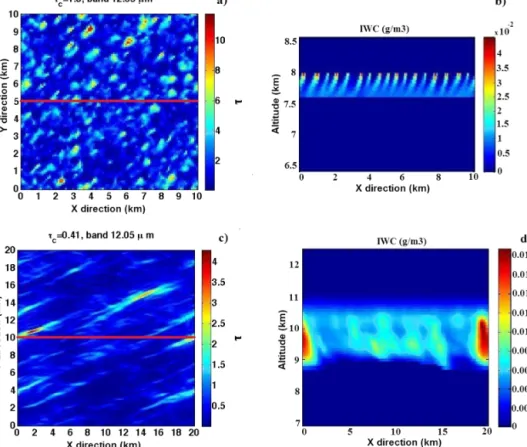
The stochastic model 3DCLOUD (Cornet et al., 2010; Szczap et al., 2014) is employed to generate realistic 3-D cirrus clouds. This model uses a simplified dynamical and thermodynamical approach to generate heterogeneous 3-D clouds as well as a Fourier transform framework to constrain scale invariant properties (Hogan and Kew, 2005; Szczap et al., 2014). Two different cirrus fields were simu-lated (Fig. 1) in a mid-latitude summer (MLS) atmosphere.
The first cirrus field has been modeled from meteorologi-cal profiles presented by Starr and Cox (1985) coupled with a wind profile to form virgas. The cloud layer is defined by the mean optical thickness τc, the standard deviation of the
op-tical thickness on the entire field στc, the cirrus heterogene-ity parameter ρτ=στc/τc (Szczap et al., 2000) and the ice crystal effective diameter Defffor an aggregate crystal shape
(Yang et al., 2005). Deffis defined as
Deff=
3 2
R V (L)n(L)dL
R A(L)n(L)dL, (1)
where L is the maximum crystal size, V (L) is the volume of the crystal, A(L) is the projected area and n(l) is the size distribution (Yang et al., 2000).
Eight cirrus clouds are generated (Table 1) by varying the above parameters to cover the characteristics of typical cirrus clouds (Sassen and Cho, 1992; Szczap et al., 2000; Carlin et al., 2002; Lynch et al., 2002). Note that the ef-fective diameter of cirrus cases 3 to 5 (Deff=9.95 µm) is
probably too small for cirrus with a mean optical thickness of 1.80 because aggregations processes tend to increase the effective size (Fig. 12 of Garnier et al., 2013). Cloud het-erogeneity effects are probably slightly overestimated due to the too-small crystal effective size (heterogeneity effects are larger for small effective sizes) with respect to the mean cir-rus optical thickness. Nevertheless, circir-rus cases 3 to 5 are useful for understanding how heterogeneity effects increase with the optical thickness heterogeneity parameter (ρτin
Figure 1. Top figures: Cirrus generated from realistic meteorological conditions (Starr and Cox, 1986; Hogan and Kew, 2005) with (a) the
10 km × 10 km optical thickness field simulated at 12.05 µm with a horizontal spatial resolution of 100 m and (b) the x–z view through the red line of (a) of the cirrus IWC with a vertical spatial resolution of 58 m. Bottom figures: CII cirrus simulation based on optical and microphysical properties of the cirrus observed during the CIRCLE-2 campaign on 25 May 2007: (c) the 20 km × 20 km optical thickness
field at 12.05 µm, with a horizontal spatial resolution of 100 m and with a mean optical thickness τc=0.41 observed by IIR at 12.05 µm, and
(d) the x–z view through the red line of (c) the cirrus IWC with a vertical resolution of 58 m.
cloud properties held constants. Two cirrus cloud cases are presented in Fig. 1. The first cloud structure is presented in Fig. 1a and b. Figure 1a presents the 10 km × 10 km optical thickness field at 12.05 µm with a spatial resolution of 100 m, and Fig. 1b presents the x–z view of the ice water content (IWC) of cirrus case 3.
Figure 1c and d show cirrus generated from measurements obtained on 25 May 2007 during the CIRCLE-2 airborne campaign (Mioche et al., 2010). In situ measurements pro-vided by the aircraft, as well as IIR radiometric measure-ments (mean optical thickness and mean heterogeneity pa-rameter), are used as input for 3DCLOUD. In addition, mete-orological data from the European Center for Medium-Range Weather Forecasts are used to constrain the meteorological profiles (wind speed and orientation, temperature, humidity, etc.). The scale invariant properties of every cirrus case pre-sented in Table 1 are controlled by a constant spectral slope (−5/3) for all scales and altitude levels. This agrees with the spectral slope of the backscattering coefficient measured at 532 nm at different altitudes by the Cloud-Aerosol Lidar with Orthogonal Polarization (CALIOP) on-board CALIPSO and
the extinction coefficient measured by the polar nephelome-ter at the aircraft altitude (Fauchez et al., 2014).
2.2 Optical property parametrization
Cirrus optical properties are difficult to characterize because of the diversity of crystal sizes, shapes and orientations in a cirrus cloud. Several parametrizations were developed for visible and infrared wavelengths (Magono, 1966; Labonnote et al., 2000; Yang et al., 2001, 2005; Baum et al., 2005b, 2011; Baran and Labonnote, 2007; Baran et al., 2009; Baran, 2012; Baran et al., 2013). For cirrus cases 1 to 8 we employ the aggregate ice crystal model (Yang et al., 2001, 2005) with a monodisperse distribution used in the IIR retrieval algo-rithm (Garnier et al., 2013) that provides an extinction co-efficient, a single-scattering albedo and an asymmetry factor (Yang et al., 2001, 2005). Note that Dubuisson et al. (2008) have shown that the IIR thermal infrared channels are weakly sensitive to the ice crystal shape and almost insensitive to the size distribution. The IIR retrieval algorithm uses three ice crystal shapes (Garnier et al., 2012, 2013), namely a solid column, aggregate and plate. The phase functions of these
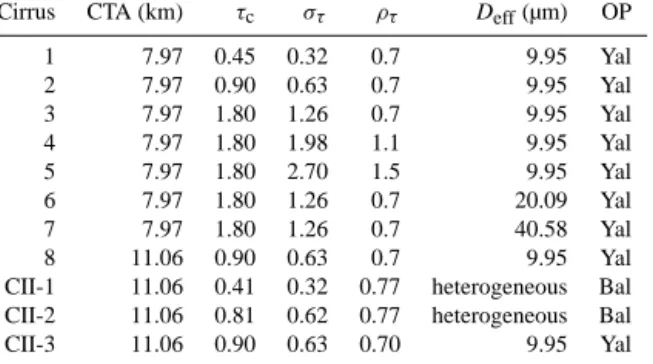
Table 1. Mean cloud properties of the cirrus generated by
3DCLOUD. “CTA” corresponds to the cirrus-top altitude; “OP” corresponds to the optical properties parametrization; “Yal” repre-sents the model of ice crystals developed by Yang et al. (2001, 2005) for aggregates ice crystals; and “Bal” represents the parametrization of ice crystals’ optical properties developed by Baran et al. (2009),
Baran (2012), and Baran et al. (2013); τcis the cloud mean optical
thickness; στis the cloud standard deviation of the optical thickness
estimated from the optical thickness of the subpixels at the scale of
100 m × 100 m; ρτ is the cloud heterogeneity parameter defined as
the ratio of στby τc; and Deffis the ice crystal effective diameter.
Cirrus CTA (km) τc στ ρτ Deff(µm) OP
1 7.97 0.45 0.32 0.7 9.95 Yal 2 7.97 0.90 0.63 0.7 9.95 Yal 3 7.97 1.80 1.26 0.7 9.95 Yal 4 7.97 1.80 1.98 1.1 9.95 Yal 5 7.97 1.80 2.70 1.5 9.95 Yal 6 7.97 1.80 1.26 0.7 20.09 Yal 7 7.97 1.80 1.26 0.7 40.58 Yal 8 11.06 0.90 0.63 0.7 9.95 Yal
CII-1 11.06 0.41 0.32 0.77 heterogeneous Bal
CII-2 11.06 0.81 0.62 0.77 heterogeneous Bal
CII-3 11.06 0.90 0.63 0.70 9.95 Yal
particles are relatively smooth in the thermal infrared with a small forward peak (asymmetry factor g usually below 0.9) and can be approximated by the Henyey–Greenstein phase function. While this assumption is certainly problematic for irregular crystal shapes, as shown by Baum et al. (2005a, b), we use the Henyey–Greenstein phase function to remain con-sistent with the official IIR retrieval algorithm (Garnier et al., 2012, 2013). For these cirrus cases, the optical properties are constant over the entire cloud.
In order to generate 3-D and heterogeneous cloud optical properties fields for the CII-1 and CII-2 cirrus cases, we used the parametrization of Baran et al. (2009, 2013) and Baran (2012). This parametrization, derived from in situ measure-ments of more than 20 000 particle-size distributions (Field et al., 2005, 2007), gives the optical coefficients as a function of IWC and temperature.
2.3 TOA brightness temperature simulations
TOA brightness temperatures in the three IIR thermal in-frared channels (8.65, 10.60 and 12.05 µm) are simulated with the 3DMCPOL code developed in the visible range by Cornet et al. (2010) and extended to the infrared range by Fauchez et al. (2014). 3DMCPOL is a forward Monte Carlo algorithm using the local estimate method (Marshak and Davis, 2005; Mayer, 2009) and is able to simulate ra-diances and brightness temperatures from the visible to the infrared range, including the polarization. The atmosphere is subdivided in voxels (3-D pixels), with a constant hori-zontal size (dx, dy) and a variable vertical size (dz). Each voxel is described by the extinction coefficient σe, the
single-scattering albedo $0, the phase function and the cloud
tem-perature Tc.
3-D BT are first simulated at 100 m × 100 m spatial reso-lution and are then averaged to the IIR spatial resoreso-lution of 1 km × 1 km (BT3-D1 km). 1-D BT are obtained by averaging the optical property field to 1 km × 1 km spatial resolution before simulating the BT (BT1-D1 km).
Note that the statistical uncertainty of these simulations is below 0.5 K, which is less than the IIR accuracy of about 1 K. Comparisons between 3DMCPOL statistical uncertainty, IIR accuracy and heterogeneity effects can be found in Fauchez et al. (2014) (Figs. 8 and 10) for the same cloud scenes. This statistical uncertainty is reached by simulating between 5 and 10 billion photons for each case.
2.4 Retrieval algorithms of cloud parameters
Two related algorithms are used to retrieve cloud products: the split-window technique (Inoue, 1985; Parol et al., 1991; Dubuisson et al., 2008) to retrieve the effective diameter and an algorithm similar to the IIR operational algorithm to re-trieve the effective emissivity and the effective optical thick-ness.
In the thermal infrared atmospheric window, the SWT is one of the most used methods to retrieve the effective diam-eter and the cloud optical thickness using the difference of brightness temperatures between two thermal infrared chan-nels (Parol et al., 1991; Radel et al., 2003; Dubuisson et al., 2008; Garnier et al., 2012, 2013). Figure 2 shows bright-ness temperature difference (BTD) for varying optical thick-ness (0–50 at 12.05 µm) and eight effective diameters (Deff)
as a function of the 12.05 µm BT (BT12). Each “arch”
cor-responds to a single effective size, with BTD decreasing with increasing particle size and optical thickness decreas-ing along each arch from opaque cloud (low BT) to clear sky (high BT). It is evident that the sensitivity of the SWT to large particles (Deff>40 µm) is weak, one of the main
disadvan-tages of this method that can only accurately determine the effective size of particles smaller than approximately 40 µm for cirrus clouds with an optical thickness approximately be-tween 0.5 and 3 (Dubuisson et al., 2008; Sourdeval et al., 2012). Dubuisson et al. (2008) also show that the SWT re-trieval accuracy for ice crystal effective diameter is between 10 and 25 % and for the optical thickness is about 10 %. We note that the amplitude of the BTD8−10arches is significantly
smaller than the two others because its sensitivity to Deff is
weaker. Consequently, this channel pair will not be used in this study.
Similar to the SWT, the IIR operational algorithm (Gar-nier et al., 2012) uses radiance differences between channels, though in a different way. Intermediate products (effective emissivity, effective optical thickness and microphysical in-dices) are computed to retrieve the ice crystal effective diam-eter and shape. The effective emissivity refers to the contri-bution of scattering in the retrieved emissivity, especially for
small ice crystals in the band at 8.65 µm. One of the major ad-vantages of using the effective emissivity is its independence of cloud-top altitude or geometrical thickness, contrary to the brightness temperature differences used in the SWT. The ef-fective emissivity, εeff,k, for the channel k is defined as
εeff,k= [Rk−Rk,BG]/[Bk(Tc, Zc) − Rk,BG], (2)
where Rk is the measured (or simulated) radiance in the
channel k, Rk,BG is the measured (or simulated) radiance
at TOA for clear sky and Bk(Tc, Zc)is the radiance of an
opaque cloud (black body) located at the centroid altitude Zc
and at the centroid temperature Tc, provided by the GEOS-5
model (Rienecker et al., 2008). The layer centroid altitude is a weighted average altitude based on the attenuated backscat-tered intensity of the LIDAR signal at 532 nm (Vaughan et al., 2009). Note that, in this study, we set the centroid alti-tude to the geometrical middle of the cloud.
The effective optical thickness τeff,kis then calculated as
τeff,k= −ln(1 − εeff,k). (3)
From τeff,k, the microphysical indices MI12/8and MI12/10
are defined as the ratio of τeff,k between 12.05 and 8.65 µm
channels and 12.05 and 10.60 µm channels, respectively:
MI12/8=τeff,12/τeff,8, MI12/10=τeff,12/τeff,10. (4)
These microphysical indices strongly depend on the mi-crophysical and optical properties of the cloud layer, namely the effective diameter and shape of the ice crystals. From a look-up table (LUT) of the microphysical indices as a func-tion of the effective diameter and shape precalculated by the FASDOM code (Dubuisson et al., 2005), two values of ef-fective diameters (Deff,1 km(10, 8) and Deff,1 km(12, 8)) are
obtained for each particle shape (aggregates, plates and solid columns) considered in the IIR retrieval algorithm. The shape corresponding to the smallest difference between the two
Deff, 1 kmis selected. For the computation of optical
proper-ties, the IIR operational algorithm uses the Yang et al. (2001, 2005) model with a monomodal effective diameter distribu-tion.
The uncertainty of the retrieval algorithm was checked by comparing optical properties retrieved from simulated radi-ances with the optical properties used as input in the radia-tive transfer. For this, we perform a D retrieval from 1-D-simulated radiances. The algorithm uncertainties are less than 2 % for effective diameters retrieved with the SWT (test not shown here) and 4 % for effective optical thickness re-trieved with the algorithm similar to the IIR operational al-gorithm (test not shown here).
3 Impact of cirrus heterogeneities on the
retrieved parameters
In this section, we present the heterogeneity effects on the retrieved products at the 1 km IIR spatial resolution as a
function of different cloud optical properties (i.e., optical thickness, effective diameters, extinction coefficients, single-scattering albedo and asymmetry factor) and microphysical (IWC) properties, cirrus-top altitude and geometrical thick-ness. The heterogeneity effects on the retrieved parameters are assessed by using the difference between products re-trieved from modeled 3-D (BT3-D1 km) and 1-D (BT1-D1 km) 1 km brightness temperatures.
In order to estimate the heterogeneity effects on the re-trieved cloud products, we define the following errors due to cloud heterogeneities:
1εeff=ε3-Deff −ε 1-D
eff (5)
for effective emissivities calculated by the Eq. (2);
1τeff=τeff3-D−τ 1-D
eff (6)
for effective optical thicknesses calculated by Eq. (3);
1MI12/8=MI3-D,12/8−MI1-D,12/8and
1MI12/10=MI3-D,12/10−MI1-D,12/10 (7)
for microphysical indices calculated from Eq. (4);
1Deff, 1 km=D3-Deff, 1 km−D
1-D
eff, 1 km (8)
for ice crystal effective diameter retrieved with the SWT. The “3-D” exponent corresponds to optical properties re-trieved from BT3-D1 kmand the “1-D” exponent corresponds to those retrieved from BT1-D1 km. Deff, 1 km1-D corresponds either to the effective diameter used in the radiative transfer simula-tion when it is known (cirrus cases 1 to 8 and CII-3) or to the effective diameter retrieved from BT1-D1 kmwhen the ice crystal effective diameters used in the radiative transfer simulation are unknown (cirrus cases CII-1 and CII-2).
Heterogeneity impacts due to the optical thickness vari-ability are discussed in Sect. 3.1 and those due to optical and microphysical property variabilities in Sect. 3.2.
3.1 Heterogeneity impacts due to the optical
thickness variability
Fauchez et al. (2014) show that BT3-D1 km are larger than BT1-D1 km and that their difference is well correlated with the standard deviation of the optical thickness inside the 1 km × 1 km observation pixel στ1 km. This brightness tem-perature difference is due to the plane-parallel approxima-tion caused by the non-linearity of the relaapproxima-tionship between brightness temperature and optical thickness. The impact of the PPA bias (|BT3-D1 km−BT1-D1 km|) is greater (in absolute value) for highly absorbing bands because the increase of cloud absorption leads to a larger brightness temperature contrast between the cirrus top and the clear sky atmosphere and, thus, to a stronger averaging effect. Figure 3 illustrates how cirrus heterogeneities affect the retrieval of the effective
250 260 270 280 290 −2 0 2 4 6 8 10 12 14 16 BTD 10−12 (K) BT12 (K) (a) 250 260 270 280 290 −2 0 2 4 6 8 10 12 14 16 BTD 8−12 (K) BT 12 (K) (b) 250 260 270 280 290 −2 0 2 4 6 8 10 12 14 16 BTD 8−10 (K) BT 12 (K) (c) D eff=1 μm D eff=5 μm Deff=10 μm Deff=20 μm D eff=30 μm Deff=40 μm Deff=60 μm D eff=80 μm
Figure 2. Brightness temperatures differences (BTD) as a
func-tion of the 12.05 µm brightness temperature (BT12) for eight
ef-fective diameters (Deff) and different optical thickness between 0
and 50 at 12.05 µm: (a) BTD10−12between 10.60 and 12.05 µm
channels, (b) BTD8−12between 8.65 and 12.05 µm channels and
(c) BTD8−10between 8.65 and 10.60 µm channels.
245 250 255 260 265 270 275 280 285 290 0 5 10 15 BTD 8−12 (K) BT12.05 μm (K) Deff=1 μm Deff=5 μm Deff=10 μm Deff=20 μm Deff=30 μm D eff=40 μm D eff=60 μm D eff=80 μm 245 250 255 260 265 270 275 280 285 290 0 10 20 30 40 50 τ12.05 μ m BT12.05 μm (K) Deff, 1km1D ; τ 1D 1km Deff, 1km3D ; τ 3D 1km Δτ Heterogeneity effects ΔDeff ΔDeff + Δτ
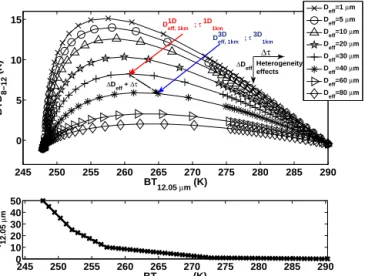
Figure 3. Top panel: brightness temperature differences between
8.65 and 12.05 µm (BTD12−8) as a function of the brightness
tem-perature at 12.05 µm (BT12). The red arrow shows an example of
ef-fective diameter, Deff, 1 km1-D , and optical thickness, τ1 km1-D, retrieved
in 1-D without heterogeneity effects, and the blue arrow shows the
corresponding effective diameter, Deff, 1 km3-D , and optical thickness,
τ1 km3-D, retrieved with heterogeneity effects. Each point of the arches
corresponds to an optical thickness represented in the bottom panel,
with τ12.05 µmas the optical thickness at 12.05 µm. Using the
plane-parallel approximation (PPA) leads to an overestimation of the ef-fective diameter and to underestimation of the optical thickness, re-spectively, compared to a 3-D retrieval.
diameter and the optical thickness. The tip of the red arrow represents the BTD and BT values obtained with a homo-geneous cloud with D1-Deff, 1 kmand τ1 km1-D. Using 3-D radiative transfer inside a heterogeneous cloud with the same mean properties, we obtained the BTD and BT values represented by the tip of the blue arrow in Fig. 3. As heterogeneity ef-fects are larger at the 12.05 µm channel than at the 8.65 µm
0 0.5 1 1.5 2 2.5 3 3.5 0 0.2 0.4 0.6 0.8 1
Effective optical thickness at 12.05 μ m
Effective emissivity Band at 8.65 μ m
Band at 10.60 μ m
Band at 12.05 μ m
εeff εeff
τeff τeff
Figure 4. Variation of the effective emissivity as a function of the
effective optical thickness at 12.05 µm, estimated in 1-D at the spa-tial resolution of 100 m for the three IIR channels and for cloudy
pixels belonging to cirrus cases 1 to 5. τeffrepresents the effective
optical thickness corresponding to the averaged effective
emissiv-ity εeff, τeffrepresents the averaged effective optical thickness and
εeffis its corresponding effective emissivity. Brown and green lines
show the effective emissivity and effective optical thickness values on the x axis and y axis, respectively, corresponding to a particular point on, for instance, the black arch. The mathematical formulation
of the PPA is expressed by the Jensen inequality εeff< εeff(τeff).
channel, brightness temperature differences (BTD8−12), first
simulated at the 100 m spatial resolution and then averaged to the 1 km IIR spatial resolution, are smaller than those re-trieved from radiances directly simulated at 1 km spatial res-olution. Consequently, as effective diameters increase with the decrease of BTD, the retrieved Deff, 1 km3-D is larger than the mean value D1-Deff, 1 kmand the retrieved optical thicknesses
τ1 km3-D is smaller than the mean optical thickness τ1 km1-D. In addition, Fig. 4 shows the effective emissivity as a func-tion of the effective optical thickness estimated at 100 m spatial resolution. The relationship between effective emis-sivities and effective optical thickness is nonlinear, as it is between brightness temperatures and optical thickness. Be-cause of the PPA bias, the average effective emissivity is smaller than the effective emissivity of the average of the effective optical thickness τeff. Similar to brightness
temper-atures, effective emissivities and effective optical thickness retrieved from radiances, first simulated at 100 m spatial res-olution of and then averaged to the IIR spatial resres-olution of 1 km, are smaller than those retrieved from radiances directly simulated at the spatial resolution of 1 km.
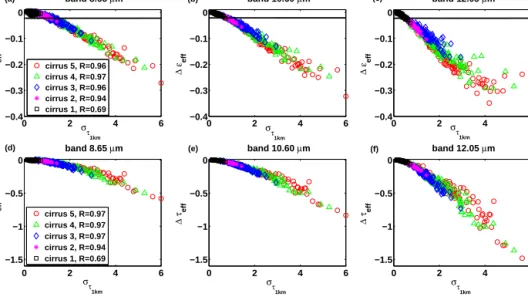
Figure 5 presents 1εeff(a, b and c) and 1τeff(d, e and f) as
a function of the standard deviation of the optical thickness inside the 1 km × 1 km observation pixel (στ1 km) for cirrus cases 1 to 5 and for 8.65, 10.60 and 12.05 µm channels, re-spectively. We notice, first of all, that 1εeffand 1τeffare
cor-related with στ1 kmat more than 94 % except for cirrus case 1 at 8.65 µm, where the horizontal transport smooths the slight
0 2 4 6 −0.4 −0.3 −0.2 −0.1 0 στ 1km Δ εeff band 8.65 μm cirrus 5, R=0.96 cirrus 4, R=0.97 cirrus 3, R=0.96 cirrus 2, R=0.94 cirrus 1, R=0.69 0 2 4 6 −0.4 −0.3 −0.2 −0.1 0 στ 1km Δ εeff band 10.60 μm 0 2 4 6 −0.4 −0.3 −0.2 −0.1 0 στ 1km Δ εeff band 12.05 μm 0 2 4 6 −1.5 −1 −0.5 0 στ 1km Δ τeff band 8.65 μm cirrus 5, R=0.97 cirrus 4, R=0.97 cirrus 3, R=0.97 cirrus 2, R=0.94 cirrus 1, R=0.69 0 2 4 6 −1.5 −1 −0.5 0 στ 1km Δ τeff band 10.60 μm 0 2 4 6 −1.5 −1 −0.5 0 στ 1km Δ τeff band 12.05 μm (a) (b) (c) (d) (e) (f)
Figure 5. Errors on the effective emissivity 1εeff (a, b and c) and on the effective optical thickness 1τeff (d, e and f) at 8.65, 10.60
and 12.05 µm, respectively, as a function of the optical thickness standard deviation, στ1 km, for cirrus cases 1 (τc=0.45, ρτ=0.7), 2
(τc=0.90, ρτ=0.7), 3 (τc=1.80, ρτ=0.7), 4 (τc=1.80, ρτ=1.1) and 5 (τc=1.80, ρτ=1.5) with Deff=9.95 µm for the five cirrus.
The black lines correspond to the IIR operational algorithm uncertainty on the effective emissivity.
0 1 2 3 4 5 6 −0.6 −0.5 −0.4 −0.3 −0.2 −0.1 0 0.1 0.2 στ 1km Δ MI 12/8 cirrus 5, R=0.65 cirrus 4, R=0.73 cirrus 3, R=0.78 cirrus 2, R=0.72 cirrus 1, R=0.41 0 1 2 3 4 5 6 −0.6 −0.5 −0.4 −0.3 −0.2 −0.1 0 0.1 0.2 στ 1km Δ MI 12/10 cirrus 5, R=0.80 cirrus 4, R=0.85 cirrus 3, R=0.91 cirrus 2, R=0.89 cirrus 1, R=0.50 (b) (a)
Figure 6. Microphysical index differences 1MI12/8 (a) and
1MI12/10(b) as a function of the standard deviation of the optical
thickness, στ1 km, for cirrus cases 1 (τc=0.45, ρτ=0.7), 2 (τc=
0.90, ρτ=0.7), 3 (τc=1.80, ρτ=0.7), 4 (τc=1.80, ρτ=1.1)
and 5 (τc=1.80, ρτ=1.5) with Deff=9.95 µm for the five cirrus.
Rrepresents the correlation coefficient between 1MI and στ1 km.
heterogeneity of the radiative field. 1εeffand 1τeffare
nega-tive, meaning that the 3-D effective emissivities and effective optical thickness are smaller than those in 1-D. Indeed, as ex-plained by Fauchez et al. (2014), heterogeneity effects lead to an increase of radiances or brightness temperatures. As ra-diances decrease with the cloud extinction, larger rara-diances lead then to smaller cloud effective emissivity and effective optical thickness. In addition, 1εeff and 1τeff are shown to
depend on the wavelength. For example, at στ1 km=1, 1εeff is equal to −0.01 at 8.65 µm, −0.03 at 10.60 µm and −0.05 at 12.05 µm. This is due to the increase of absorption from 8.65 to 12.05 µm that leads to an increase of the contrast between cloud and clear sky pixels, and thus to an increase of the PPA bias. For comparison, Garnier et al. (2012) have shown that
0 2 4 6 8 0 2 4 6 8 10 12 14 στ 1km Δ D eff, 1km ( μ m) cirrus 1 cirrus 2 cirrus 3 cirrus 4 cirrus 5
Figure 7. Errors on the retrieved effective diameter 1Deff, 1 km as a function of the standard deviation of the optical thickness,
στ1 km, for cirrus cases 1 (τc=0.45, ρτ=0.7), 2 (τc=0.90, ρτ=
0.7), 3 (τc=1.80, ρτ=0.7), 4 (τc=1.80, ρτ=1.1) and 5 (τc=
1.80, ρτ=1.5) with Deff=9.95 µm for the five cirrus. Effective
diameters are estimated using the split-window technique.
the effective emissivity error due to the retrieval method is about 0.03 for the 12.05 µm band (black lines of the Fig. 5) assuming a 1 K clear sky atmosphere temperature uncertainty for an ocean scene. This uncertainty is smaller than the av-erage error due to cloud heterogeneity 1εeff. We can note
that, at στ1 km∼1, 1εeffis equal to or larger than 0.03 for the 10.60 and 12.05 µm bands. στ1 km∼1 corresponds also to the limit where the heterogeneity effects on brightness temper-atures become larger than the IIR instrumental accuracy of 1 K (Fauchez et al., 2014).
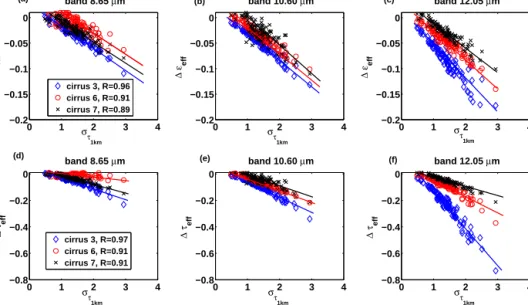
0 1 2 3 4 −0.2 −0.15 −0.1 −0.05 0 στ 1km Δ εeff band 8.65 μm cirrus 3, R=0.96 cirrus 6, R=0.91 cirrus 7, R=0.89 0 1 2 3 4 −0.2 −0.15 −0.1 −0.05 0 στ 1km Δ εeff band 10.60 μm 0 1 2 3 4 −0.2 −0.15 −0.1 −0.05 0 στ 1km Δ εeff band 12.05 μm 0 1 2 3 4 −0.8 −0.6 −0.4 −0.2 0 στ 1km Δ τeff band 8.65 μm cirrus 3, R=0.97 cirrus 6, R=0.91 cirrus 7, R=0.91 0 1 2 3 4 −0.8 −0.6 −0.4 −0.2 0 στ 1km Δ τeff band 10.60 μm 0 1 2 3 4 −0.8 −0.6 −0.4 −0.2 0 στ 1km Δ τeff band 12.05 μm (b) (c) (d) (e) (f) (a)
Figure 8. Errors on the effective emissivity 1εeff(a, b and c) and on the effective optical thickness 1τeff(d, e and f) at 8.65, 10.60 and
12.05 µm, respectively, as a function of the optical thickness standard deviation, στ1 km, for three identical cirrus fields but for different ice
crystal effective diameters: cirrus cases 3 (Deff=9.95 µm), 6 (Deff=20.09 µm) and 7 (Deff=40.58 µm), with τc=1.80 and ρτ=0.7 for
the three cirrus. R represents the correlation coefficient between 1εeff(a, b and c) and στ1 kmand between 1τeff(d, e and f) and στ1 km.
Figure 6a and b show the error on the microphysical in-dices 1MI12/8 and 1MI12/10, respectively, as a function of
στ1 km for cirrus cases 1 to 5. First note that the errors on the two microphysical indices are on average negative, ex-cept again for cirrus case 1 for 1MI12/8, and they increase with the cirrus mean optical thickness (from cirrus cases 1 to 3) and heterogeneity parameter (from cirrus cases 3 to 5). The correlation with στ1 km is better for 1MI
12/10 than
for 1MI12/8. Again, the strongest scattering in the band at 8.65 µm tends to smooth the radiative field heterogeneities and, therefore, to degrade the correlation between 1MI12/8 and στ1 km. 1MI
12/8 is, on average, larger than 1MI12/10
because the difference of absorption and effective emissiv-ity is significantly greater for the 12.05 µm / 8.65 µm pair than for 12.05 µm / 10.60 µm. Effective diameters of ice crys-tals are estimated from the microphysical indices using a LUT and are thus also impacted by heterogeneity effects. As
1MI = MI3-D−MI1-Dis negative, the impact of cloud het-erogeneities leads to an underestimation of the microphysical indices. This underestimation leads then to an overestimation of the retrieved effective diameters (smaller microphysical indices correspond to larger effective diameters).
Using the SWT, we are also able to simulate the impact of cirrus heterogeneities on the retrieved effective diameters of ice crystals. In Fig. 7, we plot the error on the effective diameter error 1Deff, 1 km, due to heterogeneities, as a
func-tion of στ1 kmfor cirrus cases 1 to 5. We see that 1Deff, 1 kmis positive and generally increases with the cirrus mean optical thickness (from cirrus cases 1 to 3) and the heterogeneity pa-rameter ρτ(from cirrus cases 3 to 5). Indeed, στ1 kmgenerally increases with τcand ρτ, as expected.
Figure 8 is the same as Fig. 5, except for different effective diameters: Deff=9.95 µm, Deff=20.09 µm and Deff=40.58 µm (cirrus cases 3, 6 and 7, respectively). Here 1εeff and 1τeff decrease with increasing Deff (except at the
8.65 µm band where $0increases between Deff=9.95 and
20.09 µm). Indeed, $0 increases with Deff (except at the
8.65 µm band) and leads to a decrease of the absorption and, thus, of the PPA bias. The impact of the effective diameter on 1εeff and 1τeff is particularly marked for the 12.05 µm
band where the absorption of ice crystals decreases strongly between Deff=9.95 µm and Deff=40.58 µm (cirrus cases 3
and 7, respectively).
In addition, we estimated the heterogeneity effects on the retrieved ice crystal effective diameters (1Deff, 1 km) for the
three Deff. On average, 1Deff, 1 km∼ +3 µm for cirrus case
3 (Deff=9.95 µm ) and 6 (Deff=20.09 µm). Thus, there
is no a significant increase of heterogeneity effects on re-trieved effective diameters between these two effective sizes. For cirrus case 7 (Deff=40.58 µm), there is no real effect
(1Deff, 1 km∼ ±0 µm) due to the saturation of the SWT.
In-deed, as noted above, effective diameters close to 40 µm lead to weak brightness temperature differences. This is illus-trated in Fig. 2, where the amplitude of arches, and thus the sensitivity, decreases with the increase of the effective diam-eter.
3.2 Heterogeneity effects due to optical and
microphysical property variabilities
As presented in Sect. 2.2, we use the parametrization devel-oped by Baran et al. (2009, 2013) and Baran (2012) to
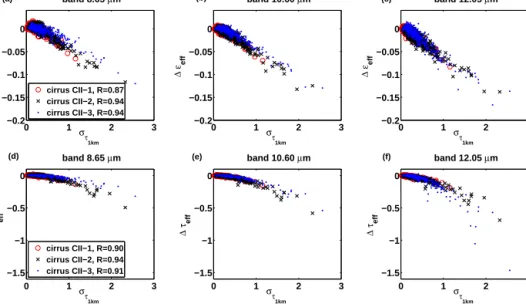
sim-0 1 2 3 −0.2 −0.15 −0.1 −0.05 0 στ 1km Δ εeff band 8.65 μm cirrus CII−1, R=0.87 cirrus CII−2, R=0.94 cirrus CII−3, R=0.94 0 1 2 3 −0.2 −0.15 −0.1 −0.05 0 στ 1km Δ εeff band 10.60 μm 0 1 2 3 −0.2 −0.15 −0.1 −0.05 0 στ 1km Δ εeff band 12.05 μm 0 1 2 3 −1.5 −1 −0.5 0 στ 1km Δ τeff band 8.65 μm cirrus CII−1, R=0.90 cirrus CII−2, R=0.94 cirrus CII−3, R=0.91 0 1 2 3 −1.5 −1 −0.5 0 στ 1km Δ τeff band 10.60 μm 0 1 2 3 −1.5 −1 −0.5 0 στ 1km Δ τeff band 12.05 μm (a) (b) (d) (e) (c) (f)
Figure 9. Errors on the effective emissivity 1εeff(a, b and c) and on the effective optical thickness 1τeff(d, e and f) at 8.65, 10.60 and
12.05 µm, respectively, as a function of the optical thickness standard deviation, στ1 km, for cirrus cases CII-1, CII-2 and CII-3.
ulate a 3-D heterogeneous cloud optical property field from the 3-D distribution of the IWC and temperature. IWC val-ues measured during the CIRCLE-2 campaign are coupled with a MLS temperature profile to generate a realistic 3-D optical property field for simulating of the CII-1 and CII-2 cirrus cases. In addition, to compare with the previous cirrus cases, the cirrus case CII-3 was generated from the CIRCLE-2 cloud field using optical properties identical to cirrus case 8.
Figure 9 shows the impact of cirrus heterogeneities on the retrieved effective emissivity and on the effective optical thickness as a function of the standard deviation of the opti-cal thickness, στ1 km, for cirrus cases CII-1, CII-2 and CII-3.
1εeffand 1τeffare similar for the three cirrus cases, although
some slight differences are evident as a function of the wave-length. Indeed, at 8.65 µm, 1εeff and 1τeff are smaller for
the CII-3 cirrus case than for the two others cirrus cases. At 10.60 µm, this difference is close to 0. At 12.05 µm, 1εeff
and 1τeff are larger for the CII-3 cirrus than for CII-1 and
CII-2 cirrus. This effect is due to the variability of the optical properties for the CII-1 and CII-2 cirrus. Indeed, cirrus case CII-3 contains only aggregate crystals of effective diameter
Deff=9.95 µm resulting from the model of Yang et al. (2001,
2005), while cirrus cases CII-1 and CII-2 contain crystal of various sizes. For CII-3 cirrus, small crystals have a single-scattering albedo maximum at 8.65 µm, leading to a lower PPA bias. At 12.05 µm, small particles are more absorbing and the PPA bias is larger. For the CII-1 cirrus, correspond-ing to the cirrus observed durcorrespond-ing the CIRCLE-2 campaign, the average effective emissivity error is within the limit of the method sensibility (Garnier et al., 2012) of about 0.03 in absolute value. 0 20 40 60 80 100 −10 0 10 20 30 40 D3Deff, 1km Δ Deff, 1km ( μ m) 0 0.5 1 1.5 −0.7 −0.6 −0.5 −0.4 −0.3 −0.2 −0.1 0 0.1 τ3D eff, 1km Δτeff, 1km band 12.05 μm cirrus CII−1 cirrus CII−2 (a) (b)
Figure 10. (a) Errors on the retrieved effective diameter
1Deff, 1 kmas a function of the effective diameter, D3-Deff, 1 km, and
(b) error on the effective optical thickness, 1τeff, 1 km, as a
func-tion of the effective optical thickness, τeff, 1 km3-D , for cirrus CII-1 and
CII-2.
To study heterogeneity effects on the retrieved ice crys-tals’ effective diameters for the CII-1 and CII-2 cirrus, we compare effective diameters Deff, 1 km3-D and D1-Deff, 1 km re-trieved from BT3-D1 km and BT1-D1 km, respectively. Deff, 1 km3-D and τeff, 1 km3-D represent the cloud optical properties resulting from a 3-D radiative transfer simulation through a heteroge-neous atmosphere (BT3-D1 km). The differences 1Deff, 1 km= D3-Deff, 1 km−Deff, 1 km1-D and 1τeff, 1 km=τeff, 1 km3-D −τeff, 1 km1-D
correspond, therefore, to the heterogeneity effects on the re-trieval of Deff, 1 km3-D and τeff, 1 km3-D . For these two cirrus, the optical properties are heterogeneous. Therefore, Fig. 10a shows 1Deff, 1 km as a function of D3-Deff, 1 km and Fig. 10b
shows 1τeff, 1 km as a function of τeff, 1 km3-D . We see that
Table 2. Deff,IIR and τIIR: averaged effective diameter and optical thickness, respectively, retrieved by IIR on 25 May 2007 during the
CIRCLE-2 campaign; D3-Deff, 1 km; and τ1 km3-D: averaged effective diameter and optical thickness, respectively, retrieved for CII-1 and CII-2
cirrus and 1D3-Deff, 1 kmand 1τeff, 1 km3-D : averaged errors on the effective diameter and optical thickness, respectively, due to cloud
hetero-geneities in absolute value and in percentage.
Cirrus Deff, IIR(µm) D3-Deff, 1 km(µm) 1Deff, 1 km3-D (µm) τIIR τeff, 1 km3-D 1τeff, 1 km3-D
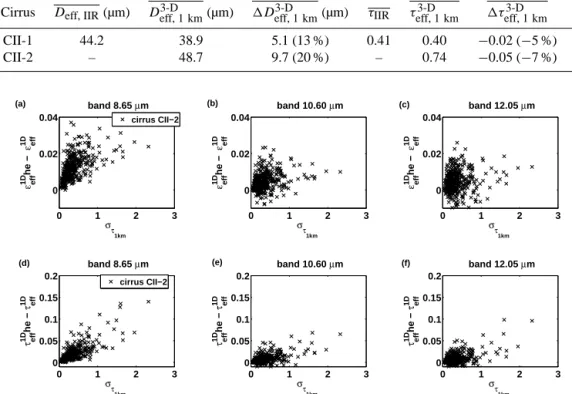
CII-1 44.2 38.9 5.1 (13 %) 0.41 0.40 −0.02 (−5 %) CII-2 – 48.7 9.7 (20 %) – 0.74 −0.05 (−7 %) 0 1 2 3 0 0.02 0.04 στ 1km ε 1D eff he − ε 1D eff band 8.65 μm cirrus CII−2 0 1 2 3 0 0.02 0.04 στ 1km ε 1D eff he − ε 1D eff band 10.60 μm 0 1 2 3 0 0.02 0.04 στ 1km ε 1D eff he − ε 1D eff band 12.05 μm 0 1 2 3 0 0.05 0.1 0.15 0.2 στ 1km τ 1D eff he − τ 1D eff band 8.65 μm cirrus CII−2 0 1 2 3 0 0.05 0.1 0.15 0.2 στ 1km τ 1D eff he − τ 1D eff band 10.60 μm 0 1 2 3 0 0.05 0.1 0.15 0.2 στ 1km τ 1D eff he − τ 1D eff band 12.05 μm (a) (b) (c) (d) (e) (f)
Figure 11. Effective emissivity differences (a, b, c) between ε1-Deff he and ε1-Deff and effective optical thickness differences (d, e, f) between
τeff1-Dhe and τeff1-Dretrieved from radiances calculated in the case of vertically heterogeneous and vertically homogeneous cloudy columns,
respectively, as a function of the standard deviation of the optical thickness στ1 km for cirrus CII-2 for bands at 8.65, 10.60 and 12.05 µm,
respectively.
Deff, 1 km3-D and τeff, 1 km3-D , respectively. Table 2 summarizes the
optical properties retrieved by IIR during CIRCLE-2 and those retrieved from our simulations as well as the esti-mated heterogeneity effects. First of all, for the CII-1 cirrus possessing the characteristics of the cirrus observed during the CIRCLE-2 campaign, the average value of the retrieved effective diameter (D3-Deff, 1 km∼38.9 µm) and the mean ef-fective optical thickness (τeff, 1 km3-D ∼0.40 at 12.05 µm) are close to those retrieved from the IIR measurements along the CALIOP/CALIPSO track (Deff, IIR=44.2 µm and τIIR=
0.41 without underlying liquid water cloud). Thus, there is a good agreement between optical properties retrieved by the IIR operational algorithm during the CIRCLE-2 campaign and those retrieved with our simulations. The mean error due to heterogeneity effects is approximately 5.1 µm (13 %) for retrieved effective diameter and approximately −0.02 (5 %) for effective optical thickness. On average, these relative er-rors due to heterogeneity effects are, thus, weak compared to the uncertainty estimate of Dubuisson et al. (2008) for the IIR retrieval (10 to 25 % for Deff, 1 kmand 10 % for τeff, 1 km).
However, at the observation pixel scale, some values can reach more than 40 % for effective diameter and 15 % for effective optical thickness, which is quite significant. Fur-thermore, errors due to cloud heterogeneities increase with the IWC or the cirrus mean optical thickness; the cirrus 2 case, for instance, with IWC twice as large as cirrus CII-1, has 1Deff, 1 km∼9.7 µm (20 %) and 1τeff, 1 km∼ −0.05
(7 %).
3.3 Influence of the vertical variability of optical properties
To find the influence of the vertical variability of cirrus opti-cal properties (σe, $0and g) on the retrieval errors, we
com-pare cloud products retrieved from BT1-D1 km with vertically heterogeneous columns with those retrieved for vertically ho-mogeneous columns obtained after a vertical averaging of the IWC, for the CII-2 cirrus case.
Figures 11 shows the effects of the vertical heterogene-ity of the optical properties on the effective emissivheterogene-ity (a, b and c) and on the effective optical thickness (d, e and f).
0 0.2 0.4 0.6 0.8 9 10 11 Altitude (km) σe(km−1) band 8.65 μm 0 0.2 0.4 0.6 0.8 9 10 11 σe(km−1) band 10.60 μm 0 0.2 0.4 0.6 0.8 9 10 11 σe(km−1) band 12.05 μm 0.39 0.4 0.5 0.6 0.7 0.80.8 10 11 Altitude (km) ϖ0 0.39 0.4 0.5 0.6 0.7 0.80.8 10 11 ϖ0 0.39 0.4 0.5 0.6 0.7 0.80.8 10 11 ϖ0 0.79 0.8 0.9 10 11 Altitude (km) g 0.7 0.8 0.9 9 10 11 g 0.7 0.8 0.9 9 10 11 g Cirrus CII 2 (c) 0.9480 0.9078 (d) (g) (h) (i) (a) (b) (e) (f) 0.6257 0.4141 0.3642 0.4355 0.9355 0.5121 0.4643
Figure 12. (a), (b) and (c): vertical variation of the mean extinction coefficient σe; (d), (e) and (f): vertical variation of the mean
single-scattering albedo $0; (g), (h) and (i): vertical variation of the asymmetry factor g for the three IIR channels at 8.65, 10.60 µm and 12.05 for
cirrus CII-2. Vertical black lines correspond to the mean value of the optical coefficient obtained after vertical averaging of the IWC.
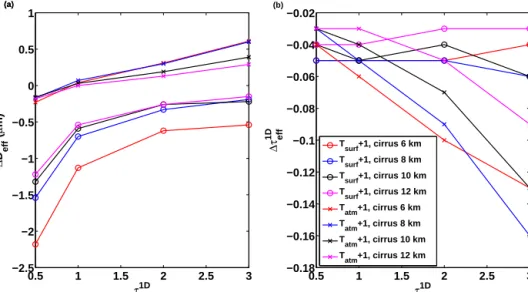
0.5 1 1.5 2 2.5 3 −2.5 −2 −1.5 −1 −0.5 0 0.5 1 τ1D eff Δ D 1D eff ( μ m) 0.5 1 1.5 2 2.5 3 −0.18 −0.16 −0.14 −0.12 −0.1 −0.08 −0.06 −0.04 −0.02 τ1D eff Δτ 1D eff T surf+1, cirrus 6 km T surf+1, cirrus 8 km T surf+1, cirrus 10 km T surf+1, cirrus 12 km T atm+1, cirrus 6 km Tatm+1, cirrus 8 km T atm+1, cirrus 10 km Tatm+1, cirrus 12 km (a) (a) (b)
Figure 13. Errors on the (a) retrieved effective diameter, 1Deff1-D, and (b) on the effective optical thickness, 1τeff1-D, as a function of τ1-Deff
due to an error of +1 K on the surface temperature (Tsurf+1) and +1 K on the atmospheric temperature profile (Tatm+1) for cirrus with top
altitudes of 6, 8, 10 and 12 km.
Here εeff1-Dhe and τeff1-Dhe are estimated from vertically het-erogeneous cloudy columns and εeff1-D and τeff1-D from ver-tically homogeneous cloudy columns, as a function of the standard deviation of the optical thickness στ1 km for the three IIR channels. Differences between retrieved products estimated from vertically heterogeneous and homogeneous cloudy columns are significantly weaker than those due to 3-D heterogeneities (horizontal and vertical heterogeneities). Furthermore, contrary to the 3-D heterogeneity effects 1εeff
and 1τeff, the differences (ε1-Deff he−εeff1-D) and (τeff1-Dhe−τeff1-D)
are positive. These effects are particular to our simulations, where vertical heterogeneities tend thus to smooth the
hor-izontal heterogeneity effects. These observations can be ex-plained with Fig. 12, which shows the vertical profiles of the optical properties of cirrus CII-2 in the vertically heteroge-neous case (red curves) and the vertically homogeheteroge-neous case (black lines) after vertical averaging of the IWC and temper-ature using the parametrization of Baran et al. (2009, 2013) and Baran (2012). In this way, values of the vertically ho-mogeneous case are different from the average of the optical coefficients of the vertically heterogeneous case: $0of the
vertically homogeneous case is larger than the vertical aver-aging of the heterogeneous case for the 10.60 and 12.05 µm bands. In addition, the asymmetry parameter g of the
verti-Table 3. Averaged errors on the retrieved cirrus optical properties due to the 3-D cloud heterogeneity for three ice crystal effective diameters
(columns 3, 4 and 5); the vertical heterogeneity of optical properties (column 6) with 1Dvhe and 1Dvho representing the −1-D radiative transfer with vertically heterogeneous and homogeneous columns, respectively; an incertitude of 1 K of the surface temperature (column
7) and the temperature atmospheric profile (column 8); and the IIR retrieval uncertainty (Dubuisson et al., 2008, column 9). 1Deff1 km and
|1Deff1 km|correspond to the absolute error in micrometers and to the relative error in percent, respectively, on the retrieval of the effective
diameter; 1τ1 kmand |1τ1 km|correspond to the absolute and relative error in percent, respectively, on the retrieval of the optical thickness.
Horizontal heterogeneity Others uncertainties
effects as a function Vertical heterogeneity surface atmosphere IIR
of Deff (1Dvhe – 1Dvho) 1 K 1 K uncertainty
στ1 km Deff(µm) 40.58 20.09 9.95 48.7 9.95 9.95 – 1 1Deff, 1 km(µm) −0.5 2.0 2.5 2 1 0.2 – |1Deff, 1 km|(%) ∼1 ∼10 ∼25 ∼4 ∼10 ∼2 ∼10 to ∼ 25 1τeff, 1 km −0.02 −0.10 −0.20 0.03 0.04 0.08 – |1τeff, 1 km|(%) ∼1 ∼6 ∼12 ∼4 ∼2 ∼4 ∼10 2 1Deff, 1 km(µm) 1 3 3 2 – – – |1Deff, 1 km|(%) ∼3 ∼15 ∼40 ∼4 – – ∼10 to ∼ 25 1τeff, 1 km −0.10 −0.20 −0.50 0.10 – – – |1τeff, 1 km|(%) ∼6 ∼12 ∼28 ∼12 – – ∼10
cally homogeneous case is larger than the average of the ver-tically heterogeneous case in the three bands. Consequently, the cirrus is less absorbent in the vertically homogeneous case and thus the effective emissivities and effective opti-cal thicknesses are weaker. This vertiopti-cal variability of optiopti-cal properties, for the cirrus CII-2 case, impact the retrieval of the effective diameter of, on average, 4 µm (figure not pre-sented here).
Note that effects of the vertical variability are discussed here for the structure of the cirrus observed during the CIRCLE-2 campaign. Effects could be different for other cir-rus structure but they are not discussed here. For example, for old cirrus, sedimentation processes could be much larger, increasing differences between the cloud top and base. The impact of the vertical variability on cloud properties retrieved from satellite observations could thus be larger.
4 Other sources of uncertainty
We show in the previous sections that heterogeneity effects can be an important source of errors in the retrieved optical properties. To compare its importance on the retrieved cloud parameters with regard to other possible error sources for IIR measurements, we test the impact of a 1 K uncertainty in the surface temperature and in the atmospheric tempera-ture profile measurements, an error that corresponds to that estimated by Garnier et al. (2012). Figure 13a and b show the error in the retrieved effective diameter (1Deff1-D) and in the retrieved effective optical thickness (1τeff1-D), respectively, as a function of τeff1-D for cirrus with a top altitude of 6, 8, 10 and 12 km. The retrieval of the effective diameter and optical thickness is performed using the SWT on 1-D radiative
trans-fer simulations. We can see that 1Deff1-Dare less than 2.5 µm (25 %) and 1τeff1-Dless than 0.16 (5 %). By comparison, these errors are in the IIR retrieval uncertainty of 10–25 % for Deff
and about 10 % for τeff(Dubuisson et al., 2008). In addition,
they are significantly smaller than those due to cloud het-erogeneity effects (more than 50 % for Deff and 10 to 15 %
for τeff). In Fig. 13a, it is evident that increasing cirrus
op-tical thickness or cloud-top altitude decreases the effective diameter retrieval error due to a 1 K surface-temperature un-certainty. In Fig. 13b, the effective diameter retrieval error due to atmospheric temperature profile uncertainty increases with increasing optical thickness because cloud emissivity also increases.
Fauchez et al. (2014) show that cloud-top altitude and ge-ometrical thickness significantly influence the heterogeneity effects because the brightness temperature contrast between the surface and the cloud top increases with increasing cloud-top altitude and decreases with increasing vertical extension for a constant cloud top (as the cloud base is closer to the surface). For retrieved cloud products estimated with an al-gorithm similar to the IIR operational alal-gorithm, the effective emissivity is independent of the cloud altitude and geomet-rical thickness; thus the impacts of altitude and geometgeomet-rical thickness on the retrieval are weak.
5 Summary and conclusions
In this paper, we discussed the impact of cirrus heterogene-ity effects in the retrieval of cloud parameters from thermal infrared radiometric measurements from space. We have fo-cused on the IIR radiometer for which the operational al-gorithm estimates the cirrus effective emissivity, the
effec-tive optical thickness and the ice crystal effeceffec-tive diame-ter of the observation pixel. We show that errors due to the cirrus heterogeneity effects on the effective emissivity and the effective optical thickness are well correlated to the sub-pixel optical thickness standard deviation στ1 km and gener-ally increase with increasing optical thickness τ1 km. These
errors are greater than the precision of the retrieval method (1εeff∼0.03) for στ1 km∼1, corresponding also to the value from which heterogeneity effects on brightness temperatures become larger than the IIR instrumental accuracy of 1 K (Fauchez et al., 2014).
Our results are summarized in Table 3. Heterogeneity ef-fects for three effective diameters are compared with the re-trieval errors caused by the vertical inhomogeneity of opti-cal properties and with the impact of an error of 1 K, cor-responding to the IIR accuracy, on the atmospheric tem-perature profile and on the surface temtem-perature. Results are shown for pixels with στ1 km=1 (medium heterogeneity) and 2 (large heterogeneity). The most important errors in the cloud optical property retrieval concern those due to the subpixel heterogeneity of the optical thickness, in particular for the smallest crystals (1Deff, 1 km=2.5 µm (∼ 25 %) and
1τeff 1 km= −0.20 (∼ 12 %) for στ1 km=1). Indeed, the
ab-sorption is larger for small crystals and, thus, the PPA bias is greater. For Deff=40.58 µm, the ice crystal optical
proper-ties in the three IIR channels converge to similar values lead-ing to smaller brightness temperature differences between channels and, thus, to a decrease of the retrieval accuracy. Errors due to the vertical inhomogeneity of the optical prop-erties, an error of 1 K on the surface temperature or atmo-spheric temperature profile are smaller than the IIR retrieval errors (Dubuisson et al., 2008). Thus, the influence of these parameters appears negligible compared to optical thickness heterogeneity and IIR retrieval uncertainty.
The impacts of cirrus heterogeneities on the retrieved cloud parameters studied in this paper are for a 1 km spa-tial resolution. These biases could decrease with an increase of the spatial resolution although photon transport effects would increase. Fauchez et al. (2014) estimate that a 250 m spatial resolution could significantly reduce the PPA bias while photon transport effects remain weak. However, het-erogeneity effects on the retrieved cloud products at this res-olution require further investigation. This study also provides ways to potentially correct the heterogeneity errors using the subpixel measurements to estimate στ1 km. Furthermore, dif-ferences between heterogeneity effects in the visible/near-infrared and thermal visible/near-infrared ranges for different spatial res-olutions also require further investigation to estimate their impact on cloud products retrieved using a combination of the visible and near-infrared/short-wave infrared and infrared retrieval methods, as proposed by Cooper et al. (2007).
Acknowledgements. The authors acknowledge the Centre National de la Recherche Scientifique, the Programme National de Télédé-tection Spatiale and the Direction Générale de l’Armement for their financial support. We also thank the use of resources provided by the European Grid Infrastructure. For more information, please re-fer to the EGI-InSPIRE paper (http://go.egi.eu/pdnon).
We thank Anthony Baran for the numerous fruitful discussions on the cirrus optical properties.
We also thank the two reviewers whose remarks largely im-proved the quality of this article.
Edited by: A. Macke
References
Baran, A. J.: From the single-scattering properties of ice crystals to climate prediction: A way forward, Atmos. Res., 112, 45–69, 2012.
Baran, A. J. and Labonnote, L.-C.: A self-consistent scattering model for cirrus. I: The solar region, Q. J. Roy. Meteorol. Soc., 133, 1899–1912, 2007.
Baran, A. J., Connolly, P. J., and Lee, C.: Testing an ensemble model of cirrus ice crystals using midlatitude in situ estimates of ice water content, volume extinction coefficient and the total solar optical depth., J. Quant Spectrosc. Ra., 110, 1579–1598, 2009. Baran, A. J., Cotton, R., Furtado, K., Havemann, S., Labonnote,
L.-C., Marenco, F., Smith, A., and Thelen, J.-C.: A self-consistent scattering model for cirrus. II: The high and low frequencies, Q. J. Roy. Meteorol. Soc., 140, 1039–1057, 2013.
Baum, B., Heymsfield, A., Yang, P., Platnick, S., King, M., Hu, Y.-X., and Bedka, S.: Bulk scattering models for the remote sensing of ice clouds. Part 1: Microphysical data and models, J. Appl. Meteor., 44, 1885–1895, 2005a.
Baum, B., Yang, P., Heymsfield, A., Platnick, S., King, M., Hu, Y.-X., and Bedka, S.: Bulk scattering properties for the remote sens-ing of ice clouds. Part II. Narrowband models, J. Appl. Meteor., 44, 1896–1911, 2005b.
Baum, B., Yang, P., Heymsfield, A., Schmitt, C., Xie, Y., Bansemer, A., Hu, Y.-X., and Zhang, Z.: Improvements in shortwave bulk scattering and absorption models for the remote sensing of ice clouds, J. Appl. Meteorol. Clim., 50, 1037–1056, 2011. Cahalan, R. F., Ridgway, W., Wiscombe, W. J., Bell, T. L., and
Snider, J. B.: The Albedo of Fractal Stratocumulus Clouds, J. Atmos. Sci., 51, 2434–2455, 1994.
Carlin, B., Fu, Q., Lohmann, U., Mace, J., Sassen, K., and Com-stock, J. M.: High cloud horizontal inhomogeneity and solar albedo bias, J. Climate, 15, 2321–2339, 2002.
Cooper, S. J., L’Ecuyer, T. S., Gabriel, P., Baran, A. J., and Stephens, G. L.: Performance assessment of a five-channel estimation-based ice cloud retrieval scheme for use over the global oceans, J. Geophys. Res.-Atmos., 112, D04207, doi:10.1029/2006JD007122, 2007.
Cornet, C., C-Labonnote, L., and Szczap, F.: Three-dimensional po-larized Monte Carlo atmospheric radiative transfer model (3DM-CPOL): 3D effects on polarized visible reflectances of a cirrus cloud, J. Quant. Spectr. Radiat. Trans., 111, 174–186, 2010.
Dubuisson, P., Giraud, V., Chomette, O., Chepfer, H., and Pelon, J.: Fast radiative transfer modeling for infrared imaging radiometry, J. Quant. Spectrosc. Ra., 95, 201–220, 2005.
Dubuisson, P., Giraud, V., Pelon, J., Cadet, B., and Yang, P.: Sensi-tivity of thermal infrared radiation at the top of the atmosphere and the surface to ice cloud microphysics, J. Appl. Meteorol. Clim., 47, 2545–2560, 2008.
Fauchez, T., Cornet, C., Szczap, F, Dubuisson, P., and Rosambert, T.: Impact of cirrus clouds heterogeneities on top-of-atmosphere thermal infrared radiation, Atmos. Chem. Phys., 14, 5599–5615, doi:10.5194/acp-14-5599-2014, 2014.
Field, P. R., Hogan, R. J., Brown, P. R. A., Illingworth, A. J., Choularton, T. W., and Cotton, R. J.: Parametrization of ice-particle size distributions for mid-latitude stratiform cloud, Q. J. Roy. Meteorol. Soc., 131, 1997–2017, 2005.
Field, P. R., Heymsfield, A., and Bansemer, A.: Snow size distribu-tion parameterizadistribu-tion for midlatitude and tropical ice clouds, J. Atmos. Sci., 64, 4346–4365, 2007.
Garnier, A., Pelon, J., Dubuisson, P., Faivre, M., Chomette, O., Pas-cal, N., and Kratz, D. P.: Retrieval of Cloud Properties Using CALIPSO Imaging Infrared Radiometer. Part I: Effective Emis-sivity and Optical Depth, J. Appl. Meteorol. Clim., 51, 1407– 1425, 2012.
Garnier, A., Pelon, J., Dubuisson, P., Yang, P., Faivre, M., Chomette, O., Pascal, N., Lucker, P., and Tim, M.: Retrieval of Cloud Prop-erties Using CALIPSO Imaging Infrared Radiometer. Part II: ef-fective diameter and ice water path, J. Appl. Meteorol. Clim., 52, 2582–2599, 2013.
Hogan, R. J. and Kew, S. F.: A 3D stochastic cloud model for inves-tigating the radiative properties of inhomogeneous cirrus clouds, Q. J. Roy. Meteorol. Soc., 131, 2585–2608, 2005.
Inoue, T.: On the temperature and effective emissivity determination of semi-transparent cirrus clouds by bi-spectral measurements in the 10-µ m window region, J. Meteorol. Soc. Jpn., 63, 88–99, 1985.
Katagiri, S., Sekiguchi, M., Hayasaka, T., and Nakajima, T.: Cir-rus cloud radiative forcing at the top of atmosphere using the nighttime global distribution with the microphysical parameters derived from AVHRR, AIP Conf., Proc. 1531, 704–707, 2013. Kato, S. and Marshak, A.: Solar zenith and viewing
geometry-dependent errors in satellite retrieved cloud optical thickness: Marine stratocumulus case, J. Geophys. Res.-Atmos., 114, D01202, doi:10.1029/2008JD010579, 2009.
Labonnote, C. L., Brogniez, G., Doutriaux-Boucher, M., Buriez, J.-C., Gayet, J.-F., and Chepfer, H.: Modeling of light scattering in cirrus clouds with inhomogeneous hexagonal monocrystals. Comparison with in-situ and ADEOS-POLDER measurements, Geophys. Res. Lett., 27, 113–116, 2000.
Liou, K. N.: Influence of Cirrus Clouds on Weather and Climate Processes: A Global Perspective, Mon. Weather Rev., 114, 1167– 1199, 1986.
Lynch, D. K., Sassen, K., Starr, D. O. C., and Stephens, G.: Cirrus, Oxford University Press, USA, 2002.
Magono, C.: Meteorological Classification of Natural Snow Crys-tals, Hokkaido University, 1966.
Marshak, A. and Davis, A. A. B.: 3D radiative transfer in cloudy atmospheres, Physics of Earth and Space Environments Series, Springer-Verlag Berlin Heidelberg, 2005.
Mayer, B.: Radiative transfer in the cloudy atmosphere, Eur. Phys. J. Conferences, 1, 75–99, 2009.
Mioche, G., Josset, D., Gaye, J. F., Pelon, J., Garnier, A., Minikin, A., and Schwarzenboeck, A.: Validation of the CALIPSO-CALIOP extinction coefficients from in situ observations in mid-latitude cirrus clouds during the CIRCLE-2 experiment, J. Geo-phys. Res.-Atmos., 115, D00H25, doi:10.1029/2009JD012376, 2010.
Nakajima, T. and King, M. D.: Determination of the optical thick-ness and effective particle radius of clouds from reflected solar radiation measurements. Part I: Theory, J. Atmos. Sci., 47, 1878– 1893, 1990.
Parol, F., Buriez, J. C., Brogniez, G., and Fouquart, Y.: Information Content of AVHRR Channels 4 and 5 with Respect to the Ef-fective Radius of Cirrus Cloud Particles, J. Appl. Meteorol., 30, 973–984, 1991.
Radel, G., Stubenrauch, C. J., Holz, R., and Mitchell, D. L.: Retrieval of effective ice crystal size in the infrared: Sensi-tivity study and global measurements from TIROS-N Opera-tional Vertical Sounder, J. Geophys. Res.-Atmos., 108, 4281, doi:10.1029/2002JD002801, 2003.
Rienecker, M. M., Suarez, M. J., Todling, R., Bacmeister, J., Takacs, L., Liu, H.-C., Gu, W., Sienkiewicz, M., Koster, R. D., Gelaro, R., Stajner, I., and Nielsen, J. E.: Technical Report Series on Global Modeling and Data Assimilation, Technical Report, 27, 2008. Sassen, K. and Cho, B. S.: Subvisual-Thin Cirrus Lidar Dataset for
Satellite Verification and Climatological Research, J. Appl. Me-teorol., 31, 1275–1285, 1992.
Sourdeval, O., Brogniez, G., Pelon, J., Labonnote, C. L., Dubuis-son, P., Parol, F., Josset, D., Garnier, A., Faivre, M., and Minikin, A.: Validation of IIR/CALIPSO Level 1 Measurements by Com-parison with Collocated Airborne Observations during CIRCLE-2 and Biscay ’08 Campaigns, J. Atmos. Oceanic Technol., CIRCLE-29, 653–667, 2012.
Starr, D. O. and Cox, S. K.: Cirrus Clouds. Part II: Numerical Exper-iments on the Formation and Maintenance of Cirrus, J. Atmos. Sci., 42, 2682–2694, 1985.
Stephens, G. L.: Radiative Properties of Cirrus Clouds in the In-frared Region, J. Atmos. Sci., 37, 435–446, 1980.
Stephens, G. L., Gabriel, P. M., and Tsay, S.-C.: Statistical radiative transport in one-dimensional media and its application to the ter-restrial atmosphere, Transport Theory Stat. Phys., 20, 139–175, 1991.
Szczap, F., Isaka, H., Saute, M., Guillemet, B., and Gour, Y.: Inho-mogeneity effects of 1D and 2D bounded cascade model clouds on their effective radiative properties, Phys. Chem. Earth Pt. B, 25, 83–89, 2000.
Szczap, F., Gour, Y., Fauchez, T., Cornet, C., Faure, T., Jourdan, O., Penide, G., and Dubuisson, P.: A flexible three-dimensional stratocumulus, cumulus and cirrus cloud generator (3DCLOUD) based on drastically simplified atmospheric equations and the Fourier transform framework, Geosci. Model Dev., 7, 1779– 1801, doi:10.5194/gmd-7-1779-2014, 2014.
Varnai, T. and Marshak, A.: Statistical analysis of the uncertainties in cloud optical depth retrievals caused by three-dimensional ra-diative effects, J. Atmos. Sci., 58, 1540–1548, 2001.
Vaughan, M. A., Powell, K. A., Kuehn, R. E., Young, S. A., Winker, D. M., Hostetler, C. A., Hunt, W. H., Liu, Z., McGill, M. J., and Getzewich, B. J.: Fully Automated Detection of Cloud and