HAL Id: hal-00298674
https://hal.archives-ouvertes.fr/hal-00298674
Submitted on 26 Apr 2006HAL is a multi-disciplinary open access
archive for the deposit and dissemination of sci-entific research documents, whether they are pub-lished or not. The documents may come from teaching and research institutions in France or abroad, or from public or private research centers.
L’archive ouverte pluridisciplinaire HAL, est destinée au dépôt et à la diffusion de documents scientifiques de niveau recherche, publiés ou non, émanant des établissements d’enseignement et de recherche français ou étrangers, des laboratoires publics ou privés.
Detecting the influence of land use changes on Floods in
the Meuse River Basin ? the predictive power of a
ninety-year rainfall-runoff relation
A. G. Ashagrie, P. J. M. de Laat, M. J. M. de Wit, M. Tu, S. Uhlenbrook
To cite this version:
A. G. Ashagrie, P. J. M. de Laat, M. J. M. de Wit, M. Tu, S. Uhlenbrook. Detecting the influence of land use changes on Floods in the Meuse River Basin ? the predictive power of a ninety-year rainfall-runoff relation. Hydrology and Earth System Sciences Discussions, European Geosciences Union, 2006, 3 (2), pp.529-559. �hal-00298674�
HESSD
3, 529–559, 2006
Detecting the influence of land use
changes A. G. Ashagrie et al. Title Page Abstract Introduction Conclusions References Tables Figures J I J I Back Close Full Screen / Esc
Printer-friendly Version Interactive Discussion
EGU
Hydrol. Earth Syst. Sci. Discuss., 3, 529–559, 2006 www.hydrol-earth-syst-sci-discuss.net/3/529/2006/ © Author(s) 2006. This work is licensed
under a Creative Commons License.
Hydrology and Earth System Sciences Discussions
Papers published in Hydrology and Earth System Sciences Discussions are under open-access review for the journal Hydrology and Earth System Sciences
Detecting the influence of land use
changes on Floods in the Meuse River
Basin – the predictive power of a
ninety-year rainfall-runo
ff relation
A. G. Ashagrie1, P. J. M. de Laat1, M. J. M. de Wit2, M. Tu1, and S. Uhlenbrook1
1
UNESCO-IHE Institute for Water Education, P.O. Box 3015, 2601 DA Delft, The Netherlands
2
Rijkswaterstaat RIZA Institute for Inland Water Management and Waste Water Treatment, P.O. Box 9072, 6800 ED Arnhem, The Netherlands
Received: 20 December 2005 – Accepted: 30 January 2006 – Published: 26 April 2006 Correspondence to: S. Uhlenbrook ([email protected])
HESSD
3, 529–559, 2006
Detecting the influence of land use
changes A. G. Ashagrie et al. Title Page Abstract Introduction Conclusions References Tables Figures J I J I Back Close Full Screen / Esc
Printer-friendly Version Interactive Discussion
Abstract
Quantifying how changes in land use affect the hydrological response at the river basin scale is a current challenge in hydrological science. A daily discharge record (1911– 2000) of the river Meuse (21 000 km2; Western Europe) has been simulated with a semi-distributed conceptual model (HBV). The model has been calibrated and
vali-5
dated with a data set for the period 1968–1998. In this study the performance of the model for the period prior to 1968 has been analysed. The observed and simulated discharge records are compared in terms of annual average discharge, summer and winter average discharge, annual maximum daily discharge, and annual maximum 10-day average discharge. The results are discussed with reference to land use change
10
(i.e. forest type change) and shortcomings of the available precipitation and discharge records.
The general agreement between the observed and simulated discharge records is good (Nash-Sutcliffe efficiency: 0.89–0.93), in particular flood volumes and the highest flood peaks are simulated well but the model has problems with the medium floods
15
(shape and peak value). However, there are some systematic deviations between the observed and simulated discharges during specific periods. The simulation result could somewhat be improved by taking the historical land use into consideration. But the systematic overestimation of the discharge for the period 1933–1968 could not be attributed to observed changes in land use. It is concluded that the overall impact of
20
land use changes in the Meuse basin is too small to be detected given the uncertainties in the available records.
1 Introduction
Research on the impact of the change of vegetation on the water balance at catch-ment scale has been subject to extensive observation and modelling across the world
25
HESSD
3, 529–559, 2006
Detecting the influence of land use
changes A. G. Ashagrie et al. Title Page Abstract Introduction Conclusions References Tables Figures J I J I Back Close Full Screen / Esc
Printer-friendly Version Interactive Discussion
EGU
changes in land use have influenced the hydrological regime of various river basins. These impacts can be significant in small basins (e.g. Jones and Grant, 1996). It is, however, more challenging to quantify the impact of land use change on the rainfall-runoff relations for large basins where the interactions between land use, climatic char-acteristics and the underlying hydrological processes are often more complex and
dy-5
namic (e.g. Uhlenbrook et al., 2001). Records of recent flooding indicate at many loca-tions worldwide the more frequent occurrence of floods likely due to climate variability where an increase in heavy precipitation might lead to an over-proportional increase in runoff due to non-linear processes. For instance due to the increased winter rainfall totals and intensities over the second half of the 20th century, signs of increased
flood-10
ing probability in many areas of the Rhine and Meuse basins have been documented (e.g. Pfister et al., 2004). It is, however, at present rather uncertain how, how much and at which temporal and spatial scale environmental changes are likely to affect the generation of storm runoff and, consequently, the flood discharge of large rivers (e.g. Bronstert et al., 2002).
15
Recently, land use change impact studies have been performed at different scales using both physically based and conceptual hydrological models. Fohrer et al. (2001) applied the physically based hydrological model SWAT to a meso-scale catchment to assess the impact of land use changes on the annual water balance and temporal runoff dynamics. It was shown that surface runoff was most susceptible to land use
20
changes. Applications of the somewhat more conceptual modelling system ArcEGMO (Lahmer et al., 2001; Kl ¨ocking and Haberlandt, 2002) to meso- and macro-scale catch-ments demonstrated relatively minor effects due to land use change in various water balance components and larger effects for water availability. Wegehenkel (2002) exam-ined the impact of afforestation and demonstrated a significant reduction in discharge
25
and an increase in evapotranspiration for a semi-humid meso-scale catchment in east-ern Germany applying a conceptual hydrological model. Using a physically based mod-elling approach (modified WaSiM-ETH model), Niehoff et al. (2002) showed clearly the influence of the land use on storm runoff generation for different types of rainfall events.
HESSD
3, 529–559, 2006
Detecting the influence of land use
changes A. G. Ashagrie et al. Title Page Abstract Introduction Conclusions References Tables Figures J I J I Back Close Full Screen / Esc
Printer-friendly Version Interactive Discussion The influence was most distinct for short, intense rainfall events and minor for longer,
less intense rainfall events in meso-scale catchments in Germany. Ott and Uhlenbrook (2004) reported similar findings. In addition, they demonstrated the effect of land use change on other water balance components (e.g. groundwater recharge/discharge) and the large impact of the temporal distribution of rainfall intensities during an event
5
on the prediction of design floods for different land use patterns.
The Meuse River basin (21 000 km2) has been experiencing severe floods in the last decade. Out of the seven largest floods recorded since 1911 at Borgharen, five of them occurred since 1993. The second and third largest floods were observed in 1993 and 1995, respectively, after the largest one recorded in 1926. Due to these recent extreme
10
floods the concern of the general public about the risk of flooding has increased. It is often suggested that these events are partly triggered by land use changes in the basin. Based on a double-mass analysis of flood volumes and precedent precipitation volumes, WL (1994) found an increase of the runoff ratio in the Meuse. Tu et al. (2005a) have shown using statistical methods that though there is a major land use change
15
since the 1950s, this alone cannot convincingly explain the more frequent occurrence of floods over the last decade. The authors found that the increase in flood peaks in the Meuse and its tributaries appears to be affected by climatic variability, particularly by the increased antecedent precipitation depths. Furthermore, Tu et al. (2005b) provided evidence of climate-induced change in the precipitation pattern in the Meuse basin
20
area over the last two decades.
Recently, several studies have been conducted on the rainfall-runoff relationship of the Meuse River basin. The effect of a changing climate on the runoff regime of the Meuse has been studied by a number of researchers (e.g. Booij, 2005; Tu et al., 2004). Using statistical methods, WL (1994) and Tu et al. (2004) found a notable decrease in
25
the annual runoff coefficient of the Meuse after 1933. Roo et al. (2000) used hydrolog-ical modelling to simulate the floods of December 1993 and January 1995. Bultot et al. (1990) have applied hydrological models to study the effect of land use change on the runoff regime of the Houille (114 km2) sub-catchment for the period of 1901–1984.
HESSD
3, 529–559, 2006
Detecting the influence of land use
changes A. G. Ashagrie et al. Title Page Abstract Introduction Conclusions References Tables Figures J I J I Back Close Full Screen / Esc
Printer-friendly Version Interactive Discussion
EGU
They showed that an increase of the area of coniferous forest results in an increase of the evapotranspiration and as a result a decrease of the discharge volume.
A continuous record for the period 1911–2000 with daily discharges (Q) is available for the Meuse at Borgharen. This station is located downstream of the Dutch-Belgian border and has an upstream area of 21 000 km2. Daily precipitation (P) and
temper-5
ature (T) records covering the period 1911–2000 are also available for a number of stations in or in the vicinity of the upstream basin. During the 20th century many land use changes have occurred within the Meuse basin. The available Q, P and T records allow for an analysis whether and how the land use changes have affected the rainfall-runoff relation. Ideally the impact of these changes should be modelled with
10
a physically based model that allows for a process-based simulation of all observed changes within the basin. However, such an approach requires a temporal and spatial resolution that is not feasible for a study that covers a period of 90 years and an area of 21 000 km2. Other shortcomings of physically based models to simulate changed circumstances are discussed for instance by Beven (1993). The conceptual
hydrolog-15
ical model used in this study (HBV) is not suited to directly analyse the impact of land use changes. However, it can be used to analyse whether the observed discharge record can be reproduced equally well through the 20th century with precipitation, tem-perature and evapotranspiration records. If this is the case it implies that the overall impact of the 20th century land use changes in the Meuse basin on the discharge at
20
Borgharen is small, or that it can be accounted for with the used conceptual approach by considering relative distributions of land use classes in 15 sub-catchments. If there exist a systematic difference between the observed and simulated discharge record this may point in the direction of changed circumstances within the basin, i.e. land use changes. However, also measurement errors, shortcomings and uncertainties of the
25
model need to be considered.
The objective of this study is to analyse whether observed fluctuations in the dis-charge regime of the Meuse can be attributed to observed fluctuations in precipitation and temperature or to land use changes. The discharge regime is assessed in terms
HESSD
3, 529–559, 2006
Detecting the influence of land use
changes A. G. Ashagrie et al. Title Page Abstract Introduction Conclusions References Tables Figures J I J I Back Close Full Screen / Esc
Printer-friendly Version Interactive Discussion of annual average discharge (AAD), summer and winter average discharge (SAD and
WAD), annual maximum daily discharge (AMaxD), and annual maximum 10-day aver-age discharge (AMaxD10). Changes that cannot be explained by the P and T fluctu-ations are further explored, with special attention to the possible impact of the large-scale change from deciduous to coniferous forest. The quality of the hydrological and
5
meteorological records (1911–2000) strongly influences the outcome of the analysis. Therefore, the analysis starts with a critical evaluation of the historical records.
2 The Meuse River basin
The Meuse (Fig. 1) is one of the largest rivers in Western Europe. It originates in France, flows through Belgium and The Netherlands and finally drains into the North
10
Sea. In this study only the part of the basin, which is situated upstream of the Dutch/Belgian border (at Borgharen), covering an area of 21 000 km2, is considered. The study area has an average elevation of 268 m a.m.s.l. ranging from 50 m a.m.s.l. at the Dutch/Belgian border to about 700 m a.m.s.l. in the Ardennes. It is situated in the humid temperate zone with almost evenly distributed precipitation throughout the
15
year. The annual average precipitation amounts to 950 mm a−1 for the period 1912– 2000. The spatial distribution of the average annual precipitation in the basin is largely controlled by the elevation. Accordingly, the largest annual precipitation is observed at the Ardennes (low-mountain range).
Unlike precipitation, evapotranspiration and air temperature show a marked
sea-20
sonal variation with high values occurring during the summer half-year. The average annual potential evapotranspiration (calculated for grass land) is 537 mm a−1, while the summer half-year (May–October) and the winter half-year (November–April) ac-count for 76% and 24%, respectively. The average annual air temperature amounts to 9◦C. The discharge regime of the river coincides with the seasonal variation in
evap-25
otranspiration. The mean annual discharge of the Meuse and its lateral canals at the Dutch/Belgian border amounts to 276 m3s−1; the winter and summer half-year mean
HESSD
3, 529–559, 2006
Detecting the influence of land use
changes A. G. Ashagrie et al. Title Page Abstract Introduction Conclusions References Tables Figures J I J I Back Close Full Screen / Esc
Printer-friendly Version Interactive Discussion
EGU
discharges are 406 m3s−1 and 146 m3s−1, respectively.
The geology of the basin can be categorized into three parts (Berger, 1992): (i) The upper basin stretching from the source to the mouth of the Chiers, called the Lotharingian Meuse, is dominated by sedimentary Mesozoic rocks. (ii) The middle basin known as the Ardennes Meuse between the mouth of the Chiers and the Dutch
5
border mainly consists of Palaeozoic rocks of the Ardennes Massif. (iii) The lower basin known as the Dutch Meuse is characterized by the Dutch and Flemish lowlands, consisting of Cenozoic unconsolidated sedimentary rocks. According to the CORINE land cover database the Meuse basin upstream of the Belgian/Dutch border comprised 34% arable land, 20% pasture, 35% forest and 9% built up areas by the end of the
10
20th century. Tu et al. (2005a) have evaluated the historical land use changes in the Meuse basin during the 20th century. The coverage of forest and agricultural land has been relatively stable. However, the forest type and forestry management practices have experienced notable changes. The percentage of deciduous/coniferous forest changed from 25%/10% in the first part of the 20th century to 19%/16% in the last part
15
of the 20th century. In addition, intensification and upscaling of agricultural practices and urbanisation are the most important land use changes in the Meuse basin in the second part of the 20th century.
3 Data sets
3.1 Discharge record 1911–2000
20
A continuous record from 1911 with daily discharge values is available for the Meuse at Borgharen (see Fig. 1). Between Monsin (conglomeration of Li `ege) and Borgharen several canals extract water from the Meuse River, partly to areas outside the Meuse basin (Fig. 2). Therefore, a record for the “undivided” Meuse River near Monsin (herein called the Monsin record) is generally taken as the reference record for hydrological
25
HESSD
3, 529–559, 2006
Detecting the influence of land use
changes A. G. Ashagrie et al. Title Page Abstract Introduction Conclusions References Tables Figures J I J I Back Close Full Screen / Esc
Printer-friendly Version Interactive Discussion canal extractions between Monsin and Borgharen (Bos, 1993). Up to 1990 these
val-ues are based on fixed annual extraction rates. After 1990 the extraction rates are based on daily measurements in the Meuse and the canals. Also for the extremely dry year 1976 a more detailed record of the extractions has been reconstructed and used for the Monsin record. It is important to realise that especially for the period prior to
5
1990 the extraction estimates are not accurate and may roughly represent the reality only on an annual basis. One would expect that more water may be extracted from the Meuse in dry periods/seasons if available, or less if not available. Application of the fixed extraction estimates might cause overestimation in the reconstructed Monsin record for dry years. It should also be mentioned that almost the entire stretch of the
10
Meuse River in the Ardennes is completely regulated with weirs. During periods of low flows, weirs are operated to maintain a minimum water level for shipping (Berger, 1992). The reconstructed Monsin record (1911–2000) has been used in this study. The influence of the above mentioned extractions and regulation is relatively small during flood events, but can cause substantial day-to-day fluctuations during low flow periods
15
that are not caused by rainfall-runoff processes.
Other points of concern are possible in-homogeneities and in-consistencies of the Borgharen discharge record. This record is based on water level measurements and a relation between water level and discharge. This relation is regularly updated in order to account for changes in the geometry of the riverbed (e.g. WL, 1994). Major changes
20
have taken place in this stretch of the river around 1930 with the construction of the Julianakanaal and the weir at Borgharen. The record is called the Borgharen record, but up to 1930 this record is based on measurements at Maastricht, a few kilometres upstream. The station has also been replaced in 1975. The impacts of these changes on the discharge record of Borgharen have been corrected. Nonetheless, these years
25
HESSD
3, 529–559, 2006
Detecting the influence of land use
changes A. G. Ashagrie et al. Title Page Abstract Introduction Conclusions References Tables Figures J I J I Back Close Full Screen / Esc
Printer-friendly Version Interactive Discussion
EGU
3.2 Meteorological records 1911–2000
Detailed records for precipitation, temperature and potential evapotranspiration are available for the Meuse but cover only the period 1968–1998 (see Leander et al., 2005). For the period prior to 1968 only data from a limited number of stations were available for this study. It concerns seven stations with daily precipitation data (see Fig. 1) and
5
five stations with daily temperature data (Table 1). It should be noted that four of the five temperature stations are located outside the Meuse basin. Nonetheless, it can be assumed that the temperature stations give a reasonable representation of tempera-ture fluctuations within the Meuse basin, since temperatempera-ture has a much smaller spatial and temporal variation than precipitation.
10
The precipitation records were tested for absolute consistency and homogeneity by detecting the presence of abrupt change points using the parametric SNHT (Alexan-dersson, 1986; Alexandersson and Moberg, 1997) and the non-parametric Pettitt test (Pettitt, 1979) at 5% significance level. Both tests suggested change points in the time series of Chimay (in 1947 and 1979) and Maredsous (in 1934 and 1979). Moreover, the
15
Pettitt test indicated a change point for Hives (in 1952). Leander and Buishand (2004) applied three homogeneity test methods, namely, cumulative sum test, Von Neumann Ratio test and SNHT to the annual totals of the seven stations for the period 1928–1998 and found similar non-homogeneity results for Hives and Chimay stations around the same period at 1% significance level. Split-record tests (Student’s t-test) were carried
20
out to test the significance of the difference in the means before and after the change point(s). The results reveal that the means of the three stations (Chimay, Maredsous and Hives) are instable. The relative consistency and homogeneity of the derived time series were also tested with the method of cumulative residuals. The cumulative resid-ual method considers that a time series of hydrological data is relatively consistent,
25
if the periodic data is proportional to an appropriate simultaneous time series, in this case the mean of other adjacent stations (Chang and Lee, 1974). Relative consistency between different stations indicates that similar mechanisms were responsible for the
HESSD
3, 529–559, 2006
Detecting the influence of land use
changes A. G. Ashagrie et al. Title Page Abstract Introduction Conclusions References Tables Figures J I J I Back Close Full Screen / Esc
Printer-friendly Version Interactive Discussion generation of the data. It also indicates that the stations are located in the same
clima-tological region. The method of cumulative residual revealed non-homogeneity at least at one time in all the times series. The time of non-homogeneity in the time series is the point at which the cumulative residual attains maximum or minimum value and lays outside the bounding ellipse for the selected confidence level.
5
The relative consistency and homogeneity of the temperature time series were also tested using the cumulative residual method. This analysis reveals that Uccle and De Bilt experienced non-homogeneities in 1921 and 1976, Karlsruhe and Paris in 1960 and Maastricht in 1945. Table 1 gives the time of non-homogeneities of the P and T records as obtained with the above-mentioned tests. The available metadata for
Maas-10
tricht reveal that the meteorological station was moved from a level of 35 m at a place in the town to a level of 2 m at a nearby airport in 1945. The time of non-homogeneity for the other P and T stations could not simply be explained by the available metadata. A visual analysis of the records revealed that all the P records except Chiny and Hives experience an upward trend. Also the T records (except for the inconsistent Maastricht
15
record) show upward trends. This observation is in agreement with the results reported by Klein Tank et al. (2002). They studied trends in indices of climate extremes on the basis of daily series of temperature and precipitation observations from more than 100 meteorological stations in Europe.
Additional meteorological data from De Bilt (located 180 km north of Borgharen) were
20
provided by the Royal Netherlands Meteorological Institute (KNMI). It concerns daily values of relative sunshine duration, wind speed, air temperatures, and relative humid-ity. The wind speed time series was corrected for changes in the height of measure-ment during the period of observation. The meteorological data were used to calculate the daily potential evapotranspiration for the period 1911–2000.
HESSD
3, 529–559, 2006
Detecting the influence of land use
changes A. G. Ashagrie et al. Title Page Abstract Introduction Conclusions References Tables Figures J I J I Back Close Full Screen / Esc
Printer-friendly Version Interactive Discussion
EGU
4 Simulation of the rainfall-runoff processes
4.1 The HBV model
The conceptual hydrological model HBV was developed in the early 1970s (Bergstr ¨om and Forsman, 1973) and has been applied in many catchments all over the world (e.g. Lindstr ¨om et al., 1997). The HBV model describes the most important runoff
5
generating processes with simple and robust structures. In the “snow routine” stor-age of precipitation as snow and snow melt are determined using a temperature-index method. The “soil routine” controls which part of the rainfall and melt water generates excess water and how much is stored in the soil and can evaporate. The “runoff genera-tion routine” consists of one upper, non-linear reservoir representing fast runoff
compo-10
nents and one lower, linear reservoir representing base flow. Runoff routing processes are simulated with a simplified Muskingum approach. HBV is a semi-distributed model and the river basin can be subdivided into sub-basins. HBV simulates the rainfall-runoff processes for each sub-basin separately. The Meuse basin upstream of Borgharen has been subdivided into 15 sub-basins. The sub-basins are interconnected within the
15
model schematisation and as such HBV can simulate discharge at the outlet.
The HBV model has been calibrated and validated using daily temperature, pre-cipitation, potential evapotranspiration and discharge data for the period 1968–1984 and 1985–1998 by Booij (2002 and 2005) and fine-tuned (with more detailed data) by Deursen (2004). The results have been evaluated in terms of volume error (VE,
20
mm a−1), coefficient of determination (r2) and Nash-Sutcliffe coefficient (RE) (Nash and Sutcliffe, 1970) for stations along the Meuse and the outlet of sub-basins with available discharge records. RE values around 0.9 were obtained, which is a quite satisfactory result. The schematisation derived from Deursen (2004) is used in this study for the model application.
HESSD
3, 529–559, 2006
Detecting the influence of land use
changes A. G. Ashagrie et al. Title Page Abstract Introduction Conclusions References Tables Figures J I J I Back Close Full Screen / Esc
Printer-friendly Version Interactive Discussion 4.2 HBV application for 1911–2000
The HBV model has been calibrated and validated with input data (P, T, Epot) from the detailed “1968–1998” data set. This implies that systematic difference between the P, T and Epotdata from the 1968–1998 and the 1911–2000 data set will result in systematic differences in the simulated output. To avoid this the period 1968–1998 has been used
5
to develop relationships for each sub-basin between the detailed P and T data and the measured P and T data from the limited number of stations. Multiple linear regression equations for the period 1968–1998 between areal precipitation/temperature of the sub-basin as dependant variable and observed point precipitation/temperature at all seven/five stations as independent variables were used to generate daily times series
10
(1911–2000) of precipitation and temperature for each of the fifteen sub-basins. Daily potential evapotranspiration values of deciduous forest, coniferous forest, grass and cereals were calculated with the evapotranspiration module of MUST, a model for unsaturated flow and evapotranspiration (De Laat and Varoonschotikul, 1996). The evapotranspiration module is based on the equation of Penman-Monteith and takes
in-15
terception losses into account. Evapotranspiration from built-up areas was taken equal to half the value computed for grass. In the absence of long time series of meteoro-logical data within the basin data from De Bilt were used. To simulate the interception evaporation most accurately the model used the areal rainfall data of the Meuse basin for its simulations. Areal evapotranspiration of the basin was then obtained as the
20
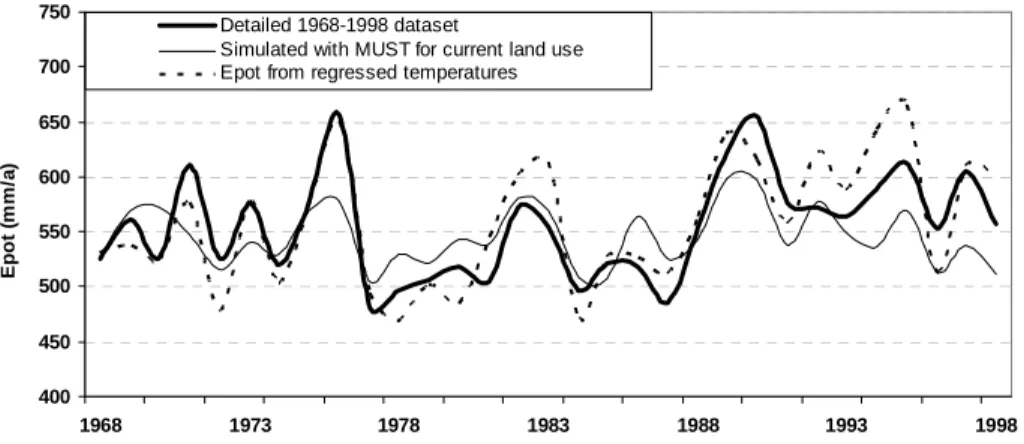
weighted mean of the simulated values for the various types of land use. A compari-son of the simulated areal evapotranspiration for the entire Meuse basin with the more detailed data set used for the period 1968–1998 shows that the averages of the annual values are very similar (data set: 555 mm a−1 and simulated: 546 mm a−1). In Fig. 3 potential evapotranspiration of the detailed 1968–1998 data set is compared with the
25
series based on Penman-Monteith (MUST application) and the potential evapotranspi-ration values estimated from the generated air temperatures in each sub-basin. The latter series as well as the detailed data set, which values are also based on air
tem-HESSD
3, 529–559, 2006
Detecting the influence of land use
changes A. G. Ashagrie et al. Title Page Abstract Introduction Conclusions References Tables Figures J I J I Back Close Full Screen / Esc
Printer-friendly Version Interactive Discussion
EGU
peratures, follow the same upward trend as observed in air temperatures since the end of the 1980s. For the simulation with the HBV model preference was given to the time series computed with MUST, because the estimated potential evapotranspiration values are based on all relevant meteorological parameters and the approach allows to make a distinction between evapotranspiration for different types of land use. To
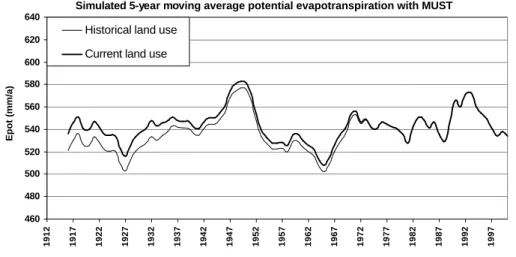
5
study the impact of the observed shift from deciduous to coniferous forest the areal po-tential evapotranspiration was computed for different weights corresponding to both the present and historical coverage of deciduous and coniferous forest. Figure 4 shows the simulated 5-year moving average values of potential evapotranspiration as calculated with MUST for both the historical and current land use. 5-year moving average values
10
were used to make difference between both data sets clearly visible.
5 Results of hydrological simulations
5.1 Performance of HBV
For the period 1968–1998 the HBV modelling results obtained with the “detailed data set” (1968–1998) can be compared with the results obtained with the “coarse” (1911–
15
2000) data set. Such a comparison will reveal to what extent the analysis is affected by a different approach to estimating the potential evapotranspiration and the limited number of P and T stations that are available for the entire period of interest (1911– 2000). The results (Table 2) indicate only small reductions in r2 and RE values. The volume errors in both cases are small. From this comparison it can be concluded that
20
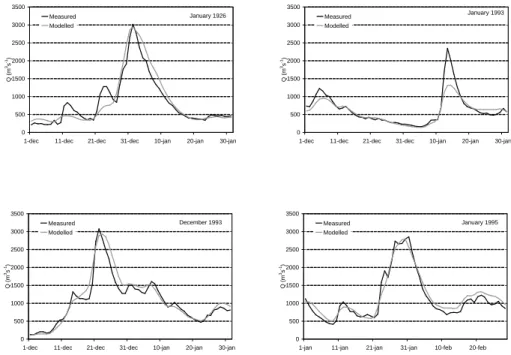
the overall performance of the HBV simulation is only slightly affected by the limited number of P and T stations, and the changed Epot. This conclusion is supported by the simulation results for the entire period (1912–2000; 1911 is used to establish the initial conditions of the model). The overall performance of the HBV model run for the period 1912–2000 is surprisingly good. Figure 5 shows the simulation result for the three
25
HESSD
3, 529–559, 2006
Detecting the influence of land use
changes A. G. Ashagrie et al. Title Page Abstract Introduction Conclusions References Tables Figures J I J I Back Close Full Screen / Esc
Printer-friendly Version Interactive Discussion 1995). Also the flood of January 1993 is shown, to illustrate that the HBV model does
not correctly reproduce all observed big floods. 5.2 Exploring changes in the discharge regime
The discharge regime has been assessed in terms of annual average discharge (AAD), summer and winter average discharge (SAD and WAD), annual maximum daily
dis-5
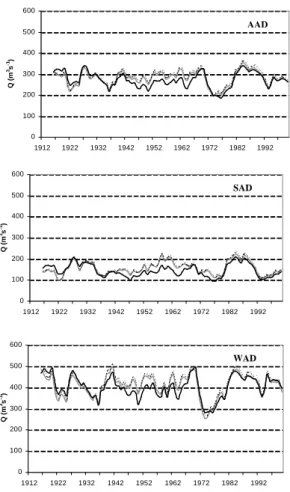
charge (AMaxD), and annual maximum 10-day average discharge (AMaxD10). Fig-ure 6 shows the simulated and observed 5-year average moving values for AAD, SAD, and WAD. There appear to be systematic differences between measured and simu-lated values for AAD, SAD, and WAD. The discharge during the period prior to 1933 is systematically underestimated, whereas the discharge during the period 1933–1968 is
10
systematically overestimated. This can be observed both for the winter and the sum-mer discharges. Two different simulations are presented in Fig. 6. The grey line gives the results for the simulation where the percentage of deciduous/coniferous forest is fixed at 19%/16% (situation end of the 20th century). The dashed line gives the re-sults of the simulation where the percentage of deciduous/coniferous forest has been
15
changed gradually from 25%/10% for the period 1911–1932, 21%/14% for the period 1933–1968, and 19%/16% for the period 1968–2000. Comparison of the two model simulations reveals that the change of forest type may only to a minor extent explain the systematic deviation in annual and seasonal discharge volumes for the period 1912– 1932, but cannot explain the systematic deviation in annual and seasonal discharge
20
volumes for the period 1933–1968.
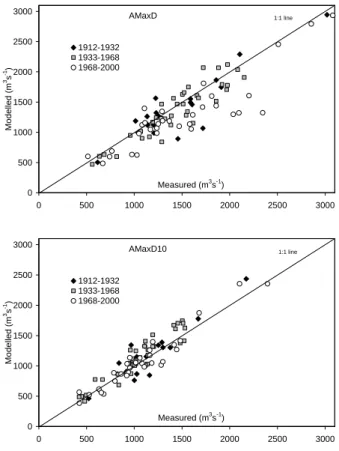
Figure 7 gives scatter plots for the simulated and observed values for AMaxD and AMaxD10. There is a tendency to underestimate the annual maximum discharge (AMaxD), in particular for the period 1968–2000. However, as shown in Fig. 5 the maximum daily discharge volumes for the largest floods are simulated well. AMaxD10
25
volumes are generally well reproduced by the HBV model. Differences of the simula-tion of AMaxD and AMaxD10 with and without a change of forest type were negligible
HESSD
3, 529–559, 2006
Detecting the influence of land use
changes A. G. Ashagrie et al. Title Page Abstract Introduction Conclusions References Tables Figures J I J I Back Close Full Screen / Esc
Printer-friendly Version Interactive Discussion
EGU
and have not been included in Fig. 7.
6 Discussion
The overall result of the hydrological simulation of the 1912–2000 discharge record is satisfactory. Especially when considering that only a limited number of P and T records were available, and in-homogeneities were noted in the Q, P, and T records. However,
5
there appear to be some systematic deviations between the observed and simulated Q record for specific periods within the 1912–2000 record. These deviations will now be discussed, with reference to land change and possible shortcomings in the available data.
The most obvious influence of land use on the water balance of a basin is on the
10
evapotranspiration process (Calder, 1993). However, statements about the impact of land use change on the evapotranspiration volume are restricted by the accuracy of the determination of historical evapotranspiration volumes. Fluctuations in the poten-tial evapotranspiration records may also be caused by variations in meteorological con-ditions, and uncertainties in the determination of evapotranspiration. The magnitude
15
of the natural annual fluctuations of Epot and the uncertainty in the estimate of Epot are illustrated in Figs. 3 and 4. The records presented in these figures illustrate that the inter-decade natural fluctuation of Epotcan be up to 50 mm·a−1(1978–1988 versus 1988–1998). These natural fluctuations are taken into account in this study, but it is obvious that the calculation of Epotintroduces uncertainties. This is partly illustrated by
20
the differences between two estimated Epotrecords for the period 1968–1998 (Fig. 3). Figure 6 illustrates that the average annual discharge volume during the period prior to 1933 is underestimated (−20 mm·a−1), whereas the average annual discharge vol-ume during the period 1933–1968 is overestimated (+40 mm·a−1). This deviation can be observed for both winter and summer discharges. The systematic underestimation
25
of the discharge volume for the period prior to 1933 is reduced by about 5 mm·a−1 in case the change in forest type is taken into account. The remaining 15 mm·a−1
(espe-HESSD
3, 529–559, 2006
Detecting the influence of land use
changes A. G. Ashagrie et al. Title Page Abstract Introduction Conclusions References Tables Figures J I J I Back Close Full Screen / Esc
Printer-friendly Version Interactive Discussion cially in the summer season) is relatively small when considering the uncertainties in
the P and Epotrecords used. Moreover, the correction factor applied to the Borgharen record amounts to approximately 30 mm·a−1 for this period (see Fig. 2). As noted be-fore this fixed correction factor is uncertain especially during low flows (such as the summer of 1921) when the extraction rate was also reduced, which could not be taken
5
into account in the Monsin record.
The deviation in the discharge volume for the period 1933–1968 cannot be explained by the change in forest type using the available data sets and methods (see Fig. 6). There is no other obvious cause related to observed land use changes in the Meuse basin to explain for this systematic deviation. Nor do the in-homogeneities reported
10
in Table 2 point in the direction that the deviation for the period 1933–1968 can be explained by in-homogeneities of the precipitation records for this period. Another pos-sible cause is the quality of the discharge record. Around 1930 several changes took place in the river near Borgharen. The impact of these changes has been accounted for in the 1912–2000 discharge record, but based on the results presented in this
anal-15
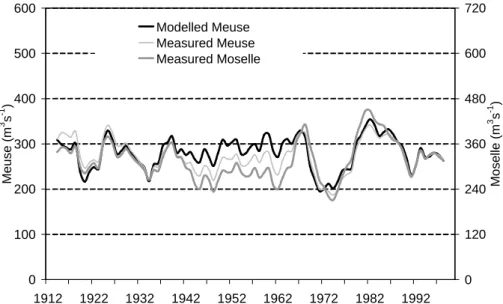
ysis one may question whether this correction was always correct. To further explore the deviation in the discharge volume for the period 1933–1968 the Monsin record has been compared with the discharge record of the Moselle at Cochem (Fig. 8). The Moselle basin neighbours the Meuse basin in the east and has comparable size and physical characteristics. It is striking that the measured Moselle record corresponds
20
very well with the simulated record for the Meuse, except for a systematic deviation for the period 1933–1968. This deviation is even larger than the deviation between the measured and modelled Meuse records. This suggests that the deviation between observed and simulated AAD for the Meuse may not be primarily caused by errors in the discharge record for Borgharen/Monsin. The real cause of this deviation requires
25
further study. A detailed analysis of the climatic input and the rainfall-runoff relation during the 20th century in the Moselle basin may help to further explore this specific observation.
underesti-HESSD
3, 529–559, 2006
Detecting the influence of land use
changes A. G. Ashagrie et al. Title Page Abstract Introduction Conclusions References Tables Figures J I J I Back Close Full Screen / Esc
Printer-friendly Version Interactive Discussion
EGU
mated by the hydrological simulations. Eberle et al. (2002) obtained a similar result from hydrological simulations with HBV for the river Moselle 1962–1997. Both Deursen (2004) and Eberle et al. (2002) calibrated HBV by optimising the Nash-Sutcliffe coeffi-cient and the volume error. Apparently this leads to an underestimation of the medium flood events (see Fig. 7, upper, and as an example the simulation of the flood event of
5
January 1993 in Fig. 5). The underestimation of AMaxD can be observed for all three sub-periods to some extent, but the number of underestimated flood events for the period 1968–2000 is largest. The simulation results for AMaxD10 show that the total volume of the flood is generally well reproduced by HBV (Fig. 7, lower). A plausible cause for the underestimation of AMaxD may be that the flood routing module of HBV
10
is insufficient. Improvement requires more detailed modelling (i.e., a finer temporal resolution, inclusion of the reservoir regulation and coupling with a hydraulic model for flood routing) for which not all required data are readily available (Leander et al., 2005). Due to these limitations the methodology applied in this study is of insufficient detail to make statements about the impact of land use change on the peak and the shape
15
of the flood wave. However, the results demonstrate that land use changes have not substantially influenced the volume of floods in the Meuse during the 20th century.
7 Conclusions
Urbanisation, intensification of agricultural practices and a shift from deciduous to conif-erous forest are the most important land use changes during the 20th century in the
20
Meuse River basin. Compared to most other rivers around the world, long and rel-atively reliable precipitation and discharge records are available for the river Meuse. This implies that the Meuse is an interesting river to analyse the overall impact of land use change on rainfall-runoff processes. The analysis presented in this paper shows that most of the variation in the observed discharge record could be explained by
vari-25
ation in the meteorological conditions. However, there also appear to be a systematic difference in the rainfall-runoff ratio for specific periods that could neither be attributed
HESSD
3, 529–559, 2006
Detecting the influence of land use
changes A. G. Ashagrie et al. Title Page Abstract Introduction Conclusions References Tables Figures J I J I Back Close Full Screen / Esc
Printer-friendly Version Interactive Discussion to land use change nor to obvious inconsistencies or in-homogeneities in the available
precipitation and discharge records. Apparently the overall impact of land use changes in the Meuse basin is too small to be detected given the uncertainties in the available records.
Acknowledgements. This study was carried out in the framework of Delft Cluster project
“As-5
sessment of the effects of land use change on the hydrology of the Meuse”. Rijkswaterstaat Direction Limburg provided the discharge data. The Royal Meteorological Institute of Belgium (KMI), kindly provided the precipitation data for the period 1911–2000. The 1968–1998 data set that has been used as a reference for this study is based on data from KMI and MeteoFrance and has been prepared by the Royal Meteorological Institute of the Netherlands (KNMI). KNMI
10
also provided the other meteorological data sets. The German federal hydrological survey (BfG) is acknowledged for providing the discharge record for Cochem-Moselle. We thank M. Booij and W. van Deursen for the HBV model schematisation of the Meuse basin.
References
Alexandersson, H.: A homogeneity test applied to precipitation data, J. Climatol., 6, 661–675,
15
1986.
Alexandersson, H. and Moberg, A.: Homogenization of Swedish temperature data. Part I: Ho-mogeneity test for linear trends, Int. J. Climatol., 17, 25–34, 1997.
Berger, H. E. J.: Flow forecasting for the river Meuse, PhD thesis, Delft University of Technology, The Netherlands, 1992.
20
Bergstr ¨om, S. and Forsman, A.: Development of a conceptual deterministic rainfall-runoff model, Nordic hydrology, 4, 147–170, 1973.
Beven, K. J.: A discussion of distributed hydrological modelling, in: Distributed Hydrological Modelling, edited by: Abbott, M. B. and Refsgaard, J. C., Kluwer Academic, Dordrecht, The Netherlands, 255–278, 1996.
25
Booij, M. J.: Appropriate modelling of climate change impacts on river flooding, PhD thesis, Wageningen University, Wageningen, The Netherlands, 2002.
Booij, M. J.: Impact of climate change on river flooding assessed with different spatial model resolutions, J. Hydrol., 303, 176–198, doi:10.1016/j.hydrol.2004.07.013, 2005.
HESSD
3, 529–559, 2006
Detecting the influence of land use
changes A. G. Ashagrie et al. Title Page Abstract Introduction Conclusions References Tables Figures J I J I Back Close Full Screen / Esc
Printer-friendly Version Interactive Discussion
EGU
Bos, H.: Verloop daggemiddelde afvoer Borgharen, periode 1911–1991 (in Dutch), RIZA werk-document 92.112X, RIZA, Lelystad, The Netherlands, 1993.
Bronstert, A., Niehoff, D., and Burger, G.: Effects of climate and landuse change on storm runoff generation: present knowledge and modelling capabilities, Hydrol. Processes, 16, 509–529, 2002.
5
Bultot, F., Dupriez, G. L., and Gellens, G.: Simulation of land use changes and impacts on the water balance – a case study for Belgium, J. Hydrol., 114, 327–348, 1990.
Calder, I. R.: Hydrologic effects of land use change, in: Handbook of Hydrology, edited by: Maidment, D. R., McGraw-Hill, New York, 13.1–13.50, 1993.
Chang, M. and Lee, R.: Objective Double-Mass Analysis, Water Resour. Res., 6, 1123–1126,
10
1974.
De Laat, P. J. M. and Varoonchotikul, P.: Modelling Evapotranspiration of Dune Vegetation, in: Surface-Water Hydrology, edited by: Singh, V. P. and Kumar, B., Kluwer, 1, 19–27, 1996. de Roo, A. P. J., Wesseling, C. G., and Van Deursen, W. P. A.: Physically based River basin
modeling within a GIS: The LISFLOOD Model, Hydrol. Processes, 14, 1981–1992, 2000.
15
Eberle, M., Buiteveld, H., Beersma, J. J., Krahe, P., and Wilke, K.: Estimation of extreme floods in the river Rhine basin by combining precipitation-runoff modelling and a rainfall genera-tor, in: Proceedings International Conference on Flood Estimation, Berne, Switzerland, 6–8 March 2002, edited by: Spreafico, M. and Weingartner, R., 459–467 CHR Report II-17, Lelystad, CHR Secretariat, The Netherlands, 2002.
20
Fohrer, N., Eckhardt, K., Haverkamp, S., and Frede, H.-G.: Applying the SWAT model as decision supporting tool for land use concepts in peripheral regions in Germany, 994–999, in: Stott, D.-E.: Sustaining the Global Farm, edited by: Mohtar, R.-H. and Steinhardt, C.-G., 10th Int. Soil Conservation Organization Meeting, 24–29 May 1999, West Lafayette, 2001. Jones, J. A. and Grant, G. E.: Peak flow responses to clear-cutting and roads in small and large
25
basins, western Cascades, Oregon, Water Resour. Res., 32(4), 959–974, 1996.
Klein Tank, A. M. G., Wijngaard, J. B., K ¨onnen, G. P., B ¨ohm, R., Demar ´ee, G., Gocheva, A., Mileta, M., Pashiardis, S., Hejkrlik, L., Kern-Hansen, C., Heino, R., Bessemoulin, P., M ¨uller-Westmeier, G., Tzanakou, M., Szalai, S., P ´alsd ´ottir, T., Fitzgerald, D., Rubin, S., Capaldo, M., Maugeri, M., Leitass, A., Bukantis, A., Aberfeld, R., van Engelen, A. F. V., Forland, E.,
30
Mietus, M., Coelho, F., Mares, C., Razuvaev, V., Nieplova, E., Cegnar, T., Antonio L ´opez, J., Dahlstr ¨om, B., Moberg, A., Kirchhofer, W., Ceylan, A., Pachaliuk, O., Alexander, L. V., and Petrovic, P.: Daily dataset of 20th century surface air temperature and precipitation series for
HESSD
3, 529–559, 2006
Detecting the influence of land use
changes A. G. Ashagrie et al. Title Page Abstract Introduction Conclusions References Tables Figures J I J I Back Close Full Screen / Esc
Printer-friendly Version Interactive Discussion
the European Climate Assessment, Int. J. Climatol., 22, 1441–1453, 2002.
Kl ¨ocking, B. and Haberlandt, U.: Impact of land use changes on water dynamics – a case study in temperate meso and macro scale river basins, Phys. Chem. Earth, 27(9–10), 619–629, 2003.
Lahmer, W., Pf ¨utzner, B., and Str ¨obl, B.: Possible Impacts of Climate and Land Use Changes
5
on the Water Balance of Semi-arid German River Basins, 19th European Regional ICID Conference on Sustainable Use of Land and Water, Brno and Prague, Czech Republic, 4–8 June 2001 (CD-ROM), 2001.
Leander, R. and Buishand, A.: Rainfall Generator for the Meuse Basin: Inventory and ho-mogeneity analysis of long daily precipitation records, KNMI-publication 196-II, De Bilt, The
10
Netherlands, 2004.
Leander, R., Buishand, A., Aalders, P., and de Wit, M. J. M.: Estimation of extreme floods of the River Meuse using a stochastic rainfall generator and rainfall-runoff modeling, Hydrol. Sci. J., 50(6), 1089–1103, 2005.
Lindstr ¨om, G., Johansson, B., Persson, M., Gardelin, M., and Bergstr ¨om, S.: Development and
15
test of the distributed HBV-96 hydrological model, J. Hydrol., 201, 272–288, 1997.
McGulloch, J. S. G. and Robinson, M.: History of forest hydrology, J. Hydrol., 150, 189–216, 1993.
Nash, J. E. and Sutcliffe, J. V.: River flow forecasting through conceptual models, Part I – A discussion on principles, J. Hydrol., 10, 282–290, 1970.
20
Niehoff, D., Fritsch, U., and Bronstert, A.: Land use impacts on storm-runoff generation: scenar-ios of land-use change and simulation of hydrological response in a meso-scale catchment in SW-Germany, J. Hydrol., 267(1–2), 80–93, 2002.
Ott, B. and Uhlenbrook, S.: Quantifying the impact of land use changes at the event and seasonal time scale using a process-oriented catchment model, Hydrol. Earth Syst. Sci., 8,
25
62–78, 2004.
Pettitt, A. N.: A non-parametric approach to the change-point problem, Appl. Stat., 28(2), 126– 135, 1979.
Pfister, L., Kwadijk, J., Musy, A., Bronstert, A., and Hoffmann, L.: Climate change, Land use change and runoff prediction in the Rhine – Meuse basins, River Res. Appl., 20, 229–241,
30
2004.
Tu, M., Hall, M. J., de Laat, P. J. M., and de Wit, M. J. M.: Detection of long-term changes in precipitation and discharge in the Meuse basin, in: GIS and Remote Sensing in Hydrology,
HESSD
3, 529–559, 2006
Detecting the influence of land use
changes A. G. Ashagrie et al. Title Page Abstract Introduction Conclusions References Tables Figures J I J I Back Close Full Screen / Esc
Printer-friendly Version Interactive Discussion
EGU
Water Resour. Environ., Proceedings of ICGRHWE held at the three Gorges Dam, China, IAHS Publ., 289, 2004.
Tu, M., Hall, M. J., de Laat, P. J. M., and de Wit, M. J. M.: Extreme floods in the Meuse river over the past century: aggravated by land-use changes?, Phys. Chem. Earth, Parts A/B/C 30(4–5), 267–276, 2005a.
5
Tu, M., de Laat, P. J. M., Hall, M. J., and de Wit, M. J. M.: Precipitation variability in the Meuse basin in relation to atmospheric circulation, Water Sci. Technol., 51(5), 5–14, 2005b.
Uhlenbrook, S., Mc Donnell, J., and Leibundgut, C.: Foreword to the special issue: Runoff generation and implications for river basin modelling, Freiburger Schriften zur Hydrologie, 13, 4–13, 2001.
10
van Deursen, W.: Calibration HBV model Meuse, Report to Rijkswaterstaat RIZA, Carthago Consultancy, Rotterdam (in Dutch), 2004.
Wegehenkel, M.: Estimating of impact of land use changes using the conceptual hydrological model THESEUS – a case study, Phys. Chem. Earth, 27, 631–640, 2002.
WL.|Delft Hydraulics: Onderzoek Watersnood Maas: Deelrapport 4, Hydrologische aspecten
15
HESSD
3, 529–559, 2006
Detecting the influence of land use
changes A. G. Ashagrie et al. Title Page Abstract Introduction Conclusions References Tables Figures J I J I Back Close Full Screen / Esc
Printer-friendly Version Interactive Discussion
Table 1. Stations with precipitation (P) and temperature (T) records (1911–2000) used in this
study.
Station name Latitude Longitude Altitude Variable Source Time of (m) non-homogeneity Maredsous 501 712 044 603 222 P KMI 1938, 1965 Rochefort 501 034 051 328 193 P KMI 1927 Thimister 503 915 055 148 266 P KMI 1951, 1969 Stavelot 502 322 055 534 300 P KMI 1937, 1994 Hives 500 905 053 450 400 P KMI 1944 Chimay 495 852 042 034 318 P KMI 1947 Chiny 494 419 052 045 370 P KMI 1932, 1986 Uccle 504 800 042 100 100 T KMI 1921 Paris 484 924 022 012 75 T MeteoFrance 1960 Karlsruhe 490 100 082 300 114 T DWD 1960 De Bilt 520 605 051 112 2 T KNMI 1976 Maastricht 505 034 054 024 114 T KNMI 1945
HESSD
3, 529–559, 2006
Detecting the influence of land use
changes A. G. Ashagrie et al. Title Page Abstract Introduction Conclusions References Tables Figures J I J I Back Close Full Screen / Esc
Printer-friendly Version Interactive Discussion
EGU Table 2. Performance of the HBV model (at Monsin) using different input data sets.
Period Criteria Detailed data set Coarse data set 1968–1984 r2(–) 0.92 0.90 RE (–) 0.91 0.90 VE (mm a−1) 22 11 1985–1998 r2(–) 0.94 0.93 RE (–) 0.93 0.93 VE (mm a−1) 9 5 1912–2000 r2(–) 0.91 RE (–) 0.89 VE (mm a−1) 12
HESSD
3, 529–559, 2006
Detecting the influence of land use
changes A. G. Ashagrie et al. Title Page Abstract Introduction Conclusions References Tables Figures J I J I Back Close Full Screen / Esc
Printer-friendly Version Interactive Discussion Figure 1
Fig. 1. Location of the Meuse river basin including the discharge and precipitation gauging
HESSD
3, 529–559, 2006
Detecting the influence of land use
changes A. G. Ashagrie et al. Title Page Abstract Introduction Conclusions References Tables Figures J I J I Back Close Full Screen / Esc
Printer-friendly Version Interactive Discussion EGU Figure 2 0 15 30 45 60 75 90 1912 1922 1932 1942 1952 1962 1972 1982 1992 Extraction (mm a -1 ) 0 10 20 30 40 50 60 Extraction (m 3 s -1 )
HESSD
3, 529–559, 2006
Detecting the influence of land use
changes A. G. Ashagrie et al. Title Page Abstract Introduction Conclusions References Tables Figures J I J I Back Close Full Screen / Esc
Printer-friendly Version Interactive Discussion 400 450 500 550 600 650 700 750 1968 1973 1978 1983 1988 1993 1998 Ep ot ( m m /a ) Detailed 1968-1998 dataset
Simulated with MUST for current land use Epot from regressed temperatures
Corrections for the proof of the paper by Ashagrie et al. (2006), HESSD
1) Updated references:
Booij, M.J.: Impact of climate change on river flooding assessed with different spatial model resolutions, J. Hydrol., 303, 176–198, 2005.
Klein Tank, A. M. G., Wijngaard, J. B., Können, G. P., Böhm, R., Demarée, G., Gocheva, A., Mileta, M., Pashiardis, S., Hejkrlik, L., Kern-Hansen, C., Heino, R., Bessemoulin, P., Müller-Westmeier, G., Tzanakou, M., Szalai, S., Pálsdóttir, T., Fitzgerald, D., Rubin, S., Capaldo, M., Maugeri, M., Leitass, A., Bukantis, A., Aberfeld, R., van Engelen, A.F.V., Forland, E., Mietus, M., Coelho, F., Mares, C., Razuvaev, V., Nieplova, E., Cegnar, T., Antonio López, J., Dahlström, B., Moberg, A., Kirchhofer, W., Ceylan, A., Pachaliuk, O., Alexander, L. V. and Petrovic, P.: Daily dataset of 20th century surface air temperature and precipitation series for the European Climate Assessment, Int. J. Climatol, 22, 1441-1453, 2002.
WL|Delft Hydraulics: Onderzoek Watersnood Maas: Deelrapport 4. Hydrologische aspecten (in Dutch), Delft Hydraulics, Delft, The Netherlands, 1994.
2) The unit should be (mm a-1) instead of (mm yr-1) at
- page 11, line 21;
- Page 15 middle to bottom and page 16 top;
- Table 2; and
- Figure caption of figure 4:
3) page 10: Leander et al. 2005 instead of 2006 4) page 20: Booij (2005) p. 176-198
5) page 26: Figure caption: derived from three (instead of two) different methods 6) page 26: new figure 3 (only the labels were updated)
Fig. 3. Comparison of calculated potential evapotranspiration derived from three different
HESSD
3, 529–559, 2006
Detecting the influence of land use
changes A. G. Ashagrie et al. Title Page Abstract Introduction Conclusions References Tables Figures J I J I Back Close Full Screen / Esc
Printer-friendly Version Interactive Discussion
EGU Figure 4
Simulated 5-year moving average potential evapotranspiration with MUST
460 480 500 520 540 560 580 600 620 640 1912 1917 1922 1927 1932 1937 1942 1947 1952 1957 1962 1967 1972 1977 1982 1987 1992 1997 Epot (mm/a)
Historical land use Current land use
Fig. 4. Simulated 5-year moving average potential evapotranspiration (mm a−1) calculated with the MUST model.
HESSD
3, 529–559, 2006
Detecting the influence of land use
changes A. G. Ashagrie et al. Title Page Abstract Introduction Conclusions References Tables Figures J I J I Back Close Full Screen / Esc
Printer-friendly Version Interactive Discussion Figure 5 0 500 1000 1500 2000 2500 3000 3500
1-dec 11-dec 21-dec 31-dec 10-jan 20-jan 30-jan
Q (m 3s -1) Measured Modelled January 1926 0 500 1000 1500 2000 2500 3000 3500
1-dec 11-dec 21-dec 31-dec 10-jan 20-jan 30-jan
Q (m 3s -1) Measured Modelled January 1993 0 500 1000 1500 2000 2500 3000 3500
1-dec 11-dec 21-dec 31-dec 10-jan 20-jan 30-jan
Q (m 3s -1) Measured Modelled December 1993 0 500 1000 1500 2000 2500 3000 3500
1-jan 11-jan 21-jan 31-jan 10-feb 20-feb
Q (m 3s -1) Measured Modelled January 1995
HESSD
3, 529–559, 2006
Detecting the influence of land use
changes A. G. Ashagrie et al. Title Page Abstract Introduction Conclusions References Tables Figures J I J I Back Close Full Screen / Esc
Printer-friendly Version Interactive Discussion EGU Figure 6 0 100 200 300 400 500 600 1912 1922 1932 1942 1952 1962 1972 1982 1992 Q (m 3s -1) AAD 0 100 200 300 400 500 600 1912 1922 1932 1942 1952 1962 1972 1982 1992 Q (m 3s -1) SAD 0 100 200 300 400 500 600 1912 1922 1932 1942 1952 1962 1972 1982 1992 Q (m 3s -1) WAD
Fig. 6. Simulated and observed 5-year average moving values for AAD, SAD, and WAD (m3s−1). Black line is measured, grey line is modelled with forest type end of 20th century, and dashed line is modelled including a gradual change of forest type during the 20th century.
HESSD
3, 529–559, 2006
Detecting the influence of land use
changes A. G. Ashagrie et al. Title Page Abstract Introduction Conclusions References Tables Figures J I J I Back Close Full Screen / Esc
Printer-friendly Version Interactive Discussion Figure 7 0 500 1000 1500 2000 2500 3000 0 500 1000 1500 2000 2500 3000 Measured (m3s-1) Modelled (m 3s -1) 1912-1932 1933-1968 1968-2000 AMaxD 1:1 line 0 500 1000 1500 2000 2500 3000 0 500 1000 1500 2000 2500 3000 Measured (m3 s-1 ) Modelled (m 3s -1) 1912-1932 1933-1968 1968-2000 AMaxD10 1:1 line
Fig. 7. Simulated and observed values for annual maximum daily and 10-day discharge
HESSD
3, 529–559, 2006
Detecting the influence of land use
changes A. G. Ashagrie et al. Title Page Abstract Introduction Conclusions References Tables Figures J I J I Back Close Full Screen / Esc
Printer-friendly Version Interactive Discussion EGU
Figure 8
0 100 200 300 400 500 600 1912 1922 1932 1942 1952 1962 1972 1982 1992 Meuse (m 3 s -1 ) 0 120 240 360 480 600 720 Moselle (m 3 s -1 ) Modelled Meuse Measured Meuse Measured MoselleFig. 8. Simulated (Meuse) and observed (Meuse and Moselle) 5-year moving average for AAD