HAL Id: hal-00299215
https://hal.archives-ouvertes.fr/hal-00299215
Submitted on 14 Jul 2005
HAL is a multi-disciplinary open access
archive for the deposit and dissemination of
sci-entific research documents, whether they are
pub-lished or not. The documents may come from
teaching and research institutions in France or
abroad, or from public or private research centers.
L’archive ouverte pluridisciplinaire HAL, est
destinée au dépôt et à la diffusion de documents
scientifiques de niveau recherche, publiés ou non,
émanant des établissements d’enseignement et de
recherche français ou étrangers, des laboratoires
publics ou privés.
monument in Central Japan: field monitoring and
laboratory simulation
C. Thomachot, N. Matsuoka, N. Kuchitsu, M. Morii
To cite this version:
C. Thomachot, N. Matsuoka, N. Kuchitsu, M. Morii. Frost damage of bricks composing a railway
tunnel monument in Central Japan: field monitoring and laboratory simulation. Natural Hazards and
Earth System Science, Copernicus Publications on behalf of the European Geosciences Union, 2005,
5 (4), pp.465-476. �hal-00299215�
Natural Hazards and Earth System Sciences, 5, 465–476, 2005 SRef-ID: 1684-9981/nhess/2005-5-465
European Geosciences Union
© 2005 Author(s). This work is licensed under a Creative Commons License.
Natural Hazards
and Earth
System Sciences
Frost damage of bricks composing a railway tunnel monument in
Central Japan: field monitoring and laboratory simulation
C. Thomachot1, N. Matsuoka1, N. Kuchitsu2, and M. Morii2
1Graduate School of Life and Environmental Sciences, Division of Geoenvironmental Sciences, University of Tsukuba,
Ibaraki 305-8572, Japan
2National Research Institute for Cultural Properties, 13-43 Ueno Park, Tauto-ku, Tokyo, 110-8713, Japan
Received: 15 December 2004 – Revised: 30 May 2005 – Accepted: 4 June 2005 – Published: 14 July 2005
Abstract. Bricks of tunnels and bridges of Usui Pass railway
(Japan) exposed to north are subject to frost damage. Aver-age depth of erosion due to detachment of angular blocks is around 1–1.5 cm. In order to assess this weathering and to understand its mechanism, an experimental study was car-ried out in the field and laboratory. Field monitoring showed the combination of seasonal and diurnal freezing with a max-imum of heave when the freezing front reached 5 cm depth. Bricks taken from the site were submitted to unidirectional freezing at capillary and vacuum saturation in the laboratory. Results showed that frost damage of bricks was favoured by high saturation level and repetition of freeze-thaw cycles.
1 Introduction
The historical site of Usui Pass Railway Facilities (Gunma prefecture, 100 km NW of Tokyo, Japan) is an 11.2 km long railway (7.0-miles) made of tunnels and bridges built in bricks in 1893 and linking Tokyo and Nagano (Smith, 1997). Many historical buildings and bridges were built in bricks at that time: Tokyo station (1914), Yokohama’s red brick ware-houses (1908), Biwa aqueduct in Kyoto (1890), Hokkaido government office building (1911) (Ito and Chiba, 2001). Bricks of Usui Pass were made in the Nihon Brick Corpo-ration, one of the oldest brick companies in Japan. When the railway was used, tunnels were equipped with doors at each entrance and exit. As trains were not running during the night, tunnels were closed to protect them from bad weather. In 1963, the building of a bypass railway meant the closure of this section but since then, these structures have been con-served as a heritage. At that time, doors of the tunnels were removed and tunnels were not kept anymore.
In 1994, these structures were registered as an important cultural property by the Japanese government and a pro-gram of rehabilitation of the railway as a tourist site started. Correspondence to: C. Thomachot
(celine@atm.geo.tsukuba.ac.jp)
But bricks showed important and fast weathering that could be prejudicial to the conservation of the site. In the tun-nels, bricks were entirely covered with suits accumulated during the use of the railway. The bricks of the south-facing walls showed cavernous weathering features possibly resulting from salt weathering, while the north-facing walls showed weathering that could be attributed to frost action (Fig. 1). Indeed, a preliminary study showed that angular flake detachments 1–6 cm thick occurred during winter. The purpose of this study was to understand this weathering and ultimately to prevent it. Thus, field monitoring started in win-ter 2003. It was connected to laboratory experiments which intended to reproduce what was noticed in the tunnels, to understand which factor prevailed, how porous network in-fluenced location of cracking and when cracking occurred.
The climate condition at the tunnel (600 m a.s.l.) was es-timated from meteorological data at the nearest weather sta-tion in Karuizawa (5 km west of the tunnel, 999 m a.s.l.). A combination of the long-term mean air temperatures (1971– 2000) at the station (Japan Meteorological Agency, 2005) and a lapse rate of 6.25◦C km−1suggested that the tunnel ex-periences mean annual temperature of 10.4◦C, mean coldest month (January) temperature of −1.1◦C and mean warmest month (August) temperature of 22.8◦C. Freeze-thaw and frost days occur frequently between December and Febru-ary. Snow falls also during the three months, leading to a maximum depth of 26 cm in February at the station. Annual precipitation is about 1200 mm, 75% of which falls between May and October. Although winter at the study site is rather dry, seepage through fissures in the bedrock keep the tunnel wall humid.
2 Frost damage
Frost action is known as an important factor of weathering (Hirschwald, 1912; Thomas, 1938). At a macroscopic scale, frost action is responsible for all shiverings, flakings and ge-lidisjunctions (Letavernier, 1984). Frost weathering is not
28
Fig. 1. Weathered walls of one of the tunnels of Usui Pass railway. (a) Bricks of north-facing walls are fractured by frost action. (b)
Bricks of south-facing walls are weathered by salt efflorescence.
due to isolated factors (Cady, 1969). Freezing processes de-pend on the porous network of the material (pore structures, transfer and mechanical properties), the moisture regime (de-gree of saturation, water supplied during the freezing), and the freezing conditions (Freezing intensity, rate and dura-tion). Cracking occurs when stresses due to freezing override the medium rupture resistance.
To assess frost action on material, a variety of direct and infirect methods are used. Direct methods are quali-tative (e.g. visual description, fragment study, microscopy or holography) or quantitative (e.g. weight loss, dilatome-try, volume changes or mercury porosimetry). Indirect meth-ods measure the variation (usually a decrease) of one phys-ical parameter that depends on the structure of the material (e.g. P wave velocity, resonance frequency, elasticity, me-chanical strength, capillary absorption). A threshold value, below which damage happens, is thus determined.
Frost resistance scales result from experimental measure-ment and are seldom reliable. Indeed, they are based on one particular protocol that may be different from natural con-ditions and often emphasizes one factor. Moreover, these scales are most often based on the study of a type of ma-terial (especially calcareous rocks: Letavernier, 1984; Remy, 1993).
Dilation studies on rocks submitted to frost action ini-tiated by Thomas (1938) and followed by Fahey and Dagesse (1984), Pissart and Lautridou (1984), Mat-suoka (1988), Weiss (1992), Prick (1995) and Thoma-chot (2002), have contributed to show the importance of wetting-drying phenomena and to minimize the effect of freezing in weathering mechanisms.
Causes of dilation of materials can be:
1. Temperature variations (thermal dilation): materials contract when temperature decreases and expand when temperature increases (e.g. Hall, 1999);
2. Moisture variations (hydric expansion caused by cap-illary pressures): expansion will particularly increase if
the material is composed of swelling minerals like clays (e.g. Matsukura and Yatsu, 1980);
3. Water freezing: expansion of ice which is about 9% and ice segregation can create direct and indirect pressures on the porous network and induce expansion or con-traction of the material (e.g. Powers and Helmuth, 1953; Everett, 1961; Powers, 1945).
During freezing of rocks, all these causes combine to di-late or contract the material.
Dilation will depend on the properties of the material (mineralogical composition, porous network, transfer prop-erties and tensile strength: Hirschwald, 1912) and climatic conditions such as water availability and the rate and inten-sity of freezing. Regarding the water availability, it has been shown for a long time that high saturation causes larger ex-pansion (Thomas, 1938). When a porous network is partly saturated, some trapped porosity remains occupied by air. Ice can extrude toward these trapped pores without creating any pressure on the porous medium. Critical saturation, below which dilation due to crystallization of ice is insignificant, depends on materials. For concrete and limestone, critical saturation is around 70% of total porosity (Mamillan, 1967), for brick it is 90% (Dietzel and Wiesner-Kieffer, 1953) but for rocks in general, it is between 65 and 100% (Matsuoka, 2001).
If the material is supplied with water during freezing, it can lead to different behaviours. Because of migration of unfrozen water during freeze and thaw, the presence of water supply is important (Matsuoka, 1990). For some rocks with high transfer properties like tuff and sandstone, expansion is higher when there is water supply. Saturation increases in the course of cycles (Aubry and Lautridou, 1974). These rocks are more sensitive to water migration than to ice expansion.
On the other hand, for rocks with low transfer properties like schist and andesite, expansion is higher when there is no water supply. In these rocks where water migration is low, ice expansion is the main cause of weathering (Matsuoka, 1990). Furthermore, high freezing rate causes high expansion (Mat-suoka, 1990; Weiss, 1992). And if a sample is maintained at a constant negative temperature, contraction occurs due to plastic deformation (Matsuoka, 1990), pressure melting of ice under pressure (Thomas, 1938), thermal contraction (Weiss, 1992) and/or migration of unfrozen water from the micropores to the trapped macropores (Prick, 1995; Pissart and Lautridou, 1984).
A dilation method was chosen for this study because it is a direct method that measures at the same time, water, vapour and ice movements.
3 Material
Samples of bricks were collected from the study site and sub-mitted to frost experiments. They were original bricks stored inside the tunnel along the wall since its construction. They were first subjected to mineralogical, chemical and physical
C. Thomachot et al.: Frost damage of bricks composing a railway tunnel monument in Central Japan 467
29 Figure 2
Fig. 2. Scanning electronic images of the porous network of brick at different scales.
30 Figure 3
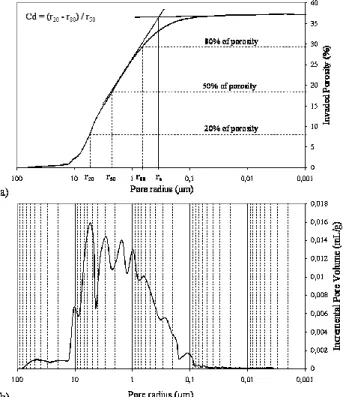
Fig. 3. Mercury porosimetry curve of brick at Usui Pass displaying
the large distribution of pores. (a) Invaded porosity curve. (b) In-cremental pore volume curve. Captions: Cd: dispersion coefficient; ra: pore threshold; r20, r50and r80: pore accesses corresponding to
the invasion of 20, 50 and 80% of the porous network.
analyses including X-Ray diffraction, X-Ray fluorescence, scanning electronic microscope (SEM), water total porosity, mercury porosimetry and capillary absorption.
3.1 Mineralogy and chemistry
Analyses by X-Ray diffraction and X-Ray fluorescence showed that bricks are composed of tridymite (high tem-perature SiO2), quartz (SiO2), hematite (Fe203), albite
(NaAlSi3O8) and anorthite ((Ca, Na)Al2Si2O8)and had no
clay minerals. 3.2 Porous network
Water total porosity was measured under vacuum. Aver-age value of total porosity is 35%. SEM showed three
31 Figure 4
Fig. 4. Absorption kinetics of brick. The 1st curve shows the weight
increase per surface unit which corresponds to the filling of the free porosity. The 2nd curve shows the migration of the wet fringe.
main scales of pores: macropores around 0.1 mm, mesopores around 10 µm and micropores around 1 µm (Fig. 2).
Mercury porosimetry (Fig. 3) was also measured on three samples of 1 cm cubes with a Micromeretics AutoPore IV 9500.
3.2.1 Method
This apparatus quantifies the total porosity and the pore access radius distribution of the material. According to the method, the pore access radius ranges from 80 µm (0.009 MPa) to 0.0018 µm (409 MPa). Thus, pores of larger access radius like the macropores of 0.1 mm diameter viewed under SEM are not taken into account.
This method also determines the pore threshold (ra) which allows the biggest part of the porous network to be filled. On the curve, the pore threshold is at the intersection of the two tangents at the top of the curve (Fig. 3a, Katz and Thompson, 1986). Spreading of the curve can be defined by the scatter coefficient (Cd) calculated from a ratio of injection pressures (Wardlaw et al., 1988; Remy, 1993):
Cd = P80−P20 P50 =r20−r80 r50 (1) where P80, P50 and P20 are the injection pressures
corre-sponding respectively to the filling of 80, 50 and 20% of the porous network. As one injection pressure corresponds to
32
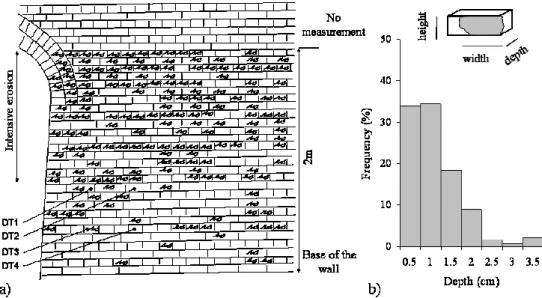
Fig. 5. Erosion mapping of a north-facing wall of the tunnel. (a) Location of erosion (DT1-4 indicate the location of displacement transducer).
Eroded bricks are marked. (b) Erosion depth frequency.
one pore radius, the scatter coefficient corresponds also to a pore radius ratio. If Cd<1, the pore distribution is concen-trated around one pore radius and the pore threshold value is significant. If Cd>1, the pore distribution is spread. It means that the porous network is partitioned in several domains of different pore sizes (Remy, 1993).
3.2.2 Results
The average total porosity determined by mercury injection was 36.9±0.9%, which was 2% higher than the water total porosity under vacuum. This was due to the difference be-tween the two techniques (Hammecker, 1995). Average pore threshold was 0.37±0.4 µm (Fig. 3a) but the scatter coeffi-cient Cdwas 2.1, indicating a spread pore distribution. Thus, in this case the pore threshold was not significant. Indeed, viewed on the curve of incremental pore volume over pore ra-dius (Fig. 3b), there was no dominant pore rara-dius but a homo-geneous zone from 0.1 to 10 µm. This confirmed the SEM observations that bricks had a large distribution of pores. 3.3 Transfer properties
Absorption kinetics of bricks was measured. 3.3.1 Method
The bottom of the samples is placed in water in a tub where relative humidity is kept constant at nearly 100% to avoid drying. The weight increase per surface unit (the first curve) and the capillary height (wet fringe which is measured by naked eye, the second curve) are plotted over the square root of time (Fig. 4), according to the Washburn law. The first curve is characterised by a two-part progression. At the be-ginning of the experiment, the weight increase curve is lin-ear and corresponds to the progressive filling of the
inter-connected pores. The slope of this curve is called the A coefficient (g cm−2h−1/2) and is relative to the weight in-crease of the sample. At the top of this first linear part, the value of weight increase indicates the free porosity. Next to this point, saturation of the porous network is slower with a weaker incline. And this corresponds to the filling of the trapped porosity by diffusion of air through water. There is more or less trapped porosity depending on the pore distribu-tion and on the nature of fluids used. The slope of the second curve, relative to the migration of the wet zone, corresponds to the B coefficient (cm h−1/2).
3.3.2 Results
Measurements showed fast absorption kinetics. B coefficient relative to the migration of the wet fringe was 15.6 cm h−1/2
and A coefficient relative to the weight increase per surface unit was 4 g cm−2h−1/2(Fig. 4). Furthermore, free porosity represented 71% of the total porosity of bricks. This showed that even if bricks had a large pore size distribution, the dis-tribution was homogeneous and the porous network was well connected.
4 Mapping of erosion
Erosion of the bricks was mapped on a part of the north-facing wall of one tunnel (2×2 m2) located 25 m from the en-trance and intensively eroded. The height, width and depth of erosion of the wall were measured to assess the relation between the size and the location of debris and also to assess changes during the winter (Fig. 5). Mapping on 21 Novem-ber 2003 showed that 30% of the surface of the wall was fractured. Most of the hollows were shallower than 2 cm (Fig. 5b). Hollows less than 12 cm in width had a height between 1 and 7.5 cm, whereas those with a width exceeding
C. Thomachot et al.: Frost damage of bricks composing a railway tunnel monument in Central Japan 469
33 Figure 6
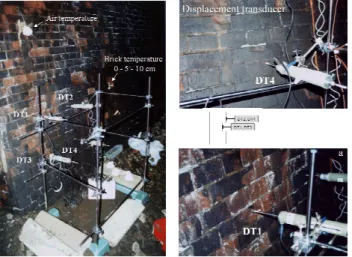
Fig. 6. Monitoring of temperature (0–5–10 cm) and dilation in the
tunnel. Displacement transducers record dilation of eroded (DT1, 3) and intact bricks (DT2, 4).
12 cm had a constant height of 7.5 cm (corresponding to the height of each brick). In this way, dimensions of bricks seemed to control the size of the hollows. Furthermore, there was no relation of the height of intensive erosion with the capillary rise from the ground (Fig. 5a), but erosion was more intensive in the upper part of the wall than in the lower part. It corresponded to the water seepage at the upper part of the wall.
5 Field monitoring
5.1 Methodology
Field monitoring of temperature and displacement of bricks started in winter 2003 to understand mechanisms of weath-ering and eventually to prevent the decay of bricks (Fig. 6). To assess changes in climatic conditions in the tunnel, cop-per and constantan thermocouples were placed in the tunnel to measure air temperature, at the surface of bricks (0 cm) and at depths of 5 and 10 cm. The precision of recorded tem-peratures was 0.1◦C. Horizontal displacement of bricks was measured with four displacement transducers placed perpen-dicular to the wall: two on eroded bricks (in a hollow) and two on intact bricks (at the surface) (Fig. 6). Both tempera-ture and displacement were recorded at 1-h-intervals in data loggers, but temperature data were missed from 12 February 2004 to 16 March 2004 at 5 and 10 cm depths. New frag-ments of bricks were collected during the winter with a box placed at the base of the wall.
5.2 Results
Air temperature records in the winter of 2003–2004 showed a combination of short seasonal freezing which were com-pleted within two weeks and repetitive diurnal freezing (Fig. 7c). During the winter, four major heave events
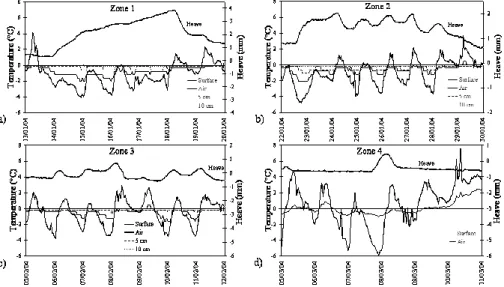
oc-34 Figure 7:
Fig. 7. Data of field monitoring from October 2003 to May 2004. (a) Dilation of eroded (DT1, 3) and intact bricks (DT2, 4) with
zones of large frost heave. Zones 1 to 4 represent significant di-lation events enlarged in Fig. 8. (b) Temperature of bricks (surface, 5 cm and 10 cm depth). (c) Air temperature.
curred (zones 1–4: Fig. 7a). All of them were associated with subzero temperatures. Regarding air temperature data, zone 1 (13 January 2004–20 January 2004) and the early part of zone 2 (22 January 2004–25 Jamuary 2004), were related to continuous freezing, whereas the later part of zone 2 (25 January 2004–30 January 2004) and zones 3 (5 Febru-ary 2004–12 FebruFebru-ary 2004) and 4 (5 March 2004–11 March 2004) were related to the repetition of diurnal freezing al-though inner parts of the bricks were nearly continuously frozen (Fig. 8). Intact bricks produced higher heave than al-ready eroded bricks (Fig. 7a). Maximum frost heave (zone 1) occurred when the freezing front reached 5 cm or deeper (Figs. 7b and 8a). During this period, heave of the two eroded bricks reached 1.1 and 1.8 mm, whereas heave of the two in-tact bricks was 2.7 and 3.7 mm. Large heave was probably due to the frost penetration that allowed the formation of ice lens at different depths of the bricks. As the wall was sup-plied with water percolating in the tunnel, maximum frost heave was also probably associated with water supply. Heave corresponding to the other zones was smaller and shorter
35
Fig. 8. Heave and air and surface temperature details for the heave zones 1–4 in Fig. 7. Temperatures at 5 and 10 cm were not recorded
during zone 4.
36 Figure 9
Fig. 9. (a) Attachment of sensors. (b) Experimental assembly.
than heave in zone 1: around 0.5 mm for the eroded bricks and 1 mm for the intact bricks.
New fragments of bricks fell mostly in the period from 12 February to 16 March, which included a warm period fol-lowing zone 3, a freezing period of zone 4 and a subsequent warm period. This implied that thaw penetration following intensive frost heave and/or diurnal frost heaving triggered the detachment of heaved blocks. The sizes of fragments, mostly 7 cm long, 5 cm wide and 1–2 cm thick, were simi-lar to the size of the mapped hollows. Thus, field monitor-ing showed that large heave corresponded to frost penetration to 5–10 cm during continuous freezing and that most of the detachments occurred during thaw penetration following the intensive frost heave and/or periods of repetition of diurnal freezing.
6 Laboratory experiments
The experiments aimed to reproduce the cracking that oc-curred in situ, to understand which factor prevailed, how the porous network influenced the location of cracking and when cracking occurred. The experiments simulated a
37
Figure 10:
Fig. 10. Attachment of sensors and corresponding zones for the
C. Thomachot et al.: Frost damage of bricks composing a railway tunnel monument in Central Japan 471
38 Figure 11:
Fig. 11. Temperature (a) and calibrated heave (b) at each depth of
a brick sample submitted to slow freezing at capillary saturation. Note that the heave scale is 2.5 larger than Fig. 10.
unidirectional freezing, since in the field condition only one surface of stones is submitted to temperature change. 6.1 Methods
In these experiments, bricks (5×5×15 cm3) were isolated in thermal insulator except for the top surface on which a Peltier cooling plate was placed to control the freezing temperature (Fig. 9). As the wall inside the tunnel was supplied with wa-ter coming from the inner upper part and thus maintained at nearly constant saturation, the bottom of samples was also submerged in water during the experiments. Thus, the exper-iments reproduced the layout of the walls of the tunnel, ex-cept that freezing progressed vertically rather than horizon-tally. The whole apparatus was placed in a cold room. Be-fore freezing, the cold room and the cooling plate were main-tained at 5◦C until thermal equilibrium was reached. During the experiment, the temperature of water at the base of the sample was kept constant at +3◦C.
Temperature and heave of the samples were measured dur-ing freezdur-ing usdur-ing thermocouples placed at different depths (at 1, 2, 4, 6, 8, 10 and 12 cm from the top) and strain gauges attached at a side surface (2, 4, 6, 8 and 10 cm) (Fig. 9). The thermocouples were horizontally installed at 2 cm from the side surface. To estimate the heave amount of the seg-ment represented by each strain gauge (2 cm), the original strain values were multiplied by 2 cm, except for the 2 cm deep gauge which represented the uppermost 3 cm segment (Fig. 10). Then total heave was computed by adding heave amount of each segment. It represented the dilation of the brick from the top to 11 cm. As the freezing front did not reach deeper than 11 cm during experiments, we assumed that computed heave was representative of the whole brick. Two samples were concurrently tested at two different initial
39 Figure 12
Fig. 12. Computed total heave of bricks and corresponding cooling
plate temperature. Bricks submitted to (a) continuous freezing. (b) to diurnal freezing.
saturations: capillary saturation (71% of the porosity was oc-cupied by water) and vacuum saturation (100% of the poros-ity was filled with water).
Two kinds of freezing regimes were chosen from air tem-perature data corresponding to the heave periods in the tun-nel (Fig. 7a): continuous freezing (zone 1 corresponding to the maximum heave: Fig. 8a) and diurnal freeze-thaw cycles (zones 3 and 4: Figs. 8c and d).
6.1.1 Continuous freezing
The average air temperature when the wall was frozen in zone 1 was about −3◦C. Thus for the continuous freezing simulation, temperature of the cooling plate was maintained at −3◦C for 3 days. Then, to assess the effect of freezing in-tensity, the cooling plate was maintained at −5◦C for 3 days and at −8◦C for 3 days. Total duration of the experiment was 9 days.
6.1.2 Diurnal freezing
Air temperature fluctuated diurnally around 0◦C during zones 3 and 4 (not more than one week), reaching a mini-mum temperature (from −2◦C to −5◦C) around 6 a.m. and a maximum temperature (from +0.5◦C to +3.5◦C) around 3 p.m. Average temperatures of a freeze-thaw cycle were from +2◦C to −3◦C. Thus, for the diurnal freezing simula-tion, bricks were submitted to 24-h freeze-thaw cycles: 4 cy-cles from +2◦C to −3◦C (average cycle) and then 4 cycles
40 Figure 13
Fig. 13. Temperature (a) and calibrated heave (b) at each depth of
a brick sample submitted to slow freezing at vacuum saturation.
from +3◦C to −5◦C (extreme cycle). Further 4 cycles from +5◦C to −8◦C were added to assess the effect of a more in-tensive freezing and to compare results with those of contin-uous freezing at −8◦C. Each freezing and thawing phase was maintained for 12 h.
Temperatures were set instantaneously. These climatic conditions simplified the field data where freezing and thaw-ing were progressive.
Two tests were performed for each type of freezing and they guaranteed the reproducibility of data; the second test of each was presented in the following.
6.2 Simulation of continuous freezing 6.2.1 Capillary saturated brick (Fig. 11)
Freezing expansion was insignificant near the surface, but slightly increased as the freezing front approached the wa-ter level (8 and 10 cm) because of higher saturation of the porous network and possible water supply by cryosuction. Pressures that could be caused by ice growth were probably relieved by the presence of air filled pores (trapped porosity) where ice could extrude and by the good transfer properties of bricks that facilitated this extrusion. The total expansion of the whole brick at the end of the experiment was computed to be 1.5 µm in total (Fig. 12a).
6.2.2 Vacuum saturated brick (Fig. 13)
First 3 days (top of sample at −3◦C): The first stage of ice growth below the cooling plate led to contraction of the brick below the freezing front. Contraction was largest (−1.65×10⁻⁴, Fig. 13b) at the shallowest strain gage (2 cm depth) and decreased with depth (−0.78×10⁻⁴at 4 cm and
−0.44×10⁻⁴ at 6 cm). Then the freezing front progressed
41 Figure 14:
Fig. 14. Layout of totally saturated brick samples at each
equilib-rium stage of continuous freezing simulation. Cooling plate at (a)
−3◦C, (b) −5◦C and (c) −8◦C.
downward and stabilised at 7 cm depth (Fig. 12a). Expan-sion of the bricks followed the migration of the freezing front 3.27×10⁻⁴ at 2 cm and 0.39×10⁻⁴ at 4 cm. At 6, 8 and 10 cm depth, below the final freezing front, only contraction occurred.
Next 3 days (top of sample at −5◦C): The freezing front further progressed to 9 cm depth. Significant expansion oc-curred at 6, 8 and 10 cm depth. No additional expansion hap-pened at 2 cm depth.
Final 3 days (top of sample at −8◦C): The freezing front progressed to 11 cm. Expansion occurred at 8 and 10 cm depth.
Figure 14 illustrated the behaviour of the brick with frost penetration. During this continuous freezing simulation, no visible cracking occurred. Expansion which followed the progression of the freezing front was fast and short and reached a maximum within 10 h. This reflected the fast cap-illary kinetics of the bricks. Indeed, the homogeneity and the good connectivity of the porous network were likely to have facilitated ice growth and extrusion. Below the freezing front, contraction was probably due to migration of water to-wards the freezing front (cryosuction). As expansion was short-lived while cooling temperature was maintained, sin-gle freezing event would be insufficient for producing a new crack. The repetition of freeze-thaw cycles would probably be necessary to create cracks. The total expansion at the end of the experiment was computed to be 17.9 µm (Fig. 12a). 6.2.3 Summary
The first experiment with continuous freezing showed: 1. For capillary saturated bricks, freezing expansion was
insignificant near the surface and increased towards the water level, but much less than at vacuum saturation. 2. For fully saturated bricks, freezing expansion occurred
mostly between 0◦C and −1◦C at each depth and con-traction just below the freezing front suggested desic-cation due to water migration (Fig. 14). Due to fast capillary kinetics, expansion duration was short. With
C. Thomachot et al.: Frost damage of bricks composing a railway tunnel monument in Central Japan 473
42 Figure 15
Fig. 15. Temperature (a) and calibrated heave (b) of bricks
submit-ted to a diurnal freezing at capillary saturation. Note that the heave scale is 4 times larger than Fig. 14.
frost penetration, expansion at different depths cumu-lated to increase progressively total frost heave of the brick. Deeper freezing favoured large total heave and could explain the largest heave in zone 1 observed in the tunnel, but it did not lead to cracking.
Maximum heave had to be located and repeated at a same depth to lead to cracking. Large heave did not mean cracking but distribution of ice lenses at different depths. And the good transfer properties of bricks prevented the growth of a thick ice lens at one depth. This suggested that frost damage of the brick was favoured by:
1. High saturation level before freezing and water supply during freezing (Larbi, 2004);
2. Repetition of freeze-thaw cycles, which was the topic of the next experiments.
6.3 Simulation of diurnal freeze-thaw cycles 6.3.1 Capillary saturated brick (Fig. 15)
No significant heave occurred in the capillary saturated bricks (Fig. 15b). Only a slight expansion occurred near the water tank at 8 and 10 cm, probably due to the increase of sat-uration of the brick by capillary absorption. Total residual ex-pansion at the end of the experiment was 9.2 µm (Fig. 12b). 6.3.2 Vacuum saturated brick (Fig. 16)
Cycles from +2◦C to −3◦C: At the end of freezing, temper-ature at 4 cm depth reached 0◦C. At the end of thaw, the entire sample was warmed to 2–3◦C. Thus the uppermost
43 Figure 16
Fig. 16. Temperature (a) and calibrated heave (b) at each depth of
a brick sample submitted to diurnal freeze-thaw cycles at vacuum saturation.
4 cm was submitted to freeze-thaw cycles (Fig. 16a). During freezing of the first cycle, before the freezing front reached 2 cm depth, contraction (−1.3×10⁻⁴)occurred at 2 cm prob-ably due to cryosuction of water towards the freezing front (Figs. 16b and 17a). Expansion (2.5×10⁻⁴)occurred at 2 cm depth after the freezing front reached. The amount of expan-sion was nearly constant during the 4 cycles. At 4, 6, and 8 cm depth, the sample contracted slightly during freezing and dilated during thaw. The contraction was larger near the freezing front: −0.5×10⁻⁴at 4 cm, −0.3×10⁻⁴at 6 cm and
−0.1×10⁻⁴at 8 cm. In course of the next cycles, expansion and contraction at each depth were nearly the same. At the end of these 4 cycles, there was only a small residual expan-sion at 4 cm (0.6×10⁻⁴).
Cycles from +3◦C to −5◦C: During these cycles, the freez-ing front reached 6 cm depth at the end of the freezfreez-ing. At the end of thaw, the entire sample was at about 3◦C (Fig. 17b). During freezing, expansion occurred at 2 and 4 cm (respectively 7.0×10⁻⁴ and 3.4×10⁻⁴)whereas con-traction occurred at 6 and 8 cm (respectively −0.6×10⁻⁴and
−0.2×10⁻²). As cycles went, expansion at 2 and 4 cm in-creased to respectively 9.1×10⁻⁴ and 4.5×10⁻⁴, whereas contraction at 6 and 8 cm was similar to during the first cy-cle. At the end of these cycles, there were residual expan-sions at 2 and 4 cm which cumulated with cycles (respec-tively 1.3×10⁻⁴and 1.2×10⁻⁴, Fig. 12b).
Cycles from +5◦C to −8◦C: During these cycles, the freez-ing front reached 8 cm depth at the end of the freezfreez-ing. At the end of thaw, the entire sample was at 5◦C. During freezing, expansion occurred at each depth from 2 to 8 cm when the freezing front progressed, which followed contraction due to cryosuction just below the freezing front. During the first cycle expansion at 2 cm was 10.6×10⁻⁴, then it decreased
44
Fig. 17. Layout of totally saturated brick samples during freezing of (a) +2◦C to −3◦C cycles, (b) +3◦C to −5◦C cycles, (c) +5◦C to −8◦C cycles.
during the next cycles to reach only 5.0×10⁻⁴ at the 4th
cycle. At 4 cm, expansion was 5.9×10⁻⁴ at the first cycle and increased as cycles went to reach 7.2×10⁻⁴. At the last cycle, expansion at 4 cm was larger than expansion at 2 cm. At 6 cm expansion also increased as cycles went, from 3.3×10⁻⁴to 5.2×10⁻⁴. At the last cycle, expansion at 6 cm was as large as at 2 cm. At 8 cm expansion fluctuated irreg-ularly between 0.8×10⁻⁴and 2.5×10⁻⁴during the 4 cycles. During these cycles, expansion at 2 and 4 cm decreased at a constant cooling plate temperature that induced slightly low-ering subfreezing temperature at each depth. Possible causes of the contraction near the surface could be the desiccation due to (1) sublimation of ice from the surface, (2) the re-laxation of strength by ice melting due to pressures, plastic deformation and thermal contraction of ice and/or (3) the ex-trusion of ice into the dried pores (Fig. 17c). At the end of the experiment, residual expansion occurred at each depth with a total amount of 11.5 µm (Fig. 12b). As the freezing front did not reach deeper than 8 cm, we can assume that computed heave was representative of the whole brick.
6.3.3 Summary
Tests at vacuum saturation showed that during cycles from +2◦C to −3◦C, the freezing front penetrated from the surface to 3–4 cm depth. Expansion occurred only at 2 cm depth and the amount was nearly constant during further cycles.
During cycles from +3◦C to −5◦C, freezing front pene-trated to 5–6 cm depth. Expansion occurred at 2 and 4 cm depth and increased as cycles went. Expansion was still largest at 2 cm depth. These two types of cycles were rep-resentative of the field conditions recorded in the tunnel dur-ing winter. The location of maximum heave at 2 cm could explain the size of brick hollows. As the residual expansion increased when submitted to +3◦C to −5◦C cycles, bricks would be more sensitive to diurnal freezing to −5◦C than to
−3◦C.
Cycles from +5◦C to −8◦C were stronger than freeze-thaw cycles recorded in the tunnel. They led to a maximum heave at 4 cm and 6 cm which increased as cycles went, whereas expansion at 2 cm decreased due to drying of the top of the brick. If such a strong freezing were to happen, it would lead to bigger detachments than those found in the tunnel. For the capillary saturated bricks submitted to diurnal freezing, freezing expansion was insignificant.
At the end of the experiments, although drying of the bricks was minimized, vacuum saturated bricks slightly dried and 93% of the porosity remained occupied by wa-ter. This indicated desaturation of near-surface macrop-ores. On the contrary, bricks tested at capillary saturation slightly increased their moisture content during the exper-iments. Cryosuction and water supply from the tank con-tributed to the increase of moisture content from 71% to 74%.
7 Discussion
Bricks of Usui tunnel facing north and regularly supplied with water seem frost sensitive. Angular detachments of less than 2 cm thick occurred during winter. Field monitor-ing durmonitor-ing the 2003–2004 winter showed expansion of bricks during the freezing periods. Recorded frost was a combina-tion of continuous slow freezing of less than 15 days and diurnal freezing with various ranges (the maximum range for one cycle was from −5◦C to +3◦C). The laboratory experi-ments reproduced unidirectional freezing with water supply that operated on the bricks of the tunnel, although freezing was simplified.
7.1 Moisture condition
Two moisture conditions were tested, with capillary and vac-uum saturations. Results showed that any freezing was in-significant on bricks subjected to simple capillary absorp-tion during a few days even 71% of pores were filled with
C. Thomachot et al.: Frost damage of bricks composing a railway tunnel monument in Central Japan 475 water. Only fully saturated bricks showed significant
dila-tion. This meant that in natural conditions, frost was efficient only on bricks regularly supplied with water for a long time as they had time to saturate by diffusion of air through water. Furthermore, the laboratory simulation showed that moisture content could increase due to ice segregation (cryosuction). Indeed, mapping of erosion showed the relationship between the location of intensive erosion and water seepage from the wall.
7.2 Type of freezing
When bricks were well saturated, the magnitude of expan-sion depended on the location of freezing front in the sam-ple. During continuous freezing expansion followed the frost penetration (up to 11 cm depth), whereas during repetition of diurnal freeze-thaw cycles expansion occurred and increased in all the frozen part but mainly near the surface. Continuous freezing allowed deeper migration of the freezing front but lower heave than diurnal freeze-thaw cycles (Fig. 12). 7.3 Intensity of freezing
Whatever the type of freezing, however, the maximum ex-pansion always occurred at the shallowest (2 cm) depth. Only under diurnal freeze-thaw cycles from +3◦C to −5◦C, which were similar to the maximum recorded range in the tun-nel (Fig. 8c), residual expansion at 2 cm depth increased as cycles went. Otherwise, expansion remained constant. The strongest diurnal freezing (+5◦C to −8◦C, stronger than freezing recorded in the tunnel) led to the drying of the upper part of the brick and/or the relaxation of pressures of ice near the surface of the brick and shifted the location of the max-imum heave at 4 cm depth. This showed that climatic con-ditions recorded in the tunnel during the 2003–2004 winter allowed frequent heave events within the shallowest (2 cm) depth which corresponded to the average depth of the hol-lows on the eroded bricks. This confirmed that climatic con-ditions of the year were typical. Although samples were not fractured during the experiments, near-surface heaving could lead to cracking of the brick with repetition of freeze-thaw cycles. More numerous freeze-thaw cycles should be per-formed in the laboratory in order to assess this hypothesis.
8 Conclusion
Mapping of brick erosion at a north-facing wall in a Usui rail-way tunnel showed the link between erosion and water sup-ply, whereas field monitoring showed the temperature con-ditions at which frost heave happened. Bricks submitted to continuous and diurnal freezing in the laboratory. Results showed that the maximum expansion occurred at 2 cm depth or possibly shallower, which corresponded to the average depth of brick hollows and thickness of detached fragments in the tunnel. Because of rapid moisture kinetics, expansion and its duration were short-lived in the brick. Thus, repetition
of short-term freeze-thaw cycles was effective in cracking at shallow depth.
In summary, field monitoring and laboratory simulations combined to show that the continuous water supply and the repetition of diurnal freeze-thaw cycles were most important in weathering of the bricks.
From winter 2005, the entrance of the tunnel has been closed by a plastic sheet. During the working of the rail-way, the tunnels were closed during the nights; and at that time bricks did not show so strong frost weathering. Placing this sheet will reproduce the layout of the railway during its working. It will prevent the inner part of the tunnel from high range of temperature like diurnal freeze-thaw cycles. Mon-itoring will assess the consequence of closing the tunnel on dilation and weathering of bricks.
Acknowledgements. We would like to thank C. T. Oguchi and
T. Hatta (Japan International Research Center for Agricultural Sci-ences of Tsukuba) for helping the SEM and chemical analysis and B. Renaudie (Petrophysical laboratory of Strasbourg University) for making the thin sections.
Edited by: G. F. Wieczorek
Reviewed by: M. Bostenaru and J. D. Mertz
References
Aubry, M. P. and Lautridou, J, P.: Relations entre pro-pri´et´es physiques, g´elivit´e et caract`eres microstructuraux dans divers types de roches: craies, calcaires crayeux, cal-caire sublithographiques et silex, Colloque International de G´eomorphologie Li`ege-Caen, Bull. 19, 7–16, 1974.
Cady, P. D.: Mechanisms of frost action in concrete aggregates, Journal of Materials, J.M.L.S.A., 4, 2, 294–311, 1969.
Everett, D. H.: The thermodynamics of frost damage to porous solids, Trans. Faraday Soc., 57, 1541–1551, 1961.
Katz, A. J. and Thompson, A. H.: Quantitative prediction of perme-ability in porous rock, Physical Review, Vol. 34.7., 8179–8181, 1986.
Hall, K.: The role of thermal stress fatigue in the breakdown of rocks in cold regions, Geomorphology, 31, 47–63, 1999. Hammecker, C.: The importance of the petrophysical properties and
external factors in the stone decay monuments, Pageoph., 145, 2, 337–61, 1995.
Ham`es, V., Lautridou, J. P., Ozer A., and Pissart, A.: Variations di-laom´etriques de roches soumises `a des cycles ”humidification-s´echage”, G´eographie Physique et Quaternaire, Vol. XLI , 3, 345–354, 1987.
Hirschwald, J.: Handbuch der bautechnischen Gesteinspr¨ufung, Berlin Borntraeger, 1912.
Ito, K. and Chiba, M.: Railway stations and local communities in Japan, Japan Railway & Transport Review, 28, p. 17, 2001. Japan Meteorological Agency: Online Information on
Cli-mate Statistics, http://www.data.kishou.go.jp/etrn/index.html (in Japanese), 2005.
Larbi, J. A.: Microscopy applied to the diagnosis of the deteriora-tion of brick masonry, Construcdeteriora-tion and Building Materials, 18, 299–307, 2004.
Letavernier, G.: La g´elivit´e des roches calcaires, relation avec la morphologie du milieu poreux, PhD Thesis of Caen University, France, 1984.
Mamillan, M.: Influence de la microstructure des roches sur leur durabilit´e, Service Etude des Mat´eriaux, CEBTP France, 285– 292, 1967.
Matsukura, Y. and Yatsu, E.: An Apparatus for the Measurement of Swelling Pressure of Some Argillaceous Rocks and Concept of Swelling Energy, Japanese Geomorphological Union, 1, 1, 35– 41, 1980.
Matsuoka, N.: Mechanisms of rock breakdown by frost action, an experimental approach, Cold Regions Science and Technology, 17, 253–270 1990.
Matsuoka, N.: Microgelivation versus macrogelivation: towards bridging the gap between laboratory and field frost weathering, Permafrost and Periglacial Processes, 12, 299–313, 2001. Pissart, A. and Lautridou, J. P.: Variations de longueur de cylindres
de pierre de Caen (calcaire bathonien) sous l’effet de s´echage et d’humidification, Zeit, Geomorph., N. F., Bd. 49, 111–116 suppl., 1984.
Powers, T. C.: A working hypothesis for further studies of frost re-sistance of concrete, Journal of the American Concrete Institute, 16, 245–272, 1945.
Powers, T. C. and Helmuth, R. A.: Theory of volume changes in hardened Portland cement paste during freezing, Proc. Highway Rese, Board, 32, 285–297, 1953.
Prick, A.: Dilatometrical behaviour of porous calcareous rock sam-ples subjected to freeze-thaw cycles, Catena, 25, 7–20, 1995. Remy, J. M.: Influence de la structure du mileu poreux carbonat´e
sur les transferts d’eau et les changements de phase eau-glace. Application `a la durabilit´e au gel de roches calcaires de Lorraine, PHD Institut National Polytechnique de Lorraine, 1993. Smith, R. A.: The Usui Toge Railway of the Shin-etsu Line 1893–
1997, Impact of railways on Japanese Society & Culture, Japan Railway & Transport Review, 13, 28–33, 1997.
Thomas, W. N.: Experiments on the freezing of certain buildings materials. Building Research, Technical Paper 17, 1938. Wardlaw, N. C., McKellar, M., and Li, Y.: Pore and throat size
distributions determined by mercury porosimetry and by direct observation, Carbonates and Evaporites, 3, 1, 1–15, 1988. Weiss, G.: Die Eis- und Salzkristallisation im Porenaum von
Sand-steinen und ihre Auswirkungen auf das Gef¨uge unter besonderer Ber¨ucksichtigung gesteinsspezifischer Parameter, M¨unchner Ge-owissenschaftiche Abhandlungen, B, 9, pp. 118, 1992.