HAL Id: hal-00296888
https://hal.archives-ouvertes.fr/hal-00296888
Submitted on 9 Jan 2006
HAL is a multi-disciplinary open access
archive for the deposit and dissemination of
sci-entific research documents, whether they are
pub-lished or not. The documents may come from
teaching and research institutions in France or
abroad, or from public or private research centers.
L’archive ouverte pluridisciplinaire HAL, est
destinée au dépôt et à la diffusion de documents
scientifiques de niveau recherche, publiés ou non,
émanant des établissements d’enseignement et de
recherche français ou étrangers, des laboratoires
publics ou privés.
ENSO and sandy beach macrobenthos of the tropical
East Pacific: some speculations
T. Vanagt, E. Beekman, M. Vincx, S. Degraer
To cite this version:
T. Vanagt, E. Beekman, M. Vincx, S. Degraer. ENSO and sandy beach macrobenthos of the tropical
East Pacific: some speculations. Advances in Geosciences, European Geosciences Union, 2006, 6,
pp.57-61. �hal-00296888�
© 2006 Author(s). This work is licensed under a Creative Commons License.
Geosciences
ENSO and sandy beach macrobenthos of the tropical East Pacific:
some speculations
T. Vanagt, E. Beekman, M. Vincx, and S. Degraer
Gent University, Department of Biology, Marine Biology Section, B-9000 Gent, Belgium
Received: 4 July 2005 – Revised: 16 November 2005 – Accepted: 21 November 2005 – Published: 9 January 2006
Abstract. The influence of the ENSO cycle on marine fauna and flora has only recently been given the attention it de-serves. The very strong 1997–1998 El Ni˜no and its obvious effects on marine biota was a key point in ENSO research, but unfortunately few quantitative data about the 1997–1998 El Ni˜no itself are available.
To gather information about the effect of ENSO on the macrobenthos, we performed a bi-weekly transect monitor-ing on an Ecuadorian sandy beach in 2000–2001, durmonitor-ing the strong La Ni˜na following the 1997–1998 El Ni˜no, and in the normal period of 2002–2004.
In this paper, intertidal macrofaunal densities at higher taxonomic level are used to compare a La Ni˜na phase with the ‘normal’ situation. The few existing documents about El Ni˜no and sandy beach macrobenthos, and scattered data from previous and current research, were used to complete the picture.
Total macrobenthos densities were 300% lower during the La Ni˜na phase compared with equal months in the normal phase. Especially Crustacea and Mollusca showed a marked increase in densities towards the normal situation (94% and 341% respectively). Polychaeta and Echinodermata, how-ever, showed higher densities during the La Ni˜na phase (22% and 73% respectively).
Two possible explanations are proposed. (1) Low densities during the La Ni˜na could be due to the very strong preced-ing El Ni˜no, suggestpreced-ing the populations were still recoverpreced-ing. This hypothesis is supported by previous work done in the south of Peru. This is, however, a cold water system, com-pared to the Ecuadorian warm water system. (2) The second hypothesis states that a La Ni˜na will have a very severe im-pact on the intertidal macrofauna of a warm water system like the Ecuadorian coast.
Correspondence to: T. Vanagt ([email protected])
1 Introduction
Although the ENSO cycle has a very obvious influence on life in and around the sea, its impact on marine, especially benthic, biota has not yet seen the attention it deserves. The very severe 1997–1998 El Ni˜no was a key point in the re-search of impacts of the ENSO cycle on the biological en-vironment. Information from before 1998 is rather scarce and scattered. Unfortunately, the 1997–1998 El Ni˜no itself is also poorly documented, especially for sandy beaches. The work presented here was initiated with future El Ni˜no events in mind. After all, it is very important to have data of long-term monitoring if one wants to observe anomalies caused by climate phenomena. For this paper, two eight-month periods are discussed. The first period coincides with the very strong and long lasting La Ni˜na of 1999–2001, the second period can be considered normal.
Most of the studies on the impact of ENSO on marine benthos were done in subtidal areas and in subtropical or temperate regions. Only few papers concerning sandy beach fauna are available. The 1982–1983 and 1997–1998 “super-El Ni˜nos” seemed to have had a dramatic impact on the sandy beach fauna of Peruvian sandy beaches (Arntz, 1986; Arntz et al., 1987; Tarazona and Paredes, 1992; Arntz, per-sonal comment), causing a decrease of up to 99.99% of
the densities and a southward movement of 7◦ latitude of
some species, but with a positive effect on other species (Arntz, 1986). In contrast, Riascos (2002) could not find ma-jor changes in sandy beach macrobenthos densities on the Colombian coast during the 1997–1998 El Ni˜no. Species richness dropped slightly during the end of 1997 but already recovered in January 1998, at a time SST anomalies were at their highest.
In contrast to the Peruvian system described by Tarazona and Paredes (1992), which is year-round dominated by the cold Humboldt Current, the Colombian beaches are part of an intrinsic warm-water system. Ecuador lies in between both, with warm water during the rainy season and relatively cold water during the rest of the year. Still, in general, the
58 T. Vanagt et al.: ENSO and sandy beach macrobenthos of the tropical East Pacific
Jan-93 Jun-94 Oct-95 Mar-97 Jul-98 Dec-99 Apr-01 Sep-02 Jan-04 21 22 23 24 25 26 27 28 29 30 31 T e m perat ure (° C) Date El Niño La Niña 0 1 2 El Niño La Niña
Jan-93 Jun-94 Oct-95 Mar-97 Jul-98 Dec-99 Apr-01 Sep-02 Jan-04 21 22 23 24 25 26 27 28 29 30 31 T e m perat ure (° C) Date El Niño La Niña 0 1 2 El Niño La Niña
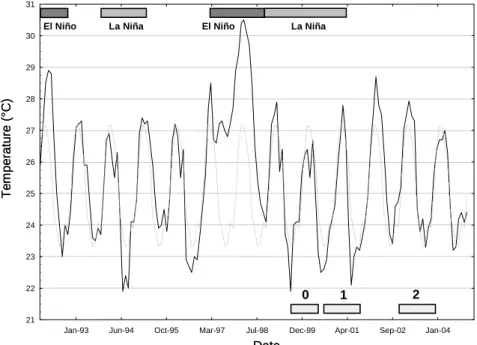
Fig. 1. SST values from the last 13 years for the EL Pelado station (full line: actual values; dotted line: long-term average). El Ni˜no and La
Ni˜na events are marked at the top of the graph; the three phases are marked at the bottom of the graph.
Ecuadorian coast can be considered as a tropical environ-ment. On top of that, Ecuador is, because of its position right on the equator, one of the countries in the tropical East Pa-cific that will be most severely struck by an El Ni˜no or La Ni˜na event.
In this paper we describe some results from the last La Ni˜na period compared to a normal situation for Ecuador. We also give some speculations on how the Ecuadorian warm water system might react differently to ENSO events than the Peruvian cold water system.
2 Material and methods
From June 2000 through July 2001 and December 2002 through January 2004, the sandy beach of San Pedro de
Manglaralto (1◦5400000S and 80◦4600000W) was sampled on
a bi-weekly basis, with a sampling technique as described by Aerts et al. (2004). Only the 1-mm fraction was preserved and identified. Measured environmental variables were pre-cipitation, cloudiness, surf water and air temperature, sedi-ment characteristics, wave height and period and surf water salinity. The beach profile was assessed using a leveler. For this paper, only the months December–July of the two peri-ods are discussed, named phase 1 and phase 2, respectively. For beach characteristics, we refer to Aerts et al. (2004).
Additional data from 1999–2000 were used. The same beach was sampled once in August and November 1999 and February and June 2000, but only at low tide. These data are referred to as phase 0.
Climatologic and oceanographic data were retrieved from the Oceanographic Centre of El Pelado (Fundaci´on
CENAIM-ESPOL). This station is situated approximately 1 km offshore from the sampled beach.
Macrobenthos data were calculated to densities and
ex-pressed as ind/m2. In this paper, only total densities and
den-sities at higher taxonomic level (Polychaeta, Echinodermata, Crustacea, Bivalvia and Gastropoda) are discussed. Non-parametric Kruskal-Wallis and Mann-Whitney U and Spear-man’s rank correlation tests were performed using Statistica 6.0 (Statsoft, 1996).
3 Results
3.1 Environment
SST values from the last 13 years for EL Pelado are plot-ted in Fig. 1. The three phases are marked, as are the last ENSO events, based on both SST data and thermocline depth data for El Pelado. SST during sampling ranged from 21.9 to
27.9◦C, with an average of 25.6◦C. Average SST for the three
phases was 23.8, 25.1 and 26.4◦C, respectively
(Kruskal-Wallis test: p<0.05).
Correlation of the SST values for El Pelado with Ni˜no3.4 anomalies showed an r-value of 0.24 (p<0.05).
SST data for the seasons of the two phases are plotted in Fig. 2. The warm and wet season persisted from December through April, and the cold and dry season continued from May through November. Mean SST for the warm/wet season
over the two phases was 26.8◦C, and 24.1◦C for the cold/dry
season (Mann-Whitney U test: p<0.05). Mean SST for the
warm/wet season for the first phase was 26.5◦C and 27.1◦C
warm/wet cold/dry 22.5 23.0 23.5 24.0 24.5 25.0 25.5 26.0 26.5 27.0 27.5
Phase 0 Phase 1 Phase 2
22.5 23.0 23.5 24.0 24.5 25.0 25.5 26.0 26.5
p<0.05
T e m perature ( °C)p<0.05
warm/wet cold/dry 22.5 23.0 23.5 24.0 24.5 25.0 25.5 26.0 26.5 27.0 27.5Phase 0 Phase 1 Phase 2
22.5 23.0 23.5 24.0 24.5 25.0 25.5 26.0 26.5
p<0.05
T e m perature ( °C)p<0.05
Fig. 2. Left: SST values from El Pelado for phase 1 (red line: La Ni˜na) and phase 2 (green dotted line: Normal). Right: SST values from El
Pelado for the three phases. Average values ±SE.
200 400 600 800 1000 1200 1400 1600 1800 2000 2200 2400 5 10 15 20 25 30 35 40 45 50 40 60 80 100 120 140 160 180 1 2 0 1 2 3 4 5 6 7 1 2 12 13 14 15 16 17 18 19 20 200 400 600 800 1000 1200 1400 1600 1800 2000 2200 2400 2600
Total macrobenthos Crustacea
Bivalvia Gastropoda Polychaeta Echinodermata p<0.05 p<0.05 p<0.05 p<0.05 p<0.05 p<0.05 phase de ns it y ( ind ./ m²) 200 400 600 800 1000 1200 1400 1600 1800 2000 2200 2400 5 10 15 20 25 30 35 40 45 50 40 60 80 100 120 140 160 180 1 2 0 1 2 3 4 5 6 7 1 2 12 13 14 15 16 17 18 19 20 200 400 600 800 1000 1200 1400 1600 1800 2000 2200 2400 2600
Total macrobenthos Crustacea
Bivalvia Gastropoda Polychaeta Echinodermata p<0.05 p<0.05 p<0.05 p<0.05 p<0.05 p<0.05 phase de ns it y ( ind ./ m²)
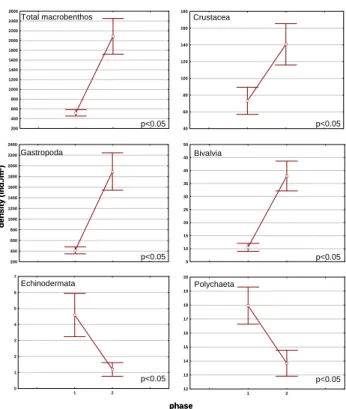
Fig. 3. Density values for total macrobenthos and higher taxonomic
groups for phase 1 and 2. Average values ±SE.
the cold/dry season values were 23.1◦C and 25.1◦C
respec-tively (Mann-Whitney U test: p<0.05).
3.2 Macrobenthos
A total of 48 macrobenthic species were found during both
periods, 13 of which in large numbers (>2.5 ind/2averaged
over all samples). Most dominant groups were crustaceans (17 species), bivalves (11 species), polychaetes (10 species), gastropods (7 species) and echinoderms (4 species).
0 500 1000 1500 2000 2500 3000 3500 4000 20 40 60 80 100 120 140 160 180 200 220 240 260 5 10 15 20 25 30 35 40 45 50 1 2 0 1 2 3 4 5 6 7 8 0 500 1000 1500 2000 2500 3000 3500 1 2 10 12 14 16 18 20 22 24 26
Total macrobenthos Crustacea
Bivalvia Gastropoda Polychaeta Echinodermata p<0.05 p<0.05 p<0.05 p<0.05 p<0.05 p<0.05 dens it y ( ind ./m² ) season 0 500 1000 1500 2000 2500 3000 3500 4000 20 40 60 80 100 120 140 160 180 200 220 240 260 5 10 15 20 25 30 35 40 45 50 1 2 0 1 2 3 4 5 6 7 8 0 500 1000 1500 2000 2500 3000 3500 1 2 10 12 14 16 18 20 22 24 26
Total macrobenthos Crustacea
Bivalvia Gastropoda Polychaeta Echinodermata p<0.05 p<0.05 p<0.05 p<0.05 p<0.05 p<0.05 dens it y ( ind ./m² ) season
Fig. 4. Seasonal density values for total macrobenthos and higher
taxonomic groups for phase 1 (red line: La Ni˜na) and phase 2 (green dotted line: Normal). 1: warm/wet season; 2: cold/dry season. Average values ±SE.
Comparison of the average densities for total macroben-thos and for the higher taxonomical groups between the two phases is shown in Fig. 3. From phase 1 to phase 2, aver-age total densities increased with 300%, mainly due to the increase in Mollusca (+358%). Crustacea (+92%) and Bi-valvia (+260%) also increased significantly (Mann-Whitney U test: p<0.05). Significant (Mann-Whitney U test: p<0.05) decreases were found for Polychaeta (−23%) and Echinoder-mata (−74%).
60 T. Vanagt et al.: ENSO and sandy beach macrobenthos of the tropical East Pacific
Phase 0 Phase 1 Phase 2
0 200 400 600 800 1000 1200 1400 1600 1800 2000 2200 2400 2600 density (ind/m²) p<0.05
Phase 0 Phase 1 Phase 2
0 200 400 600 800 1000 1200 1400 1600 1800 2000 2200 2400 2600 density (ind/m²) p<0.05
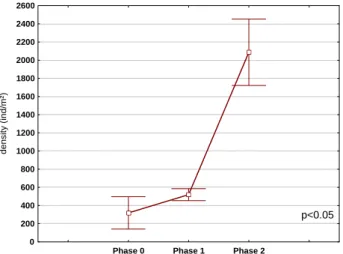
Fig. 5. Density values of the low water station for total
macroben-thos and higher taxonomic groups for phase 0, 1 and 2. Average values ±SE.
In Fig. 4 the differences in seasonality between the two phases are stated. It is easily seen that the differences men-tioned before are mainly due to differences in the warm/wet season. Only for Polychaeta is the difference noticeable in the cold/dry season. For Bivalvia both seasons show equal differences.
4 Discussion
As for the entire east coast of South America, Ecuador was very severely struck by the 1997–1998 El Ni˜no. This El Ni˜no was followed by an almost as severe La Ni˜na, which per-sisted until the end of 2001 for the Ecuadorian coast, and was only sporadically interrupted by normal periods. For the El Pelado station, this can especially be seen in the thermo-cline depth, which was very shallow during this whole La Ni˜na period.
Although SST for the two phases are significantly differ-ent, especially for the warm/wet season, one could argue that this difference does not justify categorizing the first phase as a La Ni˜na. However, if we look at the SST for the months preceding the first phase, we see markedly lower tempera-tures compared to the SST for the months preceding the sec-ond phase. This makes us confident that for the macroben-thos, the first phase can be regarded as a La Ni˜na period, opposed to the normal second phase.
There was a very strong increase in macrobenthos densi-ties from the first to the second phase, except for the Poly-chaeta and the Echinodermata, which make up a lesser part of the total sandy beach macrobenthos. Total macrobenthos densities during the peak of the La Ni˜na (phase 0) were even lower than those from phase 1 (Fig. 5). From field observa-tions and ongoing research, we know that the densities found during the second phase are comparable to current densities, suggesting they are to be considered as “normal”. This leaves
El Niño Current Humboldt Current El Pelado Ecuador Peru Colombia Pacific Ocean Equatorial fringe Equatorial subcurrent El Niño Current Humboldt Current El Pelado Ecuador Peru Colombia Pacific Ocean Equatorial fringe Equatorial subcurrent
Fig. 6. Map of the central Ecuadorian coast with dominant currents.
us to explain the very low densities during the end of the La Ni˜na phase.
The most obvious explanation would be to hold the very low densities during La Ni˜na against the preceding “super-El Ni˜no”. Indeed, several papers describe a dramatic decrease in densities of certain sandy beach macrofauna during very strong El Ni˜nos (Arntz, 1986; Tarazona and Paredes, 1992), and it could be assumed that populations were still recov-ering during the first sampling period. However, these data were retrieved from studies in central and south Peru, where a strong influence of an El Ni˜no on the cold water system is to be expected. Riascos (2002) could not find such a dra-matic influence of the 1997–1998 El Ni˜no on the sandy beach fauna of Colombia, a warm water system.
Unlike the Peruvian upwelling-system beaches (Arntz et al., 1987), the investigated beach is not a low species rich-ness/high dominance system. With a total of 48 species over both campaigns, this Ecuadorian beach can be compared with many European beaches, considered to be highly di-verse (Dexter, 1992; Degraer et al., 2003). With an average
intertidal density of 1329 ind/m2this beach could well prove
to be a very productive beach, although no biomass data are available to check this statement. This difference between Ecuador and Peru might be related to the currents and up-welling off their coasts: Peru is year-round dominated by the cold Humboldt Current and has very strong upwelling of nu-trient rich, cold water, whereas Ecuador has the interaction between the cold Humboldt and the warm El Ni˜no Current (Fig. 6), leading to the typical seasonality in both tempera-ture and upwelling. Thus, the Peruvian beaches are basically part of a cold water system; the Ecuadorian beaches are part of a warm water system. This can be verified by looking at the species composition. Indeed, Peru shares many species with Chile; Ecuador has many species that can be found in Panama and Colombia (Aerts et al., 2005; Dexter, 1974; Ri-ascos, 2002; Jaramillo and Gonzales, 1991; Tarazona et al., 1986).
The alternative hypothesis we are proposing is that a La Ni˜na, much more than an El Ni˜no, will cause a dramatic
such as is present in Ecuador. Unfortunately, we have little data to support this hypothesis from this study nor from other sandy beach benthos studies. We, therefore, suggest to care-fully analyze all the existing data for benthic organisms from the warm water system and compare the influence of an El Ni˜no and a La Ni˜na. Furthermore, going into species level could prove very valuable for testing this hypothesis: does a La Ni˜na typically cause the disappearance of warm water species while cold water species flourish, and vica versa?
Acknowledgements. The first author is financially supported by
the FWO Flanders. We would like to thank all the people who contributed in the field and laboratory work for this study: N. Fockedey, J. Wittoeck, S. Guartatanga, L. Dominguez, V. Ruiz, D. Van Gansbeke and D. Schram and numerous students from ESPOL. Lab facilities and logistics in Ecuador were provided by ESPOL in Guayaquil in person of M. Pilar de Cornejo and by CENAIM in San Pedro by J. Calderon. Finally we would like to thank J. Chavarria for his help with the climatological data.
Edited by: P. Fabian and J. L. Santos Reviewed by: W. Arntz and another referee
References
Aerts, K., Vanagt, T., Fockedey, N., et al.: Macrofaunal commu-nity structure and zonation of an Ecuadorian sandy beach (bay of Valdivia), Belg. J. Zool., 134 (1), 17–24, 2004.
Arntz, W.: The two faces of El Ni˜no 1982–83, Meeresforschung, 1, 1–46, 1986.
Arntz, W., Brey, T., Tarazona, J., and Robles, A.: Changes in the structure of a shallow sandy-beach community in Peru during an El Ni˜no event, in: The Benguela and Comparable Ecosystems, edited by: Payne, A., Gulland, J., and Brink, K., South African Journal of Marine Science, 5, 645–658, 1987.
de la comunidad de macroinvertebrados bent´onicas en las playas arenosas de Trujillo. Anuario I Congreso Nacional de Biologia Pesquera (Trujillo, Per´u), 213–218, 1985.
Degraer, S., Volckaert, S., and Vincx, M.: Macrobenthic zonation patterns along a morphodynamical continuum of macrotidal, low tide bar/rip and ultra-dissipative sandy beach, Est. Coast. Shelf Sc., 56, 459–468, 2002.
Dexter, D.: Sandy beach fauna of the Pacific and Atlantic coasts of Costa Rica and Colombia, Revista De Biologia Tropical, 22, 51–66, 1974.
Dexter, D.: Sandy beach community structure: the role of exposure and latitude, J. of Biog., 19, 59–66, 1992.
Jaramillo, E.: Sandy beach macroinfauna from the Chilean coast: zonation patterns and zoogeography, Vie et Milieu, 37, 165–174, 1987.
Jaramillo, E. and Gonzales, M.: Community structure of the macro-fauna along a dissipative-reflective range of beach category in southern Chile, Studies on Neotropical Fauna and Environment, 26, 193–212, 1991.
StatSoft, Inc.: Statistica for WINDOWS, Computer program man-ual, Tulsa, OK, USA, 1996.
Riascos, J.: Changes in the macrobenthos of a sandy beach during, El Ni˜no“ 1997–98 in the Malaga Bay, Colombian Pacific, Cienc. Mar., 28 (1), 13–25, 2002.
Tarazona, J., Paredes, C., and Igreda, M.: Estructura del macroben-thos en las playas arenosas de la zona de Lima, Per´u, Revista Ciencias Universidad Nacional Mayor de San Marcos (Lima, Per´u), 74, 103–116, 1986.
Tarazona, J. and Paredes, C.: Impacto de los eventos El Ni˜no so-bre las comunidades bent´onicas de playa arenosa durante 1976– 1986, in: Paleo ENSO Records, edited by: Ortlieb, L. and Mar-char´e, J., International Symposium, Lima, Per´u, 299–303, 1992.