HAL Id: hal-01900771
https://hal.archives-ouvertes.fr/hal-01900771
Submitted on 29 Jul 2020
HAL is a multi-disciplinary open access
archive for the deposit and dissemination of
sci-entific research documents, whether they are
pub-lished or not. The documents may come from
teaching and research institutions in France or
abroad, or from public or private research centers.
L’archive ouverte pluridisciplinaire HAL, est
destinée au dépôt et à la diffusion de documents
scientifiques de niveau recherche, publiés ou non,
émanant des établissements d’enseignement et de
recherche français ou étrangers, des laboratoires
publics ou privés.
Threshold voltage bitmap analysis methodology:
Application to a 512kB 40nm Flash memory test chip
T. Kempf, V. Della Marca, L. Baron, F. Maugain, F. La Rosa, S. Niel, A.
Regnier, Jean-Michel Portal, P. Masson
To cite this version:
T. Kempf, V. Della Marca, L. Baron, F. Maugain, F. La Rosa, et al.. Threshold voltage bitmap
analysis methodology: Application to a 512kB 40nm Flash memory test chip.
IEEE
Interna-tional Reliability Physics Symposium (IRPS 2018), Mar 2018, Burlingame, CA, United States.
�10.1109/IRPS.2018.8353642�. �hal-01900771�
Threshold Voltage Bitmap Analysis Methodology:
Application to a 512kB 40nm Flash Memory Testchip
T. Kempf
1,2,3, V. Della Marca
2, L. Baron
1, F. Maugain
1, F. La Rosa
1, S.Niel
1, A. Regnier
1, J.-M. Portal
2, P. Masson
3 1. STMicroelectronics, Rousset, France2. IM2NP, Aix-Marseille University, Marseille, France 3. EpOC / Nice Sophia-Antipolis University, Biot, France
Abstract— The reliability requirements of Flash memory
become more and more challenging. Flash memory technology development needs testchips to allow large statistical studies and a product-like approach. In this paper, we present a methodology of bitmap analysis to extract and follow the intrinsic and extrinsic parameters of a 40nm eFlash technology during ramp-up. This methodology is based first on analog bitmap acquisition on 512kB testchip, followed by correction of spatial variabilities like peripheral circuit influences, array organization impacts and process-induced effects, to extract supplementary cell electrical parameters such as threshold voltage, transconductance or programing window. Finally such an analysis tool enhances the advantageous properties of test chip, its large memory cell statistics and its product-like organization, to give more reliable data and yields more information about intrinsic cell technology weaknesses and the best way to tackle them when integrated at product level.
I. INTRODUCTION
Embedded Non Volatile Memory (eNVM) [1], are today scaled down to the 40nm technology node and beyond. The low voltage and high-density constraints as well as the required memory performances [2] stress the peripheral circuits and memory array design [3], [4]. Moreover the broad field of applications [5], brings the need to determine precisely the reliability performance of such eNVM technology. This implies a good proficiency to evaluate the extrinsic population of each technology as well as to determine the source of variability.
Cell performance variability in a product-like context is a complex sum of effects that are classified in spatial variability and cell-related, variability. Cell-related variability, or intrinsic variability, has been largely studied and increases with the technology scaling. It can be divided as the device to device variability, like the process-induced Gaussian cell topology variability [6] or the non-uniform doping [7], and as the within die variability, like RTN [8], [9], [10]. However, considering now the embedded memory cells not alone but integrated in an array and controlled by complex logic and high voltage circuits, a systematic cell variability, or extrinsic variability, exists as well. This spatial variability is linked to the cells environment and can be:
Linked locally to process non-uniformity, such as the ionic contamination [11], or as layer density-induced effects at the border of memory matrix [12] [13].
Linked to the peripheral organization, which contains, but is not limited to the design of circuits needed for accessing, reading, programing or erasing memory cells [3], [14].
Finally memory array organization itself may have also an impact on memory cell variability. With the cell area reduction and the increase of the memory cut capacity, voltage drop along bitlines and wordlines are of great concerns for designers [15]. The use of metal straps compensates efficiently the voltage drop but breaks the regularity of the array layout with possible side effect. Moreover because of the decrease of memory density with the increase of straps connection, the best solution is a compromise between a limited voltage drop and cost per die.
TABLE I. COMPLEMENTARITY BETWEEN TEST CHIP AND SINGLE
DEVICE
The use of complex test chip, based on product like architecture, i.e. microcontroller unit (MCU) with the embedded memory, is complementary to single device, as described in table I. Both test structures are mandatory during technology development to assess intrinsic cell performances as well as defectivity. Indeed, test chip, through continuous reading and Direct Memory Access (DMA) [16], allows extracting large statistics compared to single cell, devoted to deep and flexible characterization through I-V curve measurements. Moreover the environment of the cell is more representative of a final product, contrary to single device which is limited by the position of the selected device versus the number and the size of surrounding dummy cells. Finally the test time is quite low for single device and testing can be
Criteria Test structure
Single device Test chip
Statistics availability Low bits density High bits density Cell envirronement Limited Product like Memory defectivity Memory only
Peripheral effect, memory array organization/ intersite variation
Test time Low Need burn-in, or early failure binning (EWS) Test flexibility High.
Limited by its embedded test modes (BIST, reliability test, DMA…) and register values.
done directly at the end of Back End Of Line (BEOL) flow. While, for test chip, Electrical Wafer Sort (EWS) [2] is needed to trim and to bin the deficient dies and, if required, to package dies to be tested. Test chips are mainly tested by Built-In-Self-Test (BIST) engine. Thus it might be limited by the number and the flexibility of its test modes [16] and by the tester performance. Whereas single device testing is limited only by the tester capacity (very low current range, arbitrary signal generation). To summarize, flexibility, deep characterization, and fast test time are advantages of single cell with a lack of statistic and context. To overcome these last limitations, test chip are used to acquire large statistic in a product-like context at the prize of larger test time and complex setup.
Moreover, the particularity of memory technology, compared to logic circuit, is that the simple organization of memory in matrixes makes it easy to link any memory performance degradation to its location in the memory array [2]. Beyond statistical results, using the scrambling, which is the correspondence between electrical address and topological address, it becomes straightforward to correlates spatial effect with any change in the memory cell performance. The resulting bitmap has the advantage, compared to the generally used cell parameters distribution, to identify topologically each cell performance.
In this paper we present a methodology based on analog bitmap analysis and correction to determine intrinsic memory cell variability and spatial variability on a 40nm eNVM test chip of 512kB. Emphasis is put on test chip testing and bitmap potentialities over single device and distribution to study extrinsic populations and the impact of test chip
periphery and array organization on the embedded memory. The first section gives an overview of Flash technology as well as a brief description of the test vehicles (single cell and test chip). Then the paper focuses on the extraction and the processing of bitmap data. Finally this methodology is applied on the program state and a drain disturb test of the programed cells. In the last section, some conclusions are drawn.
II. DEVICE DESCRIPTION
A. Flash Memory technology
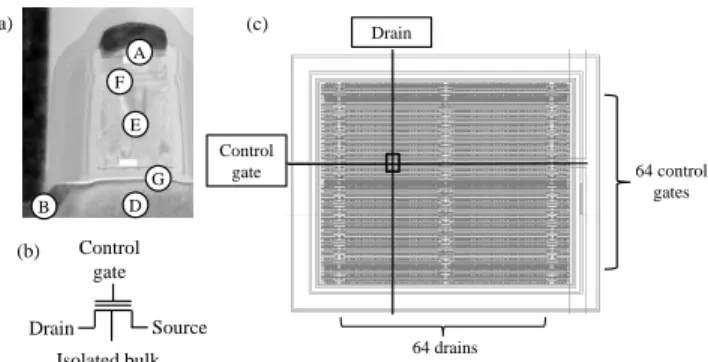
Our Flash technology is an eNVM processed in a 40nm technology node and composed of a floating gate transistor on an isolated bulk, as described in Fig. 1(a) and (b). Programing is done by hot carrier (HC) while erasing is realized by Fowler-Nordheim mechanism (FN). Reading operation is achieved by measuring drain current (at low drain voltage) and comparing the result to a reference current to determine the memory state.
B. Test chip description
Our test chip, described in Fig. 2(a) [17], is a MCU embedding a memory cut of our Flash technology. The array is based on a butterfly architecture, i.e. two NOR arrays in parallel. Furthermore all necessary high voltage and logic circuits are available in order to access, program, erase and read the memory as in a final product. In addition, four specific test functions are available: (i) direct memory access (DMA), (ii) built-in-self-test (BIST), (iii) continuous reading to realize distribution and bitmap, and (iv) internal generated biases monitoring. Test setup and execution are controlled by the tester which communicates, by Serial Peripheral Protocol (SPI), using 4 pads: a Serial Clock (SCLK), a Slave select (SS), a Master Output Slave Input (MOSI), and a Master Input Slave Output (MISO) pads. Multiple register values are available to trim and to optimize the memory access as well as the programing. In this article, programing time and programing voltage register parameters are of main interest. Moreover, in order to obtain the same initial programming window for each test chip, all test chips are trimmed during EWS.
As described in Fig.2 (b), an half memory array is controlled by 32 amplifier circuits, and divided by 16 strap localization which interrupt the layout redundancy to allow wordlines connections with metal straps. The border cells are impacted by a process-induced non-uniformity of the cell gate length that will modify memory performance [12].
C. Single cell device description
Single cell device are used to evaluate results of bitmap analysis. Each test device is a unique memory cell embedded in the center of a memory matrix of 10k cells, as in Fig. 1(c). This environment is equivalent, compared to the test chip to cells localized in the border of the test chip memory array (Fig2(b)).
Fig.1. (a) Sense of our 40nm Flash with a control gate (A), a drain (B), a source not shown here, an isolated bulk (D), a floating gate (E), the interpoly dielectric (F) and tunnel oxide (G). (b) Equivalent circuit of Flash memory. (c) Single cell device localized by the black square at the intersection of its selected control gate, and drain terminals, embedded in a matrix of 10k memory cells.
Fig. 2. (a) Test chip of 512kB description, containing 4M of memory cells and the necessary logic and high voltage controller circuit. (b) Half array test chip representation, 32 amplifier circuits units, 16 straps localization. The gradient on the border area represents the area of cells impacted by the memory process-induced border effect. The single cell test structure size is represented by the black square, while its position at the top-left corner is the most representative environment regarding the process induced border effect.
Drain Control gate 64 drains 64 control gates (c) B A E D F G Control gate Drain Source Isolated bulk (a) (b) x16 straps localization
x32 sense amplifier circuits Representation of the single
device matrix environment
process-induced border matrix impact area (b) x4 194 304 memory cells Bitlines decoders 512kB embedded memory Wordlines decoders Logic and high voltage
generation circuit
III. BITMAP ANALYSIS TOOL
A. Bitmap extraction procedure
The 512kB test chip is analyzed using bitmap test method extraction. Measurement on test chip is similar to the distribution extraction as described in Fig. 3, from a biasing point of view. The control gate voltage is applied through an analog pad to read words while continuous reading instructions are sent through SCLK, SS, MOSI, and MISO using SPI, like in Fig. 3(a) and (b). In Fig. 3(c), the control gate voltage is increased and memory area is read at each VG.
Finally, threshold voltage (VT) is extracted by comparing each
drain current cell to a reference current, IRef by the mean of a
sense amplifier circuit (Fig. 3(d)). A VT is associated to a cell,
considering VT=VCG when the sense amplifier flips. However,
the bitmap differs from distribution, in Fig. 3(g); as it uses the descrambling and the cell electric address to assign to each cell a topologic address. Finally, an analogic bitmap of VT is
obtained, (Fig.3(f)) whose VT values are described in grey
scale after the data processing described in Fig3(g). Here below, we present our method to identify the effects of peripheral circuits on a test chip and to improve the memory cell reliability extraction.
B. Bitmap vizualization
The final result of bitmap extraction is an array of threshold voltage topologically ordered Fig. 3(f). Using this method, with VT values represented as a color scale, one can
directly see that VT is not uniform over the test chip.
One way to enhance threshold voltage population description on bitmap is to modify the color scale by changing the linear to normalize using the transformation T:
Where nk is the number of occurrence level xk and sk the
new grey level of the pixel. This allows to give the same weight to all pixel or cells population, in one word to give more contrast and highlight all population. Comparison of bitmap results with normalized and linear scales are given in Fig. 4.
C. Parameter extraction
First bitmap data allows following other electric memory cell parameter than VT, which are not available otherwise, and
can help to remove parasitic effects of the peripheral circuits and of the array organization.
Indeed, it is possible to extract programing window (PW) by mapping the memory array in erased and programed state. While, by changing the current reference register value available in the test chip, one can obtain the VT bitmap at
different reference current and evaluates the transconductance (GM) distribution. Of course, because all cells information are
saved between two test chip states, the great enhancement of bitmap analysis is two follow any of these parameters during
Fig. 3. (a-c) Iterative SPI reading by applying a ramped control gate voltage on cells through the analog pad. (d) VT =VGi, when the drain current of read cell
becomes higher than the reference current. (e) A resulting distribution of VT. To generate a bitmap (f), the data should be processed through the pipeline.
(g) Data process using similar operation on state or site with the possibility to loop over the correction, extraction, and filtering and refine the results. (a.u.)
Fig.4 Example of the same testchip bitmap representation using linear and normalized scale. ATTENTION a.u. DANS LES ECHELLES
Data sorting by
state and site
Arithmetic
correction
Parameter
extraction
Filtering cells
population
Bitmap
visualization
Distribution
SCLK MOSI MISO SS VG Time Analog pad =Vg(a)
SPI pads(b)
(c)
Num b er of c ell s (log .) Threshold voltage (V)(d)
I D VG VGi VGi+1 VGi+2 Reference current(e)
(g)
(f)
Threshold voltage (u. a.)
Linear scale Normalized scale Threshold volta ge (u. a. ) Thre shold volt age (u. a. )
any test chip reliability test. Parameter shift and normalized parameter variation may be recorded.
D. Bitmap aritmetical correction
When studying the embedding of a given memory technology inside a new test chip design or when evaluating the memory defectivity during reliability stress, it is useful to shadow or to subtract any effect on VT dispersion whose roots
are identified. In this article, we propose to correct arithmetically the VT bitmap using different spatial pattern.
Various memory zones can be corrected comparing their average VT to the global test chip VT average.
Where VTcor. is the corrected VT of a cell of coordinates x
and y in the memory array and of initial threshold voltage VTi.
E(VTpat.) is the VT mean of the pattern to whose belongs the
cell (x ,y). E(VTall) is the mean VT of the whole testchip cells
population.
Corrections due to peripheral circuit effects can be additive following their root causes. For example, the sense amplifier offset, which is present here, and any wordlines sector corrections can be added as they are linked respectively to reading and programing operations. In our test, we focus on sense amplifier circuit offset correction. This controls 32768 bits that share the same VT offset. This effect is highlighted on
bitmap by the columns pattern, in Fig. 5(b), while we can evaluate the offset of each amplifier by measuring the VT
mean by bitline as in Fig. 5(a). Disparities of VT mean due to
the amplifiers offset are as high as 150mV. VT corrections
using sense amplifier-defined pattern are presented in Fig. 5(a)
and (c). All BLs are now aligned at the same mean value except for border and near strap cells. Hence this correction is very efficient to correct this peripheral circuit effect. The result highlights other spatial VT
non-uniformity which are discussed in the next section. Correction of all bitlines and wordlines shift, as described in Fig. 5(a) and (c), is another correction presented here. It aims to remove any extrinsic variability to reach the cell-related variability.
Moreover, when multiple cell population test chip are used, any misalignment of a test chip distribution compared to the other test chips will shadow the extrinsic cells with the intrinsic of the test chip which has the lowest mean VT. Hence,
another arithmetic correction presented in this paper is used to center all testchip distributions on the same mean value.
E. Read disturb assessment
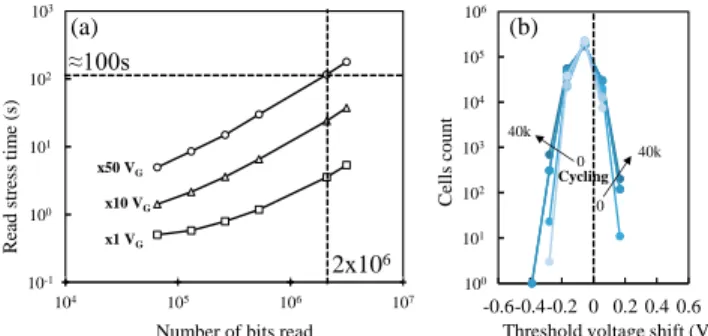
One of the main challenges of this method is to be sure to do not disturb data by the repetitive stress applied during reading. Indeed, depending on distribution/bitmap bins number, as in Fig.6 (a) reading operation can be time consuming. While initial memory state is largely insensitive to low electric field stress, stressed/degraded cells can loss rapidly charges if read voltage for distribution or bitmap are applied during a long time. For the test chips considered in this study, the Fig. 6(b) shows the immunity of our memory to read stress, after 10 consecutive read operations of an half memory array (256kB). Mean VT shift of 10mV is observed
while cycling (used to degrade the cell) only increases the dispersion.
IV. RESULTS AND DISCUSSION
In this section, the potentialities of our bitmap tool are discussed based on our test chip with its 512kB of embedded Flash memory. First, a study of fresh written cells programing conditions highlights the distinctive feature of border and strap neighboring cells population. Then fresh state example is used to show the impact of bitmap correction and the extraction of GM. Finally, the drain disturb is studied to extract specific
information on cells population.
A. Written cells at fresh state : border arrays
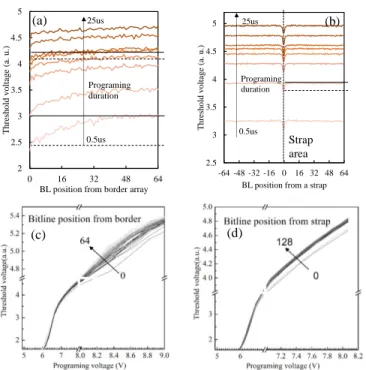
From Fig. 5, when bitmap correction is applied to sense amplifier offset, two extrinsic populations are highlighted. These populations are the border array cells population and the near-strap cells population. To study the two populations of cells, we propose here to use the topologic data of our bitmap tools associated with the trimming register possibility of the test chip to see the programing behavior of the two cells population. Sectors of our test chip are written with programing time from 0.5us to 25us and with programing gate voltage from 5V to 8V. The result is described Fig 7. The programing kinetic of this Flash cell [18] is first steep but slow down after to reach a quite asymptotic value. Thus cells with not optimized geometry or programing conditions will be more impacted by a lower programing time since their programing efficiency differs from normal cells.
Fig. 5. (a) Description of peripheral signature. (b and c) Examples of threshold voltage bitmap of a half memory array 256kB. ((B) HV and (A) reading circuit), (C) process induced impact, and (D) memory array architecture effect (strap used to reduce poly-lines resistivity).
Fig. 6. (a) Read duration in function of number of bits read and the number of VG increment. In this paper, we use 100mV increment on a 0V to 5V
window to read 2M bits. (b) Distribution of shift of threshold voltage of 65k cells after 10 reading at each cycling step.
Mean th res h o ld v o lt ag e (a. u .) 4.1 4.2 4.3 4.4 4.5 0 256 512 768 1024 1280 1536 1792 2048 4.1 4.2 4.3 4.4 4.5 4.1 4.2 4.3 4.4 4.5 Bitline number ECC area Bitline decoder A C D No correction
Sense amplifiers offset correction
Bitlines offset correction
No correction Sense amplifiers offset correction Bitlines offset correction (a) (b) (c) 10-1 100 101 102 103 104 105 106 107 Read s tres s ti m e (s )
Number of bits read
x1 VG x10 VG x50 VG 100 101 102 103 104 105 106 -0.6-0.4-0.2 0 0.2 0.4 0.6 Cel ls co u n t
Threshold voltage shift (V)
Cycling (a) (b) 2x10⁶ ≈100s 0 40k 0 40k
For border array cells population, in Fig. 7(a), it is clear that the geometry of the stack has a large impact over the VT
dispersion. Longer programing time will decrease the difference between border array and center arrays cells. Thus it will tighten the VT dispersion. About cell position from the
strap connections, Fig. 7(b) shows that the cell programing efficiency is very similar along the wordline between two straps. However we observe that the first cell, neighbor of the strap area, is impacted with a lower mean VT around 200mV.
This shift is moreover relatively constant with programing time.
About programing voltage trimming, described in Fig. 7(c), border array cells population have a dependence with programing voltage that differs from center cells, with a mean VT which smoothly increased as cells draw away from the
border. While for strap area impact (Fig 7(d)), we see that only the first cells saw its dependence to VG change.
The first population is related to the fabrication of the poly stack patterning. Indeed, the resin deposition before this process operation is not uniform in thickness at the edges of the array. This causes a variation of poly stack length not negligible after the gate patterning [12]. The use of dummies memory cells around the memory array as sacrificed area overcome generally the problem but the number of sacrificed bitlines and wordlines needs to be optimized in order to not lose too much area. This explains the lower performance of border cells about programing efficiency and their lowest initial VT.
However for the strap location, the effect is clearly due to the memory array layout. Because the impact is very binary (it impacts only the neighbor cells), it is due to change of the environment of the impacted cell. This can either come from a process-induced non-conformity at the matrix redundancy break or from a change in cell operating conditions, like a parasitic capacitive coupling between dummies metal or poly line inside the straps connection areas. This may explains why larger programming time does not change the difference between the cell VT and the mean VT while dependence with
VG is altered.
B. Written cells at fresh state : Defectivity correction We have shown that identifying the pattern, due to peripheral and array organization, it is easy to adjust the parameters by the arithmetical method proposed above. This method rely on the fact that distribution misalignment between test chips and inside a single test chip memory array are small variation of parameters which, at first order, are considered as linear (on the correction range). For example, the sense amplifier circuit generates an offset voltage when comparing IRef and the read cell current. This current offset is
taken as threshold voltage offset as shown in Fig. 3(c). The correction is possible since the current-voltage characteristics of a memory cell around threshold voltage (VT) is known.
Similarly band gap voltage and reference current circuits offset can be two factors that justify the misalignment between test chips.
Fig. 7. Study of impact of test chip trimming on threshold voltage dispersion
induced by peripheral circuit effect. A different programing duration is applied through register trimming value to each sectors of the array (1), the result has been normalized (2) and extrinsic cells have been extracted (3). A clear increase of strap impact on threshold voltage can be spotted
Fig. 8. 2M cells distribution before and after correction (sense
amplifier and bitlines/wordlines offset correction). slope β is plotted in the inset showing the whole distributions, while the effect on the extrinsic tails extrapolation is in the main chart.
Fig. 9. (a) Four test chips distribution used here are plotted. (b) Example of bitmap
distribution in normal scale before and after 2 types of corrections, impact on the extrinsic tails defectivity (in the main chart), and on the slope β or dispersion (inset).
2 2.5 3 3.5 4 4.5 5 0 16 32 48 64 Th re shold vo ltag e (a . u.)
BL position from border array Programing duration 0.5us 25us (a) 2.5 3 3.5 4 4.5 5 -64 -48 -32 -16 0 16 32 48 64 Thr eshol d volt ag e (a . u.)
BL position from a strap
Strap area Programing duration 0.5us 25us (b) (c) (d) -5.5 -5 -4.5 -4 -3.5 -3 -2.5 -2 2 2.5 3 3.5 sig ma
Threshold voltage (a. u.)
Sense amplifiers offset corrections
Bitlines and wordlines corrections No corrections -6 -4 -2 0 2 4 6 2 4 6 si gm a VT (a. u.) β=4.56 β=4.32 β=4.16 100 101 102 103 104 105 106 3 4 5 6 7 Numbe r of c ell s
Threshold voltage (a. u.)
(a) (b) -5.5 -5 -4.5 -4 -3.5 -3 -2.5 -2 2 2.2 2.4 2.6 2.8 3 3.2 3.4 sig ma
Threshold voltage (a. u.)
Sense amplifiers offset corrections
Inter-site offset corrections
No corrections -6 -4 -2 0 2 4 6 1.5 22.5 33.5 44.55 5.5 sig m a VT β=4.42 β=4.01 β=3.82
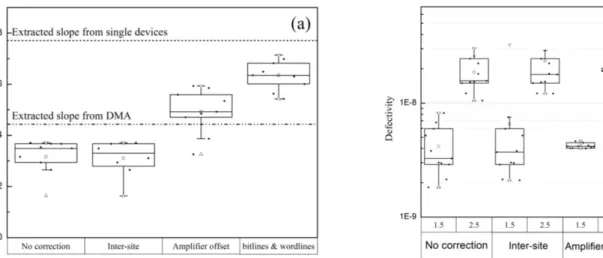
We apply progressively multisite correction, and then the sense amplifier offset or bitlines and wordlines corrections on 10 test chips population. Examples of distribution are shown Fig. 8 and Fig 9. Extrinsic cells (mainly border population) are visible at the tail of the distribution and are highlighted by the correction. The slope of the distribution (β) and the extracted defectivity at reading voltage (either 1.5V or 2.5V) are collected respectively in the Fig. 10(a) and (b). The correction impact tends to increase the distribution slope (and decreasing data dispersion) compared to no correction bitmap and to increase towards the single cell or DMA distribution slope. Sense amplifier correction successfully increases the distribution toward the DMA obtained value. Indeed DMA and the corrected bitmap are still impacted by the two extrinsic populations. Defectivity is linked to the extrinsic population and is extrapolated using exponential regression at the distribution tail. Thus the sense amplifier offset correction gives the best improvement by centering all extrinsic population and allows a better determination of the defectivity.
C. Transconductance extraction
The transconductance is represented in Fig. 11 by measuring the VT at two different IRef. For 3 points GM
extraction, a good coefficient correlation, mean value above 98.5%, proved that the extraction method is successful (values not shown here). However, compared to single cell or DMA, the mean GM seems shifted to lower value for test chip
extraction. As stated in Fig. 11, the reference current has a huge impact on transconductance whatever the source of the extraction (single device, DMA, bitmap). It is clear that the test chip GM is impacted by IRef comparison and by the IRef
generation circuit. To improve this extraction, Iref should be
monitored for each of its register values. D. Drain disturb study
To show more advantages of this method, drain stress will be applied on test chips. Stress conditions are summarized in table II. Drain disturb will highlight the possibility to follow the different population of cells during a similar stress and to improve the results by applying correction on bitmap.
TABLE II DRAIN STRESS CONDITIONS
a. Readout at 0s,0.1s,0.4s,1.3s,4s,12.1s,36.4s,109.3s
In order to reproduce the drain voltage stress conditions sustained by unselected neighbor cell sharing the same bitline during a programing operation, a constant voltage on drain side is applied. One effect is to induce hot hole injection due to Band to Band tunneling near the overlapping region [19][20][21][22]. The injection of hot carrier will decrease the stored charge and thus the threshold voltage for programed cells. The efficiency injection is a combination
Fig.10. (a) Extracted slope and (b) defectivity extrapolated at reading voltage of 1.5V and 2.5V from 10 test chips, before correction, after inter-site corrections, and after sense amplifier offset or bitlines/wordlines offset corrections. For distribution data dispersion (or slope), 100 single devices distribution are used to extract a reference slope, while 1024 bits distribution is used for DMA slope.
Fig. 11. Transconductance measured at 2, 3 and 4 uA for single cells (on 36 device), DMA on test chip (256 bits), and bitmap (2048 bits) using equivalent reading conditions.
Test
Test structure Condition
Test
chip Memory area (kB) Duration(s) Voltage(V)
A 3 262kB ≈110a 3.75 B 4.23 C 4.55 D 4.91
between a lateral field due to the drain/bulk junction and a vertical field created between the floating gate and drain terminal.
E. Drain disturb depending on cells population
The improvement of bitmapping is also to follow the cell population during a similar stress and to follow their evolution during the whole test. In our case, we applied a drain stress with different drain voltage conditions (from 3.75V to 4.91V) during 110s summarized on table II. The study is focused on border array population which have a lower programing efficiency (see section IV-A). A filter is applied on data to extract either the global test chip population (2M bits) or the border population of the top 32 control gates (65536 bits). The mean VT, mean threshold shift
(VT) and the threshold shift normalized by the initial
threshold (|VT|VTi) of the main population and the border
population are displayed Fig.12. While the average VT during
the stress of each population seems equivalent, VT shift is
lower for border array cells. However, it seems at first glance not contradictory as border array cells have a lower initial VT
compared to main population, hence the electric field induced by floating gate is initially lower and the charge loss at the end is also smaller. Nevertheless the |VT|VTi evolution is
more explicit as it shows also a smaller charge loss for border cells. This is clearly indicative of the process induced border effect that impacts cell geometry in such a way here, that it increases the immunity to drain disturb. The evidence of that can be visualized either on bitmap on Fig.12(d), (e) and (f) which describes the population out of the 3sigma window for VT, VT and |VT|VTi of a given test chip. The dependence of
these parameters versus time for both populations is also
displayed Fig. 12(a), (b) and (c). They all show the obvious tendency of border cell to be less disturbed by the drain stress.
TABLE III MEAN NORMALIZED SHIFT OF THRESHOLD VOLTAGE VERSUS TIME
Dain voltage conditions
Power law versus time : |VT|VTi (t)=AtB
Slope (B) Origin (A)
Main Border Main Border
3.75 0.11 0.13 0.08 0.06 4.55 0.14 0.16 0.24 0.2 4.91 0.22 0.24 0.31 0.27
The bitmap can be used to extract specific model parameters for each population. As described in table III, modelling |VT|VTi evolution with the time shows that border
population has a slightly steeper slope (A) and lower origin (B) compared to main population.
The bitmaps of Fig. 12(d) and (f) show the effect of sense amplifier offset correction on 3 sigma population. Without correction, border population is mixed with the lowest amplifier offset sector. Fig. 12(e) displays VT after the stress
in grey scale. Vertical signatures can be seen which suggest a variation of drain voltage applied during drain stress for each bitlines. Finally, we can observe some other effects of array organization highlighted by the drain disturb test. Indeed, in Fig. 12(e), we show some lighter area near the border of the matrix along bitlines and wordlines. This corresponds to the area with a higher sensitivity to drain disturb. The effect on
Fig. 12. The evolution of VT, δVT and |δVT|VT of main and border array population are described respectively in figure (a) (b) and (c). Test A,B,C,D are
represented respectively with triangles, square circle and cross. The 3sigma population of are extracted and filter to be represented by red points (+3 sigma over the mean) or by green points (-3 sigma below the mean) for: (d) threshold voltage VT, (e) the mean variation of threshold voltage using initial VTi as
reference, and (f) the normalized mean variation of threshold voltage |VT|VTi. 1.5 1.7 1.9 2.1 2.3 2.5 2.7 2.9 3.1 3.3 3.5 0.1 1 10 100 1000 Mea n Thr eshol d volt ag e (V ) Stress time (s)
Border array cells Whole population
(a) V
T 0 0.5 1 1.5 2 2.5 0.1 1 10 100 1000 Me an Th re shold vo ltag e shift (V) Stress time (s) Drain voltage : 3.75V 4.55V 4.91VBorder array cells Whole population (b) δVT 0 0.1 0.2 0.3 0.4 0.5 0.6 0.1 1 10 100 1000 Norm ali z ed m ean Thr eshol d volta g e shift Stress time (s) Drain voltage : 3.75V 4.55V 4.91V
Border array cells Whole population (c) |δVT|VTi -3s:7.5V +3s:5V Before correction After correction
(d) V
TThreshold voltage shift (V) -3s:0.92V
+3s:2.38V
(e) δV
T -3s:0.29% +3s:0.64% Before correction After correction (f) |δVT|VTithe bitlines can be explained by the bulk voltage increasing in the array center due to the high bulk resistivity. Moreover, it decreases the vertical electric field between floating gate and bulk in the center of the array, thus the charge loss rate during drain disturb. The same effect along wordlines should be studied more thoroughly.
V. CONCLUSION
Embedded Flash memory is today confronted to challenging requirements for various applications aggravated by an aggressive scaling. Complementary development between the memory technology and the product design is needed to obtain the most reliable and efficient use of the memory. This is why testchip testing is a compulsory step between single cell and final product as it presents a large statistics of cells, in a product-like environment, together with a quite flexible testability. While generally only distribution are extracted from such a device, we show that applying analog bitmapping to obtain topologically ordered memory cell information (either VT or other parametric properties)
can bring large insights on the integration of a given memory technology inside product-like memory array. Thus it enables the understanding of different effects behind VT variation
inside a population, to separate these mechanisms from process induced variation or within die variation (RTN, BTI). It allows also to evaluate their impact, if they can be correlated with a systematic pattern linked either to the peripheral circuit, the array organization or the process. Finally correction or filtering of such data by the identifying pattern highlight the populations of extrinsic cells and improve the memory defectivity. Reliability test using bitmap analysis gives then the possibility to follow degradation of weak population compared to the main one, whereas corrected defectivity extraction can show the impact of each of these population on the defectivity evolution.
REFERENCES
[1] P. Cappelletti, R. Bez, D. Cantarelli, and L. Fratin, "Failure mechanisms of flash cell in program/erase cycling," Proceedings of
1994 International Electron Devices Meeting, pp.291-294.
[2] G. Ghidini, Microelectronics Reliability, 2012.
[3] H. Aziza, J. M. Portal, D. Nee, C. Reliaud and F. Argoud, "Peripheral Circuitry Impact on EEPROM Threshold Voltage," Proceedings of
2007 Non-Volatile Memory Technology Symposium, pp.20-24.
[4] T. Himeno; et al., ICMTS 1995, Mar. 1995.
[5] R. Strenz, "Embedded Flash technologies and their applications: Status amp, outlook," Proceedings of 2011 International Electron Devices
Meeting, pp.9.4.1-9.4.4, Dec. 2011.
[6] P. Poliakov, P. Blomme, A. V. Pret, M. M. Corbalan, R. Gronheid, D. Verkest, J. Van Houdt and W. Dehaene, "Induced Variability of Cell-to-Cell Interference by Line Edge Roughness in nand Flash Arrays,"
IEEE Electron Device Letters, vol.33, no.2, pp. 164-166, Feb. 2012.
[7] T. Kim, D. He, R. Porter, D. Rivers, J. Kessenich and A. Goda, "Comparative Study of Quick Electron Detrapping and Random Telegraph Signal and Their Dependences on Random Discrete Dopant in Sub-40-nm NAND Flash Memory," IEEE Electron Device Letters, vol.31, no.2, pp.153-155, Feb. 2010.
[8] A. B. Manut, J. F. Zhang, M. Duan, Z. Ji, W. D. Zhang, B. Kaczer, T. Schram, N. Horiguchi and G. Groeseneken, "Impact of Hot Carrier Aging on Random Telegraph Noise and Within a Device Fluctuation,"
IEEE Journal of the Electron Devices Society, vol. 4, no. 1, pp. 15-21,
Jan. 2016.
[9] S. M. Amoroso, A. Ghetti, A. R. Brown, A. Mauri, C. Monzio Compagnoni and A. Asenov, "Impact of Cell Shape on Random Telegraph Noise in Decananometer Flash Memories," IEEE
Transactions on Electron Devices, vol.59, no.10, pp.2774-2779, Oct.
2012.
[10] M. Simicic, V. Putcha, B. Parvais, P. Weckx, B. Kaczer, G. Groeseneken, G. Gielen, D. Linten and A. Thean, "Advanced MOSFET variability and reliability characterization array," Proceedings of 2015 IEEE International Integrated Reliability Worksho, pp.73-76, Oct. 2015.
[11] N. R. Mielke, "New EPROM Data-Loss Mechanisms," Proceedings of
1983 International Reliability Physics Symposium, pp.106-113, Apr.
1983.
[12] E. A. Agharben, A. Roussy, M. Bocquet, M. Bileci, S. Bégouin and A. Marchadier, "Critical sensitivity of flash gate dimension spread on electrical performances for advanced embedded memory," Proceedings
of 2015 26th Annual SEMI Advanced Semiconductor Manufacturing Conference, pp.401-404, May. 2015.
[13] M. Mariani L. Canevari and C. Romanelli, "Poly-CMP integration for sub 90 nm self-aligned floating gate flash memories," Proceedings of
2007 International Conference on Planarization / CMP Technology,
pp. 1-6.
[14] K. Seidel, T. Müller, T. Brandt, R. Hoffmann, D. A. Löhr, T. Melde, M. Czernohorsky, J. Paul, and V. Beyer, "Electrical analysis of unbalanced Flash memory array construction effects and their impact on performance and reliability," Proceedings of 2009 10th Annual
Non-Volatile Memory Technology Symposium, pp. 72-76.
[15] P. Canet, J. Postel-Pellerin, H. Aziza, "Impact of resistive paths on NVM array reliability: Application to Flash & ReRAM memories,"
Microelectronics Reliability, vol.64, no., pp. 36-41, 2016.
[16] Giulo G. Marotta, Giovanni Naso, and Guiseppe Savarese , Memory
Circuit technologies, in Nonvolatile Memory Technologies with Emphasis on Flash, John Wiley & Sons, Inc., 2008, pp.179-222
[17] T.Kempf, M. Mantelli, F. Maugain, A. Regnier, J.M. Portal, P. Masson, J.M. Moragues, M. Hesse, V. della Marca, F. Julien and S. Niel, “Impact of CMOS post nitridation annealing on reliability of 40nm 512kB embedded Flash array,” unpublished, presented at Proceedings
of 2017 International Integrated Reliability Workshop.
[18] V. Della Marca, G. Just, A. Regnier, J.-L. Ogier, R. Simola, S. Niel, J. Postel-Pellerin, F. Lalande, L. Masoero and G. Molas, "Push the flash floating gate memories toward the future low energy application ,"
Solid-State Electronics , vol.79, no., pp.210 - 217, Jan. 2013.
[19] Yung-Huei Lee, Mielke, N., McMahon, W., Lu, Y.-L.R., Qingru Meng and Linda Jiang, "Drain Read Disturb Assessment of NOR Flash Memory," Proceedings of 2008 VLSI Technology, Systems and
Applications, pp.83-84, Apr. 2008.
[20] C. Dunn, C. Kaya, T. Lewis, T. Strauss, J. Schreck, P. Hefley, M. Middendorf and T. San, "Flash EPROM disturb mechanisms,"
Proceedings of 1994 International Reliability Physics Symposium,
pp.299-308, Apr. 1994.
[21] D. Ielmini, A. Ghetti, A. S. Spinelli and A. Visconti, "A study of hot-hole injection during programming drain disturb in flash memories,"
IEEE Transactions on Electron Devices, vol.53, no.4, pp.668-676, Apr.
2006.
[22] M. De Tomasi, R. E. Vaion, L. Cola, P. Zabberoni and A. Mervic, "Drain stress influence on read disturb defectivity," Proceedings of
2013 IEEE International Reliability Physics Symposium,
pp.MY.12.1-MY.12.5, Apr. 2013. .