Climate change reduces winter overland travel across the Pan-Arctic
even under low-end global warming scenarios
To cite this article: Anne Gädeke et al 2021 Environ. Res. Lett. 16 024049
View the article online for updates and enhancements.
OPEN ACCESS
RECEIVED
1 October 2020
REVISED
13 January 2021
ACCEPTED FOR PUBLICATION
18 January 2021
PUBLISHED
10 February 2021
Original content from this work may be used under the terms of the Creative Commons Attribution 4.0 licence. Any further distribution of this work must maintain attribution to the author(s) and the title of the work, journal citation and DOI.
LETTER
Climate change reduces winter overland travel across the
Pan-Arctic even under low-end global warming scenarios
Anne Gädeke1, Moritz Langer2,3, Julia Boike2,3, Eleanor J Burke4, Jinfeng Chang5,6,
Melissa Head7, Christopher P O Reyer1, Sibyll Schaphoff1, Wim Thiery8,9and Kirsten Thonicke1
1 Potsdam Institute for Climate Impact Research, Member of the Leibniz Association, Telegrafenberg, 14412 Potsdam, Germany 2 Alfred Wegener Institute, Helmholtz Center for Polar and Marine Research, Telegrafenberg, Gebäude A45, Potsdam 14473, Germany 3 Geography Department, Humboldt Universität zu Berlin, Unter den Linden 6, 10099 Berlin, Germany
4 Met Office Hadley Centre, FitzRoy Road, Exeter EX1 3PB, United Kingdom
5 College of Environmental and Resource Sciences, Zhejiang University, 310058 Hangzhou, People’s Republic of China 6 Laboratoire des Sciences du Climat et de l’Environnement, CEA-CNRS-UVSQ, 91191 Gif-sur-Yvette, France 7 Alaska Department of Natural Resources, Fairbanks, AK, United States of America
8 Department of Hydrology and Hydraulic Engineering, Vrije Universiteit Brussel, Pleinlaan 2, 1050 Brussels, Belgium 9 Institute for Atmospheric and Climate Science, ETH Zurich, Universitaetsstrasse 16, 8092 Zurich, Switzerland E-mail:a.gaedeke@gmail.com
Keywords: permafrost, climate change, land surface models, Arctic transport, winter roads, ice roads, Arctic accessibility Supplementary material for this article is availableonline
Abstract
Amplified climate warming has led to permafrost degradation and a shortening of the winter
season, both impacting cost-effective overland travel across the Arctic. Here we use, for the first
time, four state-of-the-art Land Surface Models that explicitly consider ground freezing states,
forced by a subset of bias-adjusted CMIP5 General Circulation Models to estimate the impact of
different global warming scenarios (RCP2.6, 6.0, 8.5) on two modes of winter travel: overland
travel days (OTDs) and ice road construction days (IRCDs). We show that OTDs decrease by on
average
−13% in the near future (2021–2050) and between −15% (RCP2.6) and −40% (RCP8.5)
in the far future (2070–2099) compared to the reference period (1971–2000) when 173 d yr
−1are
simulated across the Pan-Arctic. Regionally, we identified Eastern Siberia (Sakha (Yakutia),
Khabarovsk Krai, Magadan Oblast) to be most resilient to climate change, while Alaska (USA), the
Northwestern Russian regions (Yamalo, Arkhangelsk Oblast, Nenets, Komi, Khanty-Mansiy),
Northern Europe and Chukotka are highly vulnerable. The change in OTDs is most pronounced
during the shoulder season, particularly in autumn. The IRCDs reduce on average twice as much as
the OTDs under all climate scenarios resulting in shorter operational duration. The results of the
low-end global warming scenario (RCP2.6) emphasize that stringent climate mitigation policies
have the potential to reduce the impact of climate change on winter mobility in the second half of
the 21st century. Nevertheless, even under RCP2.6, our results suggest substantially reduced winter
overland travel implying a severe threat to livelihoods of remote communities and increasing costs
for resource exploration and transport across the Arctic.
1. Introduction
The relatively pristine permafrost landscapes in the Arctic are undergoing profound changes due to increased socio-economic development (Orians et al 2003, Raynolds et al2014) combined with amplified climate warming (IPCC2019). Climate-induced per-mafrost degradation (Biskaborn et al2019, Vasiliev et al 2020) has in many places already resulted in
active layer deepening (Schuur et al 2008), ther-mokarst development (Farquharson et al2019), soil instability (Nelson et al 2001), and changes in ter-restrial (Wotton et al 2017) and aquatic ecosys-tems (Vonk et al2015). Permafrost degradation has also strong implications for existing infrastructure (Linden 2000, Shiklomanov et al 2017, Hjort et al 2018) including overland transportation systems and winter roads (Stephenson et al2011, Hori et al2018).
a) b)
c) d)
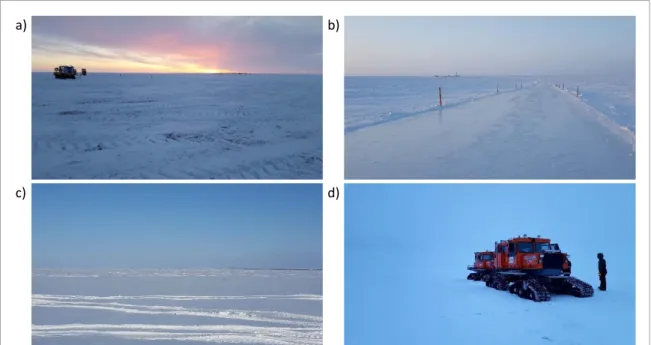
Figure 1. Photos showing winter travel activities across the tundra on the North Slope of Alaska. Shown are (a) snow pre-packing activities prior to preparing the surface of the ice road (ice thickening), (b) a constructed ice road on the North Slope of Alaska (Pikka field region), (c) traces of seismic trails across the tundra, and (d) low impact vehicles used to travel across the tundra (Tucker Terra 1600). Photos were taken by Melissa Head on the North Slope of Alaska.
Overland travel in the Arctic is most cost effective and least environmentally damaging dur-ing winter when the ground (active layer) and inland lake and river surfaces are frozen and snow covered (Forbes 1992). Frozen ground provides a hard surface for vehicles to travel across the oth-erwise boggy tundra environment. A sufficient snow cover is necessary (a) to protect the vegeta-tion and surface-organic layer, (b) to provide a bet-ter traction and (c) to maintain a sufficiently high albedo to better insulate the frozen ground/winter road after ground freezing/winter road construc-tion (Knowland et al 2010). The continuous per-mafrost zone, north of 60◦ latitude is sparsely pop-ulated (∼1 million people (2010, (GPWv4 2016)) and only little permanent infrastructure exists (e.g. scarce permanent road network, >500 settlements, 28 ports, >200 airports, figure S1 (available online at stacks.iop.org/ERL/16/024049/mmedia)). Winter mobility is therefore crucial for infrastructure devel-opment and maintenance, for natural resource exploration and extraction, and for supplying remote communities. Alternative transportation routes, such as air travel, are associated with much higher costs. Reliable overland access to remote Arctic regions is also crucial in the case of emergencies and envir-onmental disasters. Although not having occurred in winter, the Norilsk fuel spill during which 20 000 tons of diesel contaminated the tundra at the end of May 2020 dramatically showcased the vulnerability (Nechepurenko2020).
Overland travel during the Arctic winter is mainly facilitated by winter roads or off-road travel (figure1). Temporary winter transportation routes
over land are referred to as winter roads and over water bodies as ice roads (ACIA2005). Here we use the term ice roads to refer to ice pavements con-structed across frozen ground, lakes and rivers using compacted snow, applied ice caps, ice aggregates or groomed snow. Ice roads are common across the entire Arctic, with a road network of∼10 000 km in Canada alone (Barrette and Charlebois2018). A shortening of the ice road season length has been documented in the northern Baltic Sea (1974–2008) (Kiani et al2018) as well as in Arctic Canada (Zell 2014, Mullan et al2017) mainly caused by increasing winter air temperatures.
Off-road overland travel is characterized by dis-persed, temporary travel events and slower travel speed. It is common in areas where the construction of a permanent or ice road is not (economically) feas-ible. The subsistence lifestyle of many Arctic com-munities heavily relies on off-road overland travel for accessing hunting and fishing grounds during Octo-ber to July (Ford et al2006). Arctic communities have already reported damaged snowmobiles and sleds due to thinner snow cover (Ford et al 2006) and pro-longed muddy and boggy ground during the shoulder seasons. Reduced ice thickness of lake and river sur-faces have resulted in increased winter drownings caused by warmer winter temperatures (Sharma et al 2020). Seismic data acquisition, typically the first phase of oil and gas exploration, requires access across the tundra. The resulting vehicle trails (figure1(c)) present the single largest terrain disturbance gener-ated by the oil and gas industry in Arctic tundra landscapes (Orians et al2003, Jorgenson et al 2010, Raynolds et al2020).
The future of Arctic winter travel depends to a large extent on the future global temperature rise, but also on regional factors such as ground freezing states, snowfall and snow accumulation on the ground. Pre-vious research using monthly air temperature and snow water equivalent (SWE) from climate models suggest that ice road-accessible land area will decrease by on average −14% by mid-century (Stephenson et al2011). Similarly, Hori et al (2018) used freez-ing degree day accumulations to project a decrease in ice road construction conditions in Ontario’s Far North, Canada. Mullan et al (2017) projected an over-all decrease in the operation time window of the eco-nomically important Tibbitt to Contwoyto Winter Road within the Northwestern Territories in Canada. Owing to the socio-economic importance of overland access to and across the Arctic, it is of vital import-ance to assess the vulnerability of Arctic winter trans-port to amplified Arctic climate warming using dif-ferent climate change trajectories and by explicitly considering ground freezing states. Analyzing differ-ent climate change trajectories allows quantifying the impacts under warming associated with the Paris Agreement (keep warming below 2◦C compared to pre-industrial levels) and pathways leading to higher warming. So far, however, such a comprehensive ana-lysis is lacking.
Here we project the impact of low- to high-end climate change scenarios on the winter off-road over-land travel and on ice road construction using daily output of Land Surface Models (LSMs) to derive two indices: overland travel days (OTDs) and the ice road construction days (IRCDs). The comprehens-ive quantification of changes in winter travel across the Pan-Arctic is based on field observations, remote sensing data, and model simulations (table1). Daily simulated soil temperatures and snow depths were obtained from an ensemble of state-of-the art LSMs forced by a subset of bias-adjusted meteorological output from General Circulation Models (GCMs) of the Coupled Model Intercomparison Project Phase 5 (CMIP5) under three representative concentra-tion pathways (RCPs), representing low-, medium-and high-end global warming scenarios. Our study domain covers the continuous permafrost zone north of 60◦latitude and extends to the end of the century.
2. Methods
2.1. LSMs
We use a model ensemble consisting of four LSMs (JULES, ORCHIDEE-MICT, CLM4.5, LPJmL) cap-able of representing gradual permafrost freeze and thaw processes and that participated in the Inter-Sectoral Impact Model Intercomparison Project Phase 2b (ISIMIP2b, (Frieler et al2017)). The main characteristics of the models are detailed in table S1. The LSMs simulations were performed at a spatial resolution of 0.5◦ × 0.5◦ in latitude and longitude
in accordance with the ISIMIP2b modeling protocol (Frieler et al 2017). One exception is ORCHIDEE-MICT, which performed simulations at a spatial res-olution of 1◦× 1◦. The ORCHIDEE-MICT simula-tion results were transferred to a spatial resolusimula-tion of 0.5◦× 0.5◦for consistency with other models parti-cipating in ISIMIP by simply reducing the grid cells size (four 0.5◦× 0.5◦cells will have the same value as 1◦× 1◦).
We used the simulated daily soil temperatures up to a depth of ∼0.5 m and snow depths from the LSMs. The vertical soil discretization of each LSM and the number of soil layers included in the analysis are detailed in table S2. Simulated daily snow depths were available from LPJmL, ORCHIDEE-MICT and JULES. Our approach to derive daily snow depth for CLM4.5 is detailed in the supplementary material (text S1).
2.2. Climate and land-use forcing
The meteorological forcing for the LSMs was obtained from the bias-adjusted climate data of four CMIP5 GCMs: GFDL-ESM2M, HadGEM2-ES, IPSL-CM5A-LR, and MIROC5. The selection of these four GCMs within ISIMIP2b was based (a) on data avail-ability and (b) on their avail-ability to represent the range of the entire CMIP5 ensemble. A performance evalu-ation of the four ISIMIP GCMs relative to the entire CMIP5 ensemble is presented in figure S2 for our study domain over Asia and North America and for other regions in the supplementary material of Frieler et al (2017). The EWEMBI data set (Lange 2016) served as a reference for the trend-preserving bias-adjustment of the GCMs at a daily time step (Frieler et al2017). The GCMs were forced by annually chan-ging greenhouse gas concentrations during the period 1861–2005 (historical reconstruction). In the period 2006–2100, the radiative forcing of the GCMs fol-lowed low- (RCP2.6), medium- (RCP6.0) and high-end (RCP8.5) atmospheric greenhouse gas concen-trations and consequently different global warming levels. JULES was not forced with RCP8.5. The land-use conditions in the LSMs are detailed in text S2.
2.3. Winter travel indices
We introduce two main indices • OTDs (equation (S1)) and
• IRCDs) (equation (S2)) and two additional indices that are based on the main ones:
• Soil temperature days (STDs, equation (S3)) and • Snow depth days (SNDDs, equation (S4)).
The study set-up and the calculation of the OTDs and IRCDs is summarized in figure2. The OTDs are days when simulated soil temperatures in the upper ∼0.5 m of the soil column are below the grid cell spe-cific soil-type dependent freezing temperature (figure S3), i.e. the active layer is completely frozen, and snow
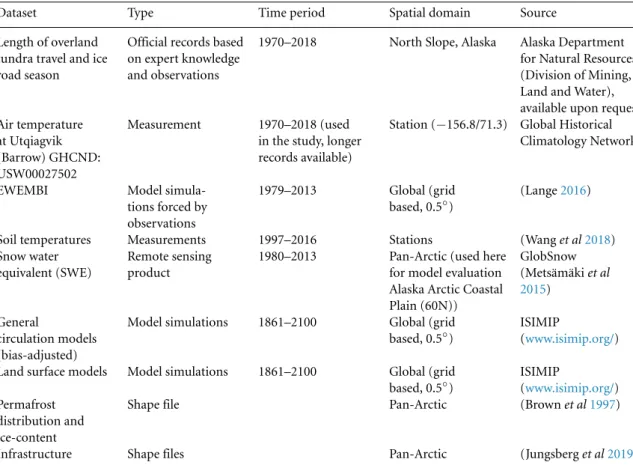
Table 1. Data sources.
Dataset Type Time period Spatial domain Source
Length of overland tundra travel and ice road season
Official records based on expert knowledge and observations
1970–2018 North Slope, Alaska Alaska Department for Natural Resources (Division of Mining, Land and Water), available upon request Air temperature
at Utqiagvik (Barrow) GHCND: USW00027502
Measurement 1970–2018 (used in the study, longer records available)
Station (−156.8/71.3) Global Historical Climatology Network
EWEMBI Model simula-tions forced by observations
1979–2013 Global (grid based, 0.5◦)
(Lange2016)
Soil temperatures Measurements 1997–2016 Stations (Wang et al2018) Snow water
equivalent (SWE)
Remote sensing product
1980–2013 Pan-Arctic (used here for model evaluation Alaska Arctic Coastal Plain (60N)) GlobSnow (Metsämäki et al 2015) General circulation models (bias-adjusted)
Model simulations 1861–2100 Global (grid based, 0.5◦)
ISIMIP
(www.isimip.org/) Land surface models Model simulations 1861–2100 Global (grid
based, 0.5◦) ISIMIP (www.isimip.org/) Permafrost distribution and ice-content
Shape file Pan-Arctic (Brown et al1997)
Infrastructure Shape files Pan-Arctic (Jungsberg et al2019)
depth is greater than 20 cm (figure2). The descrip-tion of the soil-type dependent freezing temperature is detailed in the supplementary material (text S3).
The IRCDs represent days when the daily mean air temperature is below−28◦C and the mean daily soil temperature is below the soil-type dependent freezing temperature in the upper∼0.5 m of the soil column (figure2). The IRCDs give the ideal conditions for ice road construction across lakes, rivers and the tundra (lakes and rivers are not explicitly considered in the LSMs). Ice roads are constructed by collecting avail-able ice and snow from lakes to form a road base and by spraying water on the base to build up an ice surface (minimum thickness∼15 cm). We defined the IRCDs based on industry standards for the Arc-tic Coastal Plain of Alaska (USA) (ConocoPhillips 2018) that correspond to criteria reported by Know-land et al (2010) and Lafrance (2007) from Arctic Canada (Northwestern Territories). Ice road con-struction is most efficient at daily mean air temperat-ures of−28◦C as the time it takes for the ice surface to build (sprayed water to freeze) balances well with the operational speed of water collection and flood-ing. The efficiency of the processes decreases at air temperature above−28◦C because the flooded water surface takes longer to freeze.
All indices were aggregated to monthly and annual values (July–June). The period 1971–2000 serves as reference, 2021–2050 as near future and 2070–2099 as far future scenario periods. Trends were calculated using linear regression analysis. The study
domain was the Pan-Arctic low-land continuous per-mafrost zone (based on Brown et al (1997)) north of 60◦ latitude excluding Greenland (figure S3). We further subdivide our study domain (9025 500 km2) into Russia (64.3%), Canada (29.9%), Alaska (USA, 5.4%), and northern Europe (0.4%; including Fin-land, Norway and Sweden) as well as into sub-regions, including states, provinces and or adminis-trative units (figure S4). Although winter travel also plays an important role in regions not underlain by continuous permafrost (both north and south of 60◦ latitude), they are not considered here.
2.4. Evaluation of LSMs
We evaluated the LSMs within a model evaluation region, defined as the continuous permafrost zone, north of 60◦ latitude in the state of Alaska (USA) (figure S3). The calculated OTDs based on LSM simu-lations were compared to officially permitted off-road tundra travel season length (d yr−1) for the North Slope of Alaska provided by the Alaska Department of Natural Resources (ADNR), Division of Mining, Land and Water for the period 1970–2018 (figures2 and3(a)). On the North Slope of Alaska, the tun-dra is opened for off-road travel when soil temper-atures are below−5◦C in the upper 30 cm of the soil column and snow depth is at least 15 cm in the Coastal areas and 23 cm in the Foothills (ADNR2015). For our LSM evaluation, we adopted the conservative estimate that simulated mean daily soil temperature within the entire column up to 50 cm (depending on
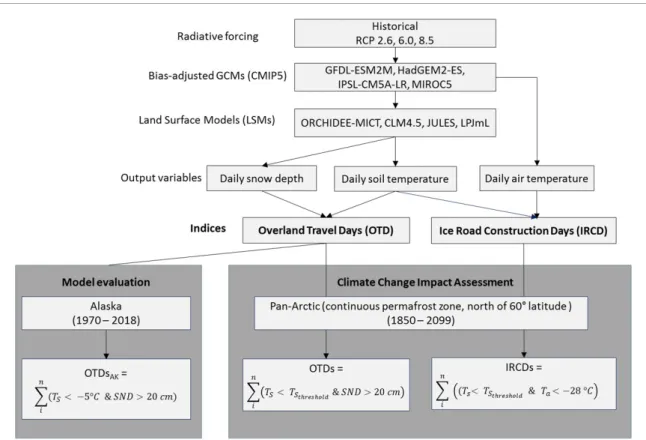
Figure 2. Study set up to calculate the indices overland travel days (OTDs) and ice road construction days (IRCDs). The radiative forcing of the four bias-adjusted CMIP5 GCMs consists of historical reconstruction (1861–2005) and a low- (RCP2.6), medium-(RCP6.0) and high-end (RCP8.5) greenhouse gas emission scenario (2006–2099). Meteorological output of the GCMs are used to force the four land surface models (LSMs). The simulated daily soil temperature (upper 0.5 m) and snow depth of the LSMs and air temperatures of the GCMs form the basis for calculating the OTDs and IRCDs. The calculation of OTDs was validated (1970–2018) for the Alaska model evaluation region (figure S3) based on officially permitted tundra travel seasons by the Alaska Department for Natural Resources (Division of Mining, Land and Water). The assessment covers the period 1850–2099 for the Pan-Arctic study domain.
LSM’s vertical soil discretization, table S2) is below −5◦C and snow depth is above 20 cm disregard-ing the difference between Coastal and Foothill areas (equation (S5)). For a consistent evaluation, we used GCMs instead of reanalysis data to force the LSMs during model evaluation. The GCM model evalu-ation forcing consists of historical climate reconstruc-tions for the period 1970–2005 and RCP6.0 data for 2006–2018.
Furthermore, we compared simulated against observed absolute soil temperatures, SWE, STDs and SNDDs. Measured soil temperature records at 25 boreholes at 0.75 m depth across the Alaska model evaluation region were obtained from Wang et al (2018). Simulated soil temperatures by the LSMs were extracted from the soil layers closest to 0.75 m (depending on vertical soil discretization) at the grid cells matching the borehole location. Simulated aver-age annual SWE was compared to the SWE obtained from remote sensing product GlobSnow (Metsämäki et al2015).
3. Results
3.1. Evaluation of LSMs
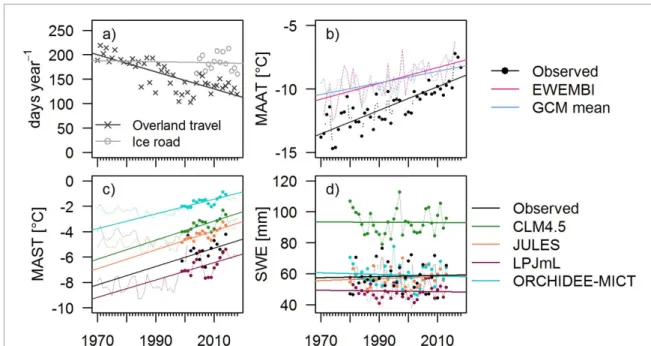
An increase in mean annual air temperature (MAAT) (−11.3 ◦C, 1970–2018) of +1.0 ◦C decade−1 has
been recorded at the weather station Utqiagvik loc-ated at the Beaufort Sea since 1970. Across the Alaska model evaluation region, the EWEMBI (−9.0 ◦C) and GCMs (−9.0 ± 0.4 ◦C) MAAT increased by +0.6◦C decade−1and by +0.5◦C decade−1, respect-ively (figures3(b), table 2, mean ± standard devi-ation among GCMs) over the period 1970–2018. Increasing MAAT coincides with increasing mean annual soil temperatures (MASTs) in both meas-urements (+0.7 ◦C decade−1) and LSM simula-tions (figures3(c), table2, 1999–2014). An MAST of −5.6 ◦C was recorded at a depth of 0.75 m when averaging over the 25 boreholes located in the model evaluation domain. LPJmL shows a cold-bias (−6.7 ◦C ± 0.4 ◦C) while JULES (−4.2 ± 0.3◦C), CLM4.5 (−3.4 ± 0.3◦C) and par-ticularly ORCHIDEE-MICT (−1.7 ± 0.2 ◦C) show a warm bias (table 2). Simulated annual average
SWE by JULES (58 ± 4 mm) and
ORCHIDEE-MICT (58 ± 3 mm) are consistent with the
observed SWE of 58 mm (1980–2013). CLM4.5 overestimates the SWE estimates by 35 mm yr−1 while LPJmL underestimates it by 9 mm yr−1. The SWE remained nearly unchanged over the period 1980–2013 (+0.03 mm yr−1) which is reproduced by the LSM simulations (figures 3(d), table2).
Figure 3. Overview of model evaluation based on field observations. The officially permitted overland travel (1970–2018) and ice road season (2004–2018) for the North Slope of Alaska (a), measured and simulated mean annual air temperature (MAAT) (b), soil temperature (MAST) (c) and snow water equivalent (SWE) (d). Observed MAAT (1970–2018) at Utqiagvik (Barrow) station located on the coast of the Beaufort Sea. MAAT of the EWEMBI data set (Lange2016) and the multi-model mean of four bias-corrected GCMs (GFDL-ESM2M, HadGEM2-ES, IPSL-CM5A-LR, MIROC5) are the average over the Alaska study domain (figure S3). Measured MAST was obtained from Wang et al (2018) and represents the mean of 25 stations at depth 0.75 m with record lengths >10 years. Average measured SWE (GlobSnow, Metsämäki et al2015) and simulated SWE by the LSMs present the average over the model evaluation. Thick lines represent linear trends (linear regression), the points represent observations (or years when simulations overlap with measurements). Dotted lines show the variability within simulations for periods when no measurements are available.
The officially permitted off-road overland tun-dra travel season of 157 d yr−1 has decreased by 1.7 d yr−1 on the North Slope of Alaska over the period 1970–2018 (∼80 d in total) while the ice road season remained nearly constant (−1.5 d dur-ing 2004–2018, figure 3(a)). The LSMs reproduce the decreasing number in annual OTDs, although underestimating the trend (figure 4(a), table 2). CLM4.5 simulates similar negative trends of OTDs to that from the observations (−1.7 d yr−1, CLM4.5: −0.8 ± 0.3 d yr−1) but shows a larger difference to the average officially permitted season length (−31 d yr−1). JULES (−4 d yr−1) and LPJmL (+6 d yr−1) (figure4(b)) agree better with the average permitted season length, but underestimate the trend. The LSMs simulated a negative trend in STDs and consistently no trend in SNDDs (details in text S4)
4. Future climate impacts on winter
off-road OTDs and IRCDs
The different global warming levels translate into an increase in MAAT from−13 ± 1◦C in the reference to between−10 ± 1◦C (RCP2.6) and−9 ± 1◦C (RCP8.5) in the near future and between−9 ± 1◦C (RCP2.6) and−4 ± 2◦C (RCP8.5) in the far future across the Pan-Arctic (figure S5, table S3). Warm-ing in winter is estimated to be stronger than in summer, especially in the far future. Total annual
precipitation of 334± 15 mm is projected to increase in both the near (13% (RCP2.6)–16% (RCP8.5)) and the far future (14% (RCP2.6)–32% (RCP8.5)), which is primarily driven by increasing precipitation during October to May (19%–22% (2021–2050), 21%–47% (2070–2099)). In the far future period, the variab-ility across the GCMs is larger under the high-end (RCP8.5) compared to medium- (RCP6.0) and low-end global warming levels (RCP2.6).
The moderate decrease in SNDDs and strong decrease in STDs (details see text S5) coincides with decreasing OTDs across the Pan-Arctic (figure 5). Average annual OTDs are projected to decrease from 173± 25 d yr−1in the reference (mean± standard deviation among LSMs) to on average 151 d yr−1 in the near future with only small (±3 d yr−1) differences across the RCPs (table 3). In the far future, the initial reduction in OTDs stabilizes (table S4, all trends p > 0.1) under RCP2.6. Under RCP6.0 and RCP8.5, OTDs continue to decrease to 128± 33 d yr−1and 103± 43 d yr−1, respectively, at the end of the century. The decrease in OTDs is stat-istically significant (p < 0.001) under RCP8.5 in the near (except for LPJmL) and far future. Simulations based on ORCHIDEE-MICT have the lowest num-ber of OTDs during the reference period. The decline simulated by ORCHIDEE-MICT is comparable to CLM4.5 in the near and far future under all RCPs as shown in absolute values in table3and as trends in table S4.
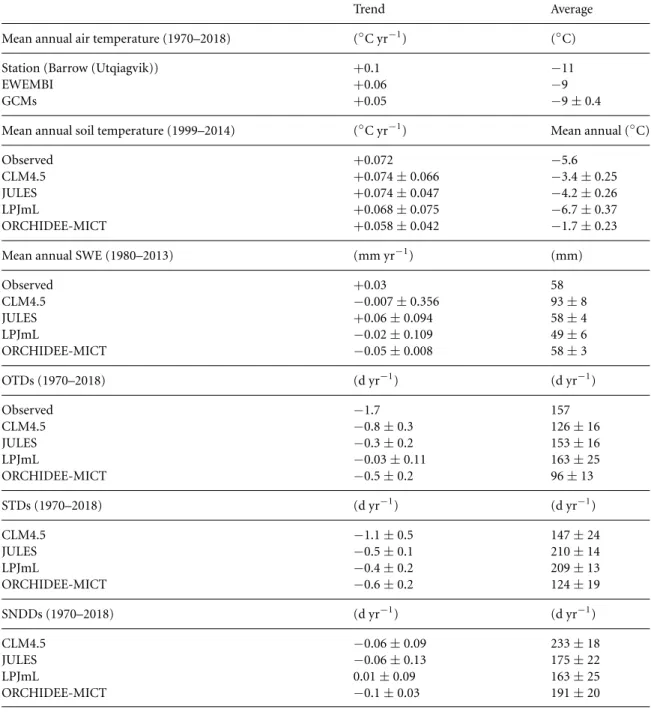
Table 2. Trends and average of mean annual air temperature, mean annual soil temperature and mean annual snow water equivalent (SWE) of GCMs, LSMs and observations. The spatial domain is the model evaluation domain (continuous permafrost zone, north of 60◦latitude in Alaska), except for soil temperature (0.75 m depth) which is the average of 25 boreholes (Wang et al2018). Data sources are detailed in table1. The standard deviation is the variability caused by the four driving bias-adjusted CMIP5 GCMs.
Trend Average
Mean annual air temperature (1970–2018) (◦C yr−1) (◦C)
Station (Barrow (Utqiagvik)) +0.1 −11
EWEMBI +0.06 −9
GCMs +0.05 −9 ± 0.4
Mean annual soil temperature (1999–2014) (◦C yr−1) Mean annual (◦C)
Observed +0.072 −5.6
CLM4.5 +0.074± 0.066 −3.4 ± 0.25
JULES +0.074± 0.047 −4.2 ± 0.26
LPJmL +0.068± 0.075 −6.7 ± 0.37
ORCHIDEE-MICT +0.058± 0.042 −1.7 ± 0.23
Mean annual SWE (1980–2013) (mm yr−1) (mm)
Observed +0.03 58 CLM4.5 −0.007 ± 0.356 93± 8 JULES +0.06± 0.094 58± 4 LPJmL −0.02 ± 0.109 49± 6 ORCHIDEE-MICT −0.05 ± 0.008 58± 3 OTDs (1970–2018) (d yr−1) (d yr−1) Observed −1.7 157 CLM4.5 −0.8 ± 0.3 126± 16 JULES −0.3 ± 0.2 153± 16 LPJmL −0.03 ± 0.11 163± 25 ORCHIDEE-MICT −0.5 ± 0.2 96± 13 STDs (1970–2018) (d yr−1) (d yr−1) CLM4.5 −1.1 ± 0.5 147± 24 JULES −0.5 ± 0.1 210± 14 LPJmL −0.4 ± 0.2 209± 13 ORCHIDEE-MICT −0.6 ± 0.2 124± 19 SNDDs (1970–2018) (d yr−1) (d yr−1) CLM4.5 −0.06 ± 0.09 233± 18 JULES −0.06 ± 0.13 175± 22 LPJmL 0.01± 0.09 163± 25 ORCHIDEE-MICT −0.1 ± 0.03 191± 20
Figure 4. Model evaluation of total annual overland travel days (OTDs), soil temperature days (STDs) and snow depth days (SNDDs) based on trends (a) and the mean number of days (1970–2018) (b) for the Alaska model evaluation region. Note that the SSNDs of CLM4.5 were computed as described in text S1.
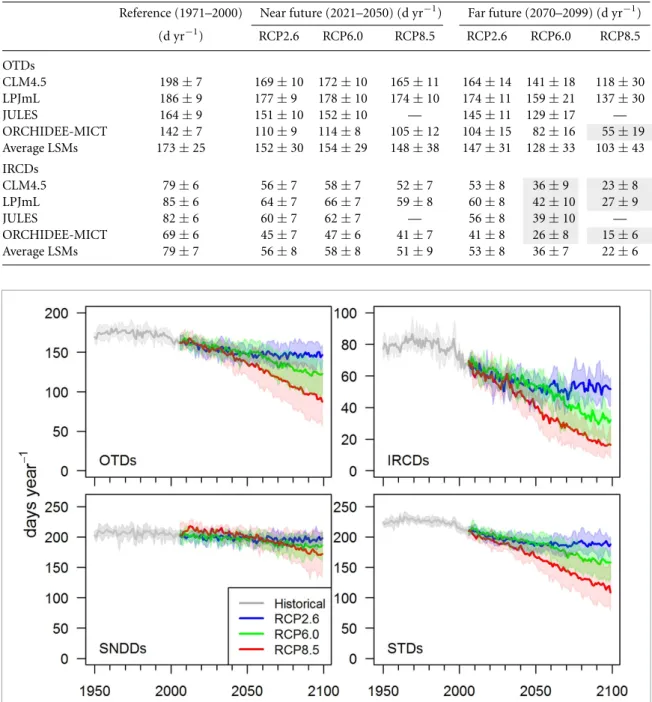
Table 3. Total annual overland travel days (OTDs) and ice road construction days (IRCDs) averaged over the study domain (Pan-Arctic, continuous permafrost zone, north of 60◦latitude) for the reference (1971–2000), near future (2021–2050) and far future (2070–2099) under RCP2.6, RCP6.0, and RCP8.5. For each LSM, the average OTDs/IRCDs and the standard deviation (representing the variability caused by four forcing GCMs) are shown. Also shown are the average across the LSMs and the standard deviation among the LSMs. A decrease⩾50% is highlighted (light gray background).
Reference (1971–2000) Near future (2021–2050) (d yr−1) Far future (2070–2099) (d yr−1) (d yr−1) RCP2.6 RCP6.0 RCP8.5 RCP2.6 RCP6.0 RCP8.5 OTDs CLM4.5 198± 7 169± 10 172 ± 10 165± 11 164± 14 141 ± 18 118± 30 LPJmL 186± 9 177± 9 178± 10 174± 10 174± 11 159 ± 21 137± 30 JULES 164± 9 151± 10 152 ± 10 — 145± 11 129 ± 17 — ORCHIDEE-MICT 142± 7 110± 9 114± 8 105± 12 104± 15 82± 16 55± 19 Average LSMs 173± 25 152± 30 154 ± 29 148± 38 147± 31 128 ± 33 103± 43 IRCDs CLM4.5 79± 6 56± 7 58± 7 52± 7 53± 8 36± 9 23± 8 LPJmL 85± 6 64± 7 66± 7 59± 8 60± 8 42± 10 27± 9 JULES 82± 6 60± 7 62± 7 — 56± 8 39± 10 — ORCHIDEE-MICT 69± 6 45± 7 47± 6 41± 7 41± 8 26± 8 15± 6 Average LSMs 79± 7 56± 8 58± 8 51± 9 53± 8 36± 7 22± 6
Figure 5. Multi-model mean of total annual overland travel days (OTDs), ice road construction days (IRCDs), snow depth days (SNDDs) and soil temperature days (STDs) for the period 1950–2099. The thick line represents the LSM multi-model mean, the shaded area represents the spread introduced by the multi-model evaluation. The historical GCM forcing covers the period 1950–2005 and the future (2006–2099) is represented by three different radiative forcing scenarios (RCPs 2.6, 6.0, 8.5). Note the difference in y-axis scale. The same plot for each LSM individually is shown in figure S7 (SNDDs, STDs) and figure S8 (OTDs, IRCDs).
Increasing winter air temperature and decreas-ing STDs also considerably affect IRCDs (figure5, table 3). Across the Pan-Arctic, IRCDs will reduce from 79± 7 d yr−1 in the reference to on average 55 d yr−1in the near future (table3). Similar to the OTDs, the difference in IRCDs is small (±4 d yr−1) across the RCPs in the near future and between the near and far future (on average −3 d yr−1) under RCP2.6. Under RCP6.0 and especially RCP8.5, IRCDs further decrease to 36 ± 7 d yr−1 (RCP6.0) and
22± 6 d yr−1 (RCP8.5). The strong decline during 2070–2099 under RCP8.5 is statistically significant across all LSMs (table S4). During the reference period, ORCHIDEE-MICT simulates the lowest (69 d yr−1) and CLM4.5 the highest (79 d yr−1) IRCDs. Under all RCPs, CLM4.5 simulates the largest absolute decline, followed LPJmL, JULES and ORCHIDEE-MICT.
The changes in OTDs and IRCDs differ region-ally (figures6and7). We identified the regions with
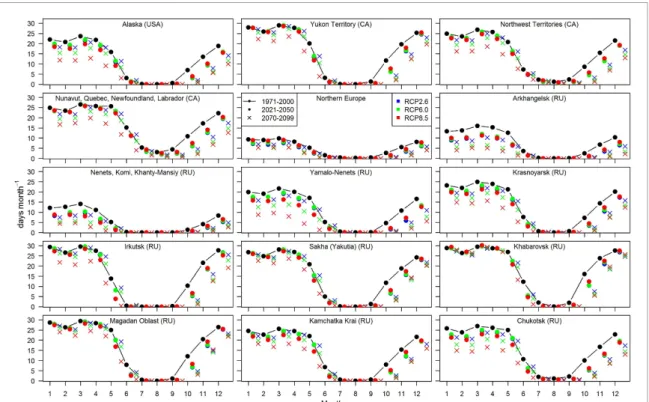
Figure 6. Multi-model mean of total annual overland travel days (OTDs [d yr−1]) averaged over the regions (figure S4) for the reference (1971–2000) and the near (2021–2050) and far future (2070–2099) scenario periods for RCP2.6, 6.0 and 8.5.
the lowest OTDs in the reference to be the most vulnerable to future climate change. When averaging over the entire model ensemble, the most vulnerable regions include Alaska, the Northwestern Russian regions (Yamalo, Arkhangelsk Oblast, Nenets, Komi, Khanty-Mansiy), Northern Europe and Chukotka (figure6, table S5) where a reduction larger than 50% in total annual OTDs was simulated under RCP8.5 in the far future. In contrast, OTDs decrease by less than 10% in the near and by less 30% in the far future in Khabarovsk Krai, Magadan Oblast, and Sakha (Yakutia) making those the most resilient regions to climate change. OTDs reduce by less than 10% in five (RCP2.6, RCP6.0) to three (RCP8.5) sub-regions (out of 15) in the near future and between three (RCP2.6) and none (RCP6.0, RCP8.5) in the far future com-pared to the reference. At the same time, the num-ber of sub-regions with a reduction larger than 30% compared to the reference increases from three (all RCPs) in the near future to between three (RCP2.6) and twelve (RCP8.5) in the far future. The differ-ence between the OTDs is comparably low across the global warming scenarios (RCPs) in the near future but considerably increases in the far future. In the reference period, ORCHIDEE-MICT simulates the
lowest OTDs in Alaska and Russia, JULES in Canada and Northern Europe. In all regions except in North-ern Europe, ORCHIDEE-MICT simulates the lowest OTDs in the future (table S6).
IRCDs differ regionally similar to OTDs (table S7). Already in the near future, the regions of Alaska, Northwestern Russia (Yamalo, Arkhangelsk Oblast, Nenets, Komi, Khanty-Mansiy), Northern Europe show a decrease larger than 50% when averaged across the model ensemble including the RCPs. In the far future, IRCDs decrease by larger than 50% in all regions except in three (Khabarovsk Krai, Magadan Oblast, Sakha (Yakutia)) under RCP6.0 and in one (Khabarovsk Krai) under RCP8.5. Under RCP2.6, IRCDs remain relatively stable between the near and the far future with the largest abso-lute changes occurring in the Canadian regions of Nunavut, Quebec, Newfoundland, and Labrador (figure7).
Intra-annually, all winter months are projec-ted to experience a decline in OTDs across the Pan-Arctic, with the shoulder seasons (May and September–October) being most strongly affected (figure8). In terms of absolute difference in OTDs per month, May and October show the largest decrease.
Figure 7. Multi-model mean of total annual ice road construction days (IRCDs [d yr−1]) averaged over the regions (figure S4) for the reference (1971–2000) and the near (2021–2050) and far future (2070–2099) scenario periods for RCP2.6, 6.0 and 8.5.
ORCHIDEE-MICT under RCP8.5 and JULES show the strongest declines in November and December, respectively. Regionally, the general patterns are con-sistent with the annual OTDs analysis. Regions with low number of total monthly OTDs will experi-ence the strongest declines in the near future in the shoulder season, with the decline being stronger in fall compared to spring. In the far future, total monthly OTDs decrease by more than 50% when averaged over the model ensemble in October in all regions under all RCPs, in two (RCP2.6) to seven (RCP8.5) regions in November and zero (RCP2.6) to four (RCP8.5) regions in December. The regions Arkhangelsk Oblast and Northwestern Russia (Nenets, Komi, Khanty-Mansiy) and Yamalo-Nenets (only under RCP8.5) experience a reduction larger than 50% in all months under RCP6.0 and RCP8.5. Little changes are projected over the summer (July–September) months as these months are already too warm to support winter travel under current cli-matic conditions.
5. Discussions
Our results show that the severity of the impact of climate change on winter travel differs consider-ably depending on the global warming scenario and the time horizon. The largest reduction in OTDs and IRCDs under RCP2.6 occurs until mid-century (figure5). Conversely, OTDs and IRCDs continue to decrease under RCP6.0 after 2050 and especially do so under RCP8.5. This suggests that the changes in winter overland mobility are more severe than pre-viously anticipated by, e.g. Stephenson et al (2011), as their analysis was limited to 2059. While our ana-lysis shows that winter travel is considerably affected until 2050, stringent climate policies (RCP2.6) could potentially reduce climate change impacts on winter mobility in the second half of the 21st century.
The climate change impact on OTDs until mid-century may remain manageable for Arctic com-munities and for the industrial sector in most regions. The larger reduction in IRCDs until mid-century
Figure 8. Total monthly overland travel days (OTDs) averaged across the LSMs/GCMs for the reference (1971–2000) and the near (2021–2050) and far future scenario (2070–2099) periods represented by RCP2.6, RCP6.0 and RCP8.5 for the sub-regions (provinces/states, administrative units) shown in figure S4.
could be counter-balanced by technical and man-agement measures, such as snow compaction and pre-packing to reduce the insulating effect of snow, flooding to augment ice thickness (etc) and by increasing efficiency in the operations during con-struction. Records from the North Slope of Alaska have shown that such measures have kept the ice road season length almost constant (2004–2018, figure3, Oliver2018) despite already ongoing climate warm-ing and decreases in OTDs over the past decades. Nevertheless, the strong decrease in IRCDs under all global warming scenarios by the end of the century will require new engineering solutions and may also increase the demand for more permanent infrastruc-ture, especially in those regions most affected (North-western Russia, Alaska, Kamchatka Krai). This will translate into high investment and maintenance costs (Melvin et al2017, Porfiriev et al 2019, Streletskiy et al 2019, Suter et al 2019), larger environmental impact such as increasing tundra and permafrost damage (Chapin and Shaver1981, Abele et al1984), and wildlife and ecosystem disturbance (noise dis-turbance, impacting animal migration routes, habitat fragmentation). Decision makers and land managers will also need to carefully monitor the initiation of both the ice road construction and the overland travel season. A study from the Northwest Territor-ies (Canada) showed that indices based on air tem-perature (e.g. air freezing index) and precipitation could serve as reliable proxy since monitoring of soil temperature and snow depth are not widely avail-able (Sladen et al2020). Thresholds and indices will
also need to reflect on the regional conditions. For example, in our study, the IRCDs index represents ideal conditions for ice road construction in tun-dra environments but is most likely less suitable for regions located in the boreal and discontinuous per-mafrost zone.
Reduced winter overland travel will have major financial implications on the Arctic economy which heavily relies on the construction and natural resource sectors. The economic value that was gener-ated in these sectors accounted to∼$250 000 million US dollar purchasing power parity in 2010 (Lempinen 2015), of which the majority (85%) is generated in Russia, followed by Alaska (8%), Europe (6%) and Canada (1%). Apart from impacting economic activ-ities, the projected reduction in winter travel will also strongly affect the livelihood of Arctic communities (such as winter hunting activities by snowmobiles and sleds).
Observational data have shown that the study region is already undergoing profound environ-mental changes under current climate change. In fact, the trend (−1.7 d yr−1) in the officially per-mitted total annual OTDs (1980–2018) is larger than the trends (−1.1 d yr−1) simulated by the LSMs in the model evaluation domain (Alaska) under RCP8.5 by the end of the century (2070–2099, figure S6). The evaluation of the LSM modeling results against observations, available for the North Slope of Alaska, showed that the LSMs forced by four different bias-adjusted GCMs can well reproduce observed average OTDs, but they underestimate observed trends. This
demonstrates that the overall mechanisms relevant for analyzing changes in winter travel are well repres-ented by the models. Differences in officially permit-ted and simulapermit-ted OTDs may be caused by differences in the model evaluation domain and the North Slope of Alaska (68% of the model evaluation domain), the large uncertainty in human decision-making—when to open and especially when to close the tundra for travel (ADNR, personal communication)—as well as uncertainties in model approaches and parameteriz-ations in the LSMs.
We expect that the considerable modeling uncer-tainties in the GCMs and LSMs are likely to under-estimate the severity of change in Pan-Arctic winter overland travel because the Arctic amplification sig-nal is not properly accounted for in the CMIP5 GCMs (Davy and Outten 2020). Furthermore, important geomorphological and hydrological processes and mechanisms are not considered in the LSMs which limits their applicability for detailed regional or local studies. This and other studies based on complex Earth System Models (ESMs) (Koven et al 2011, Slater and Lawrence 2013) identified the ice-rich permafrost regions of Sakha (Yakutia), Khabarovsk Krai, Magadan Oblast, Irkutsk Oblast, Kamchatka Krai, Yukon Territories and the Northeastern Cana-dian regions (Nunavut, Quebec, Newfoundland, Lab-rador) as most resilient to climate change. How-ever, our LSMs (and the current generation of ESMs) only consider gradual thaw of permafrost and there-fore likely underestimate the permafrost degrada-tion as abrupt permafrost thaw (thermokarst devel-opment) is neglected (Nitzbon et al2020) which leads to accelerated permafrost destabilization in perma-frost regions with high ground ice content (36% of the study domain based Brown et al (1997)). Small (thermokarst) lakes and creeks, which are common in the Arctic tundra environment, are also not cap-tured at the 0.5◦ grid cell resolution adopted here. Such water bodies play an important role in winter travel as their thick surface ice often serves as nat-ural trafficable bridges. Novel model schemes such as tiling approaches may allow us to represent such sub-grid geomorphological features and thermo-hydrological processes in interaction with infrastruc-ture in LSMs in the fuinfrastruc-ture (Aas et al 2016, 2019, Schneider von Deimling et al2020).
Our results show that warming soil temperat-ures are the main driver for decreasing winter mobil-ity (figure5), despite projected increase in snowfall (figure S5, table S3). Although an increased snowpack protects the sensitive tundra vegetation, it is also a soil warming agent due to increased ground insu-lation. The simulated shortening of the snow sea-son, here expressed as decreasing SNDDs, was found to also enhance soil warming, especially during the autumn months, due to increased solar absorption in the prolonged snow-free late summer period. At
the same time, a larger snowpack during spring pro-tects the ground longer from increasing spring and early summer air temperatures. Model experiments of Lawrence and Slater (2010) suggested that, depend-ing on location, snow and air temperature change exert roughly equivalent forcing on soil temperature change, but the relative influence of snow diminishes under strong global warming scenarios. This is in line with our simulation results, where, despite increasing snowfall under RCP8.5 by 47% (figure S5) in the far future, a significant soil warming is simulated by the LSMs across the Arctic.
6. Conclusion
We find that climate change will considerably impact winter overland travel across the Pan-Arctic as consistently simulated by our multi-model ensemble. The off-road overland travel season is projected to decrease by on average −13% in the near future (2021–2050) compared to the reference (1971–2000). In the far future (2070–2099), OTDs reduce by−15% under RCP2.6 and up to−40% under RCP8.5. These results highlight the potential of implementing strin-gent climate mitigation policies to stabilize the impact of climate change on winter overland travel after 2050. We identified that Eastern Siberian regions (Sakha (Yakutia), Khabarovsk Krai, Magadan Oblast) will experience the smallest change, while Alaska (USA) the Northwestern Russian regions (Yamalo, Arkhangelsk Oblast, Nenets, Komi, Khanty-Mansiy), Northern Europe and Chukotka are highly vulner-able. The shoulder season is most affected, particu-larly autumn. In comparison to the off-road overland travel season, the number of days when ice road con-struction is feasible reduces more significantly under all scenarios. In the near future, the reduction in IRCDs (∼−30%) is more than double compared to OTDs (−13%). In the far future, IRCDs experience a reduction between−33% (RCP2.6) and up to −72% (RCP8.5) which will challenge ice road construction in some regions, particularly in Alaska, Northwestern Russia (Yamalo, Arkhangelsk Oblast, Nenets, Komi, Khanty-Mansiy), and Northern Europe.
Our projections clearly demonstrate that the accessibility of the Arctic via winter travel modes will be strongly reduced under the low-end global warming scenario RCP2.6, likely increasing socio-economic, ecological and financial risks to a crit-ical level. While rigorous climate mitigation policies have the potential to reduce the impact on winter mobility in the second half of the 21st century, we conclude that the livelihoods of remote Arctic com-munities and access to existing infrastructure are under severe threat already in the next decades. A large number of economic activities in the Arctic will, thus, only remain feasible with increasing costs and effort.
Data availability
See table1
Acknowledgments
This research was supported by the German Fed-eral Ministry of Education and Research (BMBF) and the European Research Area for Climate Ser-vices ERA4CS with project funding reference 518 number 01LS1711C (ISIPedia project). CPOR acknowledges funding from the Horizon 2020 pro-ject CASCADES (Grant Agreement 821010). ML was supported by a BMBF grant (project PermaR-isk, Grant No. 01LN1709A). WT acknowledges the Uniscientia Foundation and the ETH Zurich Found-ation for their support to this research. EJB was funded by the European Commission’s Horizon 2020 Framework Programme, under Grant Agree-ment number 641816, the ‘Coordinated Research in Earth Systems and Climate: Experiments, Know-ledge, Dissemination and Outreach (CRESCENDO)’ project (11/2015–10/2020) and the Met Office Had-ley Centre Climate Programme funded by BEIS and Defra.
ORCID iDs
Anne Gädeke https://orcid.org/0000-0003-0514-2908
Moritz Langer https://orcid.org/0000-0002-2704-3655
Julia Boike https://orcid.org/0000-0002-5875-2112
Eleanor J Burke https://orcid.org/0000-0002-2158-141X
Jinfeng Chang https://orcid.org/0000-0003-4463-7778
Melissa Head https://orcid.org/0000-0002-3456-1143
Christopher P O Reyer https://orcid.org/0000-0003-1067-1492
Sibyll Schaphoff https://orcid.org/0000-0003-1677-8282
Wim Thiery https://orcid.org/0000-0002-5183-6145
Kirsten Thonicke https://orcid.org/0000-0001-5283-4937
References
Aas K S et al 2019 Thaw processes in ice-rich permafrost landscapes represented with laterally coupled tiles in a land surface model Cryosphere13 591–609
Aas K S, Gisnås K, Westermann S and Berntsen T K 2016 A tiling approach to represent subgrid snow variability in coupled land surface–atmosphere models J. Hydrometeorol.18 49–63
Abele G, Brown J and Brewer M C 1984 Long-term effects of off-road vehicle traffic on tundra terrain J. Terramech.
21 283–94
ACIA 2005 Arctic Climate Impact Assessment: Scientific Report (Cambridge: Cambridge University Press) p 1042 ADNR 2015 Off-road travel on the North Slope on state
land Alaska Department of Natural Resources, Division of Mining, Land and Water (available at: http://dnr.alaska.gov/mlw/factsht/
land_fs/off-road_travel.pdf) (Accessed 20 August 2020) Barrette P D and Charlebois L 2018 Winter roads and climate adaptation: prospective solutions through R&D (available at:www.tac-atc.ca/sites/default/files/conf_papers/ barrettep_winter_roads_and_climate_adaptation.pdf) (Accessed 24 November 2020)
Biskaborn B K et al 2019 Permafrost is warming at a global scale Nat. Commun.10 264
Brown J, Ferrians O J, Heginbottom J J A and Melnikov E S 1997 Circum-Arctic Map of Permafrost and Ground-ice Conditions Circum-Pacific Map Series CP-45, scale 1:10,000,000, 1 sheet (Washington, DC: US Geological Survey in Cooperation with the Circum-Pacific Council for Energy and Mineral Resources)
Chapin F S and Shaver G R 1981 Changes in soil properties and vegetation following disturbance of Alaskan Arctic tundra J. Appl. Ecol.18 605–17
ConocoPhillips 2018 Ice roads: the Western North Slope’s frozen foundation (available at:www.conocophillips.com/ spiritnow/story/ice-roads-the-western-north-slope-s-frozen-foundation/) (Accessed 20 August 2020) Davy R and Outten S 2020 The arctic surface climate in CMIP6:
atatus and developments since CMIP5 J. Clim.
33 8047–68
Farquharson L M, Romanovsky V E, Cable W L, Walker D A, Kokelj S V and Nicolsky D 2019 Climate change drives widespread and rapid thermokarst development in very cold permafrost in the Canadian High Arctic Geophys. Res. Lett.
46 6681–9
Forbes B C 1992 Tundra disturbance studies, I: long-term effects of vehicles on species richness and biomass Environ. Conserv.19 48–58
Ford J D, Smit B and Wandel J 2006 Vulnerability to climate change in the Arctic: a case study from Arctic Bay, Canada Glob. Environ. Change16 145–60
Frieler K et al 2017 Assessing the impacts of 1.5◦C global warming—simulation protocol of the Inter-Sectoral Impact Model Intercomparison Project (ISIMIP2b) Geosci. Model Dev.10 4321–45
GPWv4 2016 Center for International Earth Science Information Network—CIESIN—Columbia University, Documentation for the Gridded Population of the World, Version 4 (Gpwv4) (Palisades, NY: NASA Socioeconomic Data and Applications Center)
Hjort J et al 2018 Degrading permafrost puts Arctic infrastructure at risk by mid-century Nat. Commun.9 5147
Hori Y, Cheng V Y S, Gough W A, Jien J Y and Tsuji L J S 2018 Implications of projected climate change on winter road systems in Ontario’s Far North, Canada Clim. Change
148 109–22
IPCC 2019 Summary for policymakers IPCC Special Report on the Ocean and Cryosphere in a Changing Climate ed H-O Pörtner et al (In press) (www.ipcc.ch/srocc/ chapter/summary-for-policymakers/)
Jorgenson J C, Hoef J M V and Jorgenson M T 2010 Long-term recovery patterns of Arctic tundra after winter seismic exploration Ecol. Appl.20 205–21
Jungsberg L, Turunen E, Heleniak T, Wang S, Ramage J and Roto J (2019) Atlas of population, society and economy in the Arctic (Stockholm: Nordregio) (https://doi.org/10.30689/ WP2019:3.1403-2511)
Kiani S, Irannezhad M, Ronkanen A-K, Moradkhani H and Kløve B 2018 Effects of recent temperature variability and warming on the Oulu-Hailuoto ice road season in the northern Baltic Sea Cold Regions Sci. Tech.151 1–8
Knowland E K, Gyakum J R and Lin C A 2010 A study of the meteorological conditions associated with anomalously
early and late openings of a Northwest Territories winter road Arctic63 227–39
Koven C D et al 2011 Permafrost carbon-climate feedbacks accelerate global warming Proc. Natl Acad. Sci.
108 14769–74
Lafrance M 2007 Ice bridge safety document: safety guide for operations over ice: Yellowknife, Department of Transportation, Government of the Northwest Territories Lange S 2016 EartH2Observe, WFDEI and ERA-Interim data
Merged and Bias-corrected for ISIMIP (EWEMBI), GFZ Data Services (https://doi.org/10.5880/pik.2016.004) Lawrence D M and Slater A G 2010 The contribution of snow
condition trends to future ground climate Clim. Dyn.
34 969–81
Lempinen H 2015 Arctic Human Development Report: Regional Processes and Global Linkages. Joan Nymand Larsen and Gail Fondahl (editors). 2015. Copenhagen: nordic Council of Ministers. 500 p, illustrated, softcover. ISBN
978-92-893-3881-3. 500 DKK (print), free of charge (online) Polar Rec.51 567–8
Linden E 2000 The big meltdown: as the temperature rises in the Arctic, it sends a chill around the planet Time 156 52–56 Melvin A M et al 2017 Climate change damages to Alaska public
infrastructure and the economics of proactive adaptation Proc. Natl Acad. Sci.114 E122–31
Metsämäki S et al 2015 Introduction to GlobSnow Snow Extent products with considerations for accuracy assessment Remote Sens. Environ.156 96–108
Mullan D et al 2017 Climate change and the long-term viability of the World’s busiest heavy haul ice road Theor. Appl. Climatol.129 1089–108
Nechepurenko I 2020 Russia declares emergency after Arctic oil spill (available at:www.nytimes.com/2020/06/04/world/ europe/russia-oil-spill-arctic.html) (Accessed 21 September 2020)
Nelson F E, Anisimov O A and Shiklomanov N I 2001 Subsidence risk from thawing permafrost Nature410 889
Nitzbon J, Westermann S, Langer M, Martin L C P, Strauss J, Laboor S and Boike J 2020 Fast response of cold ice-rich permafrost in northeast Siberia to a warming climate Nat. Commun.11 2201
Oleson K W, et al 2013 Technical description of version 4.5 of the Community Land Model (CLM) NCAR Technical Note: NCAR/TN-503+ STR (Boulder, CO, USA: National Center for Atmospheric Research (NCAR))
(https://doi.org/10.5065/D6RR1W7M)
Oliver S G 2018 Ice roads and tundra travel: rural Arctic access complicated by warmer winters Anchorage Daily News (available at: www.adn.com/arctic/2018/02/03/ice- roads-and-tundra-travel-rural-arctic-access-complicated-by-warmer-winters/) (Accessed 26 September
2020)
Orians G H et al 2003 Cumulative Environmental Effects of Oil and Gas Activities on Alaska’s North Slope (Washington, DC: National Academies Press)
Porfiriev B N, Eliseev D O and Streletskiy D A 2019 Economic assessment of permafrost degradation effects on road infrastructure sustainability under climate change in the Russian Arctic Her. Russ. Acad. Sci.89 567–76
Raynolds M K et al 2014 Cumulative geoecological effects of 62 years of infrastructure and climate change in ice-rich permafrost landscapes, Prudhoe Bay Oilfield, Alaska Glob. Change Biol.20 1211–24
Raynolds M K et al 2020 Landscape impacts of 3D-seismic surveys in the Arctic National Wildlife Refuge, Alaska Ecol. Appl.
00 e02143
Schneider von Deimling T et al 2020 Consequences of permafrost degradation for Arctic infrastructure—bridging the model gap between regional and engineering scales Cryosphere Discuss.2020 1–31
Schuur E A G et al 2008 Vulnerability of permafrost carbon to climate change: implications for the global carbon cycle BioScience58 701–14
Sharma S et al 2020 Increased winter drownings in ice-covered regions with warmer winters PLoS One15 e0241222
Shiklomanov N I, Streletskiy D A, Grebenets V I and Suter L 2017 Conquering the permafrost: urban infrastructure
development in Norilsk, Russia Polar Geogr.40 273–90
Sladen W E, Wolfe S A and Morse P D 2020 Evaluation of threshold freezing conditions for winter road construction over discontinuous permafrost peatlands, subarctic Canada Cold Regions Sci. Tech.170 102930
Slater A G and Lawrence D M 2013 Diagnosing present and future permafrost from climate models J. Clim.26 5608–23
Stephenson S R, Smith L C and Agnew J A 2011 Divergent long-term trajectories of human access to the Arctic Nat. Clim. Change1 156
Streletskiy D A, Suter L J, Shiklomanov N I, Porfiriev B N and Eliseev D O 2019 Assessment of climate change impacts on buildings, structures and infrastructure in the Russian regions on permafrost Environ. Res. Lett.14 025003
Suter L, Streletskiy D and Shiklomanov N 2019 Assessment of the cost of climate change impacts on critical infrastructure in the circumpolar Arct. Polar Geogr.42 267–86
Vasiliev A A, Drozdov D S, Gravis A G, Malkova G V, Nyland K E and Streletskiy D A 2020 Permafrost degradation in the Western Russian Arctic Environ. Res. Lett.15 045001
Vonk J E et al 2015 Reviews and syntheses: effects of permafrost thaw on Arctic aquatic ecosystems Biogeosciences12 7129–67
Wang K, et al 2018 A synthesis dataset of near-surface permafrost conditions for Alaska, 1997–2016 Arctic Data Center (https://doi.org/10.18739/A2KG55)
Wotton B M, Flannigan M D and Marshall G A 2017 Potential climate change impacts on fire intensity and key wildfire suppression thresholds in Canada Environ. Res. Lett.
12 095003
Zell E 2014 Impacts of Historical and Projected Climate Changes on Ice Surfaces of the Tibbitt to Contwoyto Winter Road, Northwest Territories, Canada. Waterloo, Ontarion, Canada p 75
![Figure 6. Multi-model mean of total annual overland travel days (OTDs [d yr − 1 ]) averaged over the regions (figure S4) for the reference (1971–2000) and the near (2021–2050) and far future (2070–2099) scenario periods for RCP2.6, 6.0 and 8.5.](https://thumb-eu.123doks.com/thumbv2/123doknet/13402179.406380/10.892.180.825.93.638/figure-multi-overland-averaged-regions-reference-scenario-periods.webp)
![Figure 7. Multi-model mean of total annual ice road construction days (IRCDs [d yr −1 ]) averaged over the regions (figure S4) for the reference (1971–2000) and the near (2021–2050) and far future (2070–2099) scenario periods for RCP2.6, 6.0 and 8.5.](https://thumb-eu.123doks.com/thumbv2/123doknet/13402179.406380/11.892.180.825.93.637/figure-multi-construction-averaged-regions-reference-scenario-periods.webp)