HAL Id: halshs-02468956
https://halshs.archives-ouvertes.fr/halshs-02468956
Submitted on 6 Feb 2020
HAL is a multi-disciplinary open access archive for the deposit and dissemination of sci-entific research documents, whether they are pub-lished or not. The documents may come from teaching and research institutions in France or abroad, or from public or private research centers.
L’archive ouverte pluridisciplinaire HAL, est destinée au dépôt et à la diffusion de documents scientifiques de niveau recherche, publiés ou non, émanant des établissements d’enseignement et de recherche français ou étrangers, des laboratoires publics ou privés.
Measuring Gender Norms in Domestic Work: A
Comparison between Homosexual and Heterosexual
Couples
Elisabeth Cudeville, Martine Gross, Catherine Sofer
To cite this version:
Elisabeth Cudeville, Martine Gross, Catherine Sofer. Measuring Gender Norms in Domestic Work: A Comparison between Homosexual and Heterosexual Couples. 2020, 31p. �halshs-02468956�
Documents de Travail du
Centre d’Economie de la Sorbonne
Measuring Gender Norms in Domestic Work: A Comparison between Homosexual and Heterosexual
Couples
Elisabeth CUDEVILLE, Martine GROSS, Catherine SOFER
Measuring Gender Norms in Domestic Work:
A Comparison between Homosexual and Heterosexual Couples
Elisabeth CUDEVILLE CES, Université Paris 1
Martine GROSS CéSor EHESS, CNRS
Catherine SOFER
CES, Université Paris 1, PSE
January 2020
Abstract
Women throughout the world still do most of the unpaid domestic work. To reveal the impact of social norms beside traditional economic variables on the sharing of household tasks within couples, we choose to compare the sharing of tasks between heterosexual and homosexual couples in France based on econometric estimations. The results show that, other things being equal, heterosexual couples share tasks much more unequally than homosexual couples. Assuming that the behavior of same-sex couples is not affected by gendered social norms, we then propose a measure of the impact of these norms using a Blinder-Oaxaca type decomposition.
Keywords
Household production; Gender Inequality; Division of Housework; Gender norms; Homosexual Couples; Heterosexual Couples.
Introduction
In this paper, we investigate the sharing of time within homosexual and heterosexual couples in France and the impact of observable socio-economic variables on it. It is today well documented that gender differences in time use in heterosexual couples, despite a long term decreasing trend (see, for France, Champagne et al. 2015), are very high. This is true on the labor market, and even more within the household (Goldschmidt-Clermont and Pagnossin-Aligisakis, 1995; Ponthieux and Schreiber, 2006; Sofer and Thibout, 2019). Women throughout the world still do most of the unpaid domestic work. In OECD countries, the average difference between times spent by women and men in unpaid work per day amounts to two hours and fifteen minutes, and in France, to an hour and a half.
Several explanations of this phenomenon have been put forward. Most economic models show that observed differences between men and women in variables such as education or wages, might explain why women invest less than their partners in the labor market and more in the family. Namely, the efficiency of household production states that each partner specializes in activities for which his/her time return is relatively higher. Hence, the partner earning the lower wage should devote less time to the labor market, and more to household work (Becker, 1981; Gronau, 1977). However, empirically, education, wages, or other measurable variables are found to be far from completely explaining the sharing of household chores (Hersch and Stratton, 1994; Anxo, Flood, and Kocoglu, 2002; Aronsson, Daunfeldt and Wikström, 2001; Sofer and Thibout, 2019). Note that this result by itself might seriously challenge the commonly made assumption of Pareto-efficiency of the allocation of resources within the household, notably in “collective” models (Chiappori, 1988, 1992, 1997; Apps and Rees, 1997; Rapoport, Sofer and Solaz, 2011). A recent trend in the literature aims at including social norms or stereotypes in economic models in order to amend the efficiency model (Akerloff and Kranton, 2000; Cudeville and Recoules, 2015; Cudeville, Couprie and Sofer, 2016).
Indeed, another body of literature, mainly sociological, insists on gender norms: gender roles assigning domestic tasks to women would be the result of a socialization which is highly differentiated by gender. Gender norms might even offset the impact of economic variables, such as in the “doing gender” phenomenon (Brines, 1994; Bittman et al., 2003; Conelly and Kimmel (2009), where women’s share of household work tends to increase when their share of
household income or their relative wage increases, in order to neutralize the social “deviance” generated by economic dependence of men.1
To reveal the impact of social norms or stereotypes, beside traditional economic variables, on the sharing of household tasks within a couple, we choose to compare the sharing of tasks between heterosexual and homosexual couples. The idea is that the sharing of tasks within same-sex couples should be much less affected by gender norms and stereotypes than within heterosexual couples2. The sharing of household tasks within heterosexual couples is now well documented in most countries thanks to Time Use surveys as well as other surveys, such as
Ined-Insee, ÉRFI-GGS2, 2008,3 which we use here. Unfortunately, the sample of homosexual
couples in these surveys is too small to permit any statistical work (40 in the ERFI survey for example). The same stands for any general survey reporting the sharing of household tasks. Hence, we had to rely on a survey specifically dedicated to the analysis of homosexual families. For France, the survey FHP (Fonctionnement conjugal et familial des familles homoparentales) of 676 homoparental families (180 gays and 496 lesbians), conducted online in 2012 includes unique information about the sharing of household work within French homosexual couples (Gross and Courduries, 2014). As in other surveys of this type, the group of survey respondents may not be representative of members of the target population, here homoparental families. But it is well established that selecting a representative sample of the LGBT population and/or of homosexual couples raises major methodological problems, especially because the reference population is unknown (Lhomond, 1997; Lert and Plauzolles, 2003). The respondent families were not intended to be a representative sample but to provide an insight into the behavior of same-sex couples with children. One of the main objectives of the FHP survey is to investigate the way partners share domestic and parental tasks. Note, however, that same-sex couples with children have probably specific characteristics compared to same-sex couples without children and compared to heterosexual couples: for example, the process of having children for same-sex couples is no doubt more costly in France compared to other countries, especially for Gay couples, and certainly more costly compared to heterosexual couples. Hence, it is not surprising
1 Note that evidence of the « doing gender » phenomenon has been found for the U.S. and Australia in the papers
mentioned, or Spain (Sevilla-Sanz et al., 2010) but not in the U.K. (Kalenkoski et al., 2009 ) nor France (Sofer and Thibout, 2019)
2 In order not to make the paper more cumbersome, a theoretical model of differing social norms between
same-sex and heterosame-sexual couples is presented in Appendix 1
3 ERFI : Etude des Relations Familiales et Intergénérationnelles. The survey used here is the 2008 French wave
that partners in our survey have wages over average, which is especially true for Gay couples, as we are going to see below.
The questions of the ERFI survey concerning the sharing of domestic tasks are very similar to those of the FHP survey. This is why we chose this survey which allows a reliable comparison between heterosexual and homosexual couples’ behavior on this matter.4
Few papers in the literature look at the sharing of tasks within same sex couples. Goldberg (2013) looks at the way same-sex couples both “do” and “undo” gender through housework. Jaspers and Verbakel (2013) examine the division of paid labor among gay male and lesbian couples in the Netherlands using 13 waves of the Dutch Labor Force Surveys (1994-2007), which include 998 gay male couples and 1,033 lesbian couples. Drawing on interviews with 30 queer participants who are currently cohabitating with a partner, Kelly and Hauck (2015) examine accounts of the negotiation of the household division of labor. Sutphin (2010) examine division of household labor, using social exchange theory, among 165 survey respondents in a same-sex relationship. Division of labor was measured by the percentage of tasks performed according to the respondent. Moreover, a few papers rather investigate the sharing of parental tasks in same-sex couples (Patterson, 1995) and some of them provide a comparison between homosexual and heterosexual couples. Chan et al. (1998) compare lesbian and heterosexual parents' division of household labor, satisfaction with division of labor, satisfaction with couple relationships, and associations of these variables with psychological adjustment of children. But their sample is very small (30 lesbian and 16 heterosexual couples). The main focus of Fulcher et al (2008) is on the associations among parental sexual orientation, parental gender-related attitudes, parental division of labor, and children’s gender development. Their sample includes 33 lesbian and 33 heterosexual couples.
The papers by Patterson et al. (2004), as well as Goldberg et al. (2012) have aims which are more similar to ours. Both are focused on the comparison of the division of labor between same-sex and heterosame-sexual parenting couples. Looking at 66 couples of parents of 4 to 6 year-old children, half lesbian couples and half heterosexual couples in the U.S., Patterson et al. (2004) find that lesbian couples were more likely to divide paid and unpaid labor evenly, whereas heterosexual couples were more likely to show specialized patterns, with husbands investing more time in paid employment and wives devoting more time to unpaid family work. Goldberg
4 The French INSEE-EDT (Emploi Du Temps) 2010 time use survey, is more precise and complete, as it is based
et al. (2012) also find that same-sex couples share child care and housework more equally than heterosexual couples. Their sample includes 55 lesbian, 40 gay and 65 new adoptive heterosexual parenting couples in the U.S.. None of these papers makes use of large samples as we do here. One exception is Gidding et al. (2014) who examine differences in household specialization in the labor market between same-sex and different-sex couples within and across three birth cohorts in the U.S. The paper, however, does not look at the sharing of household tasks. Besides the use of a large sample of French families (676 homoparental families, around 3600 heterosexual parental couples), the novelty of our paper is first to provide estimations of the equality of the division of labor which control for a large number of socio-economic variables, and, second, to propose through Oaxaca-Blinder estimations a measure of social gender norms.
The comparison between homosexual and heterosexual couples is carried out from econometric estimations in order to control for couple’s members characteristics and socio-economic variables, such as wages or social categories and thus eliminate, as much as possible, the effect of differences in the structure of the two populations. The results show that homosexual partners share household tasks more equally than heterosexual partners. We then propose a measure of the impact of gender norms and stereotypes on the sharing of domestic tasks in heterosexual couples from Blinder-Oaxaca type decompositions. Assuming that the behavior of same-sex couples is not affected by social norms that assign each gender a role in the family, the share of the inequality gap between heterosexual and homosexual couples in the sharing of tasks which cannot be attributed to differences in the observed characteristics between the two groups can be interpreted as a measure of the impact of gender social norms and stereotype on the division of domestic tasks within heterosexual couples. Our results show that between 60% and 70% of the gap between heterosexual and same-sex couples can be attributed to gender norms and stereotypes, which conversely implies that only about 30% to 40% of the gender differential in the sharing of domestic tasks in heterosexual couples can be attributed to socio-economic variables.
The remainder of the paper is organized as follows. Section I presents the two surveys used in the analysis and descriptive statistics of the data. Section II presents probit and ordered probit estimations of an unequal sharing of different tasks within the different types of couples. Section III presents a Blinder-Oaxaca decomposition of the inequality gap between heterosexual and homosexual couples that gives a measure of the effect of social norms and
stereotypes on the sharing of domestic tasks between partners within heterosexual couples. The last section concludes.
I. The data
In order to compare homosexual and heterosexual couples, we used two surveys:
‐ The survey FHP 2012 (Enquête sur le fonctionnement familial et conjugal des familles
homoparentales) consisted of questioning online 676 homosexual parents (180 gays and
496 lesbians), living in a couple with one or more children or expecting a child. The sample does not pretend to be representative, as the reference population is largely unknown. However, though the homosexual couples who accepted to be respondents to this survey are for sure the result of a selection process, far from all of them were militants, as half of them had never joined any gay or lesbian association. The respondents’ recruitment was made partly through different organizations of homosexual parents, partly through calls to testimony in different magazines (including women’s magazines) and then by word of mouth. More than 400 questions were asked, of which we used those related to the socio-economic background of the respondents and to the family size and composition (including its members living outside when they existed). Only one member of each couple was questioned, but many questions concerned the partner. We also used the questions giving information about the organization of household work and childcare. They identify four main general domestic tasks (linked to meals, cleaning, clothes and shopping), each of them including a list of more specific tasks (washing dishes, for example is included in the list related to meals), as well as eight tasks with a narrower definition (as keeping accounts or doing home repairs). Seventeen main parental care tasks are also listed. For each task the respondent was asked who is primarily in charge of the task.
‐ The Ined-Insee, ÉRFI-GGS2, 2008 survey is made of four different questionnaires, which observations are individuals, children level, household, plus specific individual questions about education and employment. As for the FHP survey, only one adult member of each household was questioned but many questions were asked about the partner’s characteristics. We selected a sample of couples sharing the same main family characteristics than the FHP survey, i.e. couples in which at least one partner had a child or was expecting one. We thus obtained 3,728 couples. Besides the usual questions about socio-economic characteristics of the household as well as individual characteristics
(education, activity, income, etc.), the questions regarding the household organization of domestic tasks was of particular interest for us. Seven main domestic tasks are listed in the survey, each of them having an equivalent in the FHP survey provided that some grouping takes place: washing dishes, shopping for food, meal preparation, laundry and ironing, vacuuming, home repairs, accounting. The correspondence is unfortunately less good for child care tasks, which definitions most of the time include different lists of specific tasks in the two surveys. This is why, in the following, we limit our comparison to domestic tasks. As mentioned above, this comparison is made possible through questions in the ERFI survey about who is primarily in charge of each task. These questions permitted six answers, close to those formulated in the FHP survey, provided this time a grouping of the answers in the ERFI survey. In each survey, the respondent was randomly selected between the two members of the couple.
The descriptive statistics of the variables used in the estimations are provided in Tables 1 and 2 below, on the different samples. The main socio-demographic characteristics of couples, used as control variables in the estimations, are shown in Table 1. The variables appearing in Table 2 concern the sharing of domestic tasks within the couple – they have been built with the objective of measuring the equality/inequality of this sharing, and are either dependent or explaining variables in the estimations.
Table 1. Socio-demographic Characteristics of the Sample
Gay (N=162) Lesbian (N=462) Homosexual (N=624) Heterosexual (N=3557) All couples (N=4181) VARIABLES mean sd mean sd mean sd mean sd mean sd rep_ age 40.84 8.15 35.80 6.80 37.11 7.51 49.83 13.85 48.00 13.86 relation_length 9.15 6.14 8.67 5.97 8.79 6.01 24.95 15.07 22.61 15.23 nb_children 1.33 0.95 1.33 0.86 1.33 0.88 1.18 1.19 1.20 1.15 stepchildren 0.42 0.50 0.25 0.43 0.29 0.46 0.20 0.40 0.21 0.41 rural 0.13 0.34 0.15 0.36 0.15 0.35 0.32 0.47 0.29 0.45 large_city 0.45 0.50 0.32 0.47 0.35 0.48 0.36 0.48 0.36 0.48 idf 0.33 0.47 0.31 0.46 0.31 0.46 0.13 0.34 0.16 0.37 owner 0.71 0.46 0.58 0.49 0.61 0.49 0.78 0.42 0.75 0.43 dif_employ 0.16 0.37 0.26 0.44 0.23 0.42 0.24 0.43 0.24 0.42 dif_income 1,682 1,684 988 1,159 1 ,168 1 ,349 1,195 1,832 1,191 1,768 monthincome 3,100 1,424 2,138 1,011 2,388 1,208 1,697 1,142 1,800 1,178 spc_indep 0.10 0.30 0.02 0.14 0.04 0.20 0.07 0.25 0.07 0.25 spc_highocc 0.80 0.40 0.73 0.44 0.75 0.43 0.36 0.48 0.41 0.49 spc_lowocc 0.09 0.28 0.22 0.41 0.18 0.39 0.27 0.44 0.26 0.44 spc_indep: farmers, tradesmen, merchants and small business owners, spc_highocc: higher and
intermediate occupations, spc_lowocc: lower occupations.
Let us compare the samples of homosexual and heterosexual couples (HM and HT in the following). The number of children present in the household is similar in the different types of couples: 1.33 in HM couples, the same for gay and lesbian couples (respectively G and L in the following) versus 1.18 in HT couples. One third of HT couples lives in rural areas compared to only 15% of HM couples, and G couples more often live in large cities (cities of 100,000 or more inhabitants) compared to L and HT couples. In particular, about one third of HM couples live in the capital urbanized region of Ile de France (idf), against 13% of HT couples. 78% of HT couples and 71% of G couples own their housing (owner) while it is the case for only 58% of L couples. The average couple duration is much shorter in our sample of HM couples, about 9 years for both G and L couples, compared to 25 years for HT couples. Unfortunately, the data do not allow us to calculate the average age of the partners for homosexual couples, since in contrast with the ERFI survey that reports the age of both partners, the FHP survey only reports the age of the respondent. The information reported in Table 1 by the “rep_age” variable thus gives the age of the respondent which on average amounts to about 50 for HT couples compared to 37 for HM couples (respectively 40.8 and 35.8 for G and L couples). It is likely that part of the difference in the average length of the relationship between the HM and HT couples is explained by a higher average age of partners in the sample of HT couples. But it could also reflect a greater instability of unions for homosexual couples, which are more often stepfamilies. HM couples are indeed more likely to have stepchildren, especially G couples (45% versus 25% of L couples and 20% of HT couples). The variables “scp_ “that give the highest socio-professional category within the couples show that, overall, HM couples belong to higher socio-professional categories than HT couples, and it is particularly the case for G couples: 80% of them occupy intermediate or managerial positions although 9% only are workers or employees, compared to 73 and 22% for Lesbian and 48 and 44% respectively for HT couples. This difference translates in wages, as the partners’ average monthly wage amounts to €1,697 for HT couples, €2,138 for L couples and €3,100 euros for G couples. Hence, HM couples, and especially G couples have wages significantly above average. There is no significant difference between HT and HM couples regarding the difference in employment status between partners (dif_employ): in 24% of HT couples, one partner is employed while the other is not. The same is true for 26% of L couples, but only 16% of G couples. Again, these dissimilarities between partners are reflected in the average absolute difference in partners’
monthly wages (dif_income): on average, it is the lowest in L couples (€988), then in HT couples (€1,195), and the highest in G couples (€1682). Despite a lack of marked difference between HT and HM couples in employment or in wages gap between partners, significant differences in the equal/inequal sharing of domestic tasks appear between HM and HT couples, as highlighted in Table 2.
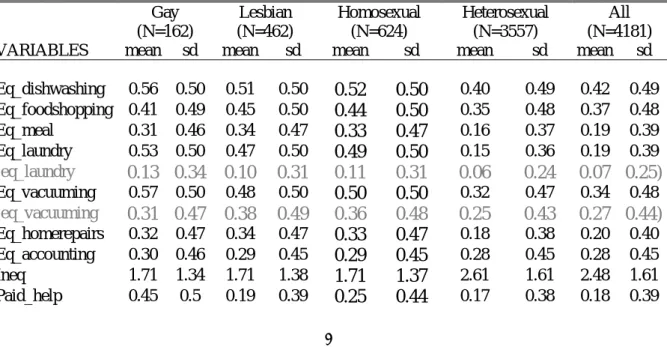
Seven dummy variables “Eq_𝑖 ” with 𝑖 =(dishwashing, foodshopping, meal, laundry, vacuuming, homerepairs, accounting) have been defined to measure the equality/inequality between partners in the sharing of seven comparable tasks between the FHP and ERFI surveys, corresponding respectively to washing dishes, shopping for food, preaparing meals, doing laundry and ironing, vacuuming, doing home repairs, keeping accounts. These variables take the value 0 when the respondent says they are doing more than their partner or their partner is doing more on the task, and the value 1 in all other cases (equal involvement of both partners, nobody performs the task, the task is accomplished by a third party, possibly a paid help). The closer the average value of the variable “Eq_𝑖” is to 1, the more likely the partners are equally involved in the related task. To contrast the cases in which the partners are equally involved in a given task from those where neither of them performs the task, seven “eq_𝑖” variables have also been defined, taking the value 1 only if the respondent answers that both partners are equally involved in task 𝑖, and 0 otherwise. Using this narrower measure of equality in task sharing gives very similar results. Consequently, only the first “Equ_𝑖" measure is reported in Table 2, except for laundry and vacuuming for which both measures differ significantly.
Table 2. The Sharing of Domestic Tasks Within Couples
Gay (N=162) Lesbian (N=462) Homosexual (N=624) Heterosexual (N=3557) All (N=4181) VARIABLES mean sd mean sd mean sd mean sd mean sd Eq_dishwashing 0.56 0.50 0.51 0.50 0.52 0.50 0.40 0.49 0.42 0.49 Eq_foodshopping 0.41 0.49 0.45 0.50 0.44 0.50 0.35 0.48 0.37 0.48 Eq_meal 0.31 0.46 0.34 0.47 0.33 0.47 0.16 0.37 0.19 0.39 Eq_laundry 0.53 0.50 0.47 0.50 0.49 0.50 0.15 0.36 0.19 0.39 (eq_laundry 0.13 0.34 0.10 0.31 0.11 0.31 0.06 0.24 0.07 0.25) Eq_vacuuming 0.57 0.50 0.48 0.50 0.50 0.50 0.32 0.47 0.34 0.48 (eq_vacuuming 0.31 0.47 0.38 0.49 0.36 0.48 0.25 0.43 0.27 0.44) Eq_homerepairs 0.32 0.47 0.34 0.47 0.33 0.47 0.18 0.38 0.20 0.40 Eq_accounting 0.30 0.46 0.29 0.45 0.29 0.45 0.28 0.45 0.28 0.45 Ineq 1.71 1.34 1.71 1.38 1.71 1.37 2.61 1.61 2.48 1.61 Paid_help 0.45 0.5 0.19 0.39 0.25 0.44 0.17 0.38 0.18 0.39
It can be seen in Table 2 that the partners’ involvement in each of the tasks is on average much more balanced in HM couples than in HT couples. The difference between HM and HT couples is the highest for the laundry: in 53% of G couples and 47% of L couples, partners are equally involved in the task, against only 15% of HT couples.5 It is the smaller for accounting that partners share in a very similar way in HM and HT couples, and that also appears to be the more specialized task for HM couples: in 70% of cases, regardless of the type of couple, only one of the two partners keeps the household accounts. Note that this task is far from being the most specialized for HT couples. Indeed, in HT couples, the probability that only one of the two partners takes in charge the laundry, the meal preparation and home repairs is particularly high.
Note that more equality in most tasks, as found for HM couples in Table 2, does not necessarily imply, however, that, globally, HM couples share domestic work more equally than HT couples: an inequality for several tasks does not necessarily imply that the same partner is in charge of most of the tasks which are unequally shared. It could instead reflect a higher degree of specialization of the two partners in different tasks, but a relatively equal burden of household work for each partner. To approximate the inequality in the division of domestic work within the couple, we built the variable “Ineq” reported in Table 2 which represents an aggregate inequality index constructed in the following way: for each couple, we counted the number of tasks performed more by one partner, the number of tasks performed more by the other one, and then took the absolute value of the difference between these two numbers. Thus, the variable “Ineq” can take values ranging from 0 (all tasks are shared equally or, if some task are performed more by one partner, exactly the same number of tasks is performed more by the other one) to 7 (the 7 tasks are performed more by the same partner). Given that, in practice, the inequality index takes the values 6 or 7 for only very few couples, we grouped the 3 highest values (5, 6 and 7) such that, finally, it takes values ranging from 0 to 5. Note that, in constructing the inequality index, we gave the same weight to tasks which are possibly performed only from time to time (laundry or accounting for example) and to more daily tasks (meal preparation). However, taking into account either the periodicity or the average time
5 Note, however that laundry is largely externalized by HM couples, since the difference between the Equ_i and
spent to each task to compute weights would have implied introducing potential large bias, as both periodicity and average time may significantly vary from one couple to another.6 The average value of the inequality index appears to be much higher for HT couples than for HM couples: 2.61 instead of 1.71, although it is the same for G and L couples. In HT couples, not only are partners more often specialized in accomplishing such and such domestic task, but, moreover, the sharing of household chores is much more unequal compared with HM couples. These results are in line with those of the theoretical model of differing social norms between same-sex and heterosexual couples presented in Appendix 1.
As seen previously, however, HT and HM couples, though similar on average in some characteristics, differ in others, such as income or residence location. The aim of the econometric analysis below is to control for most variables by which the two samples differ.
II. The Sharing of Housework: Econometric Analysis
We first ran probit estimations of task by task inequality (measured by 1 Equ_𝑖 for the 7 task
i) on the pooled sample of FHP and ERFI surveys, adding a dummy that takes the value 1 for
HM couples. We then look at a potential “respondent effect”, that is if respondents, regardless their gender and the type of couple they belong to, tend to systematically report that they do more domestic work than by their partner. In a second stage, we run the same estimations but separately on HT and HM couples. In the latter case, we use the dummy “gay” to differentiate G and L couples. For HT couples, we take into account the respondent’s gender, in order to have a first look at the gendered division of labor. In a third stage, we run estimations of global inequality through an ordered probit estimation of the Ineq index. Finally, we run estimations dedicated at showing evidence of a gender effect.
The control variables used in the estimations are those shown in Table 1 above. Among a larger list of possible variables, we kept those which appeared to be significant in the estimations of equality in at least one task, or for the index. The same reason led us to group socio-professional categories in three rather than six groups. Moreover, some variables are not really comparable between the two surveys: the level of education, for example, first is available in FHP for the
respondent only but not for the partner, and second it is not measured exactly in the same way in the two surveys7. Hence we did not use this information in the regressions.
Estimation results for the seven tasks on the pooled sample are given in Table 3. They show that the coefficient of the dummy variable “homo” (equal to 1 for HM couples) is nearly always significant (except for dish-washing), and negative, except for accounting which gets a positive coefficient: all domestic tasks, with the exception of accounting, more specialized among HT couples, are shared more equally in HM couples. The highest coefficients are found for the two tasks which are traditionally the more “gendered”: home repairs and, above all, laundry8. Note, however, that, as mentioned in the previous section, only the results of the estimation of the Ineq inequality index can tell us something about global equality/inequality in the division of domestic tasks between the partners.
Table 3. Probit on the Inequality in the Sharing of Domestic Tasks (All Couples)
VARIABLES Ineq_ dishwashing Ineq_ foodshopping Ineq_ meal Ineq_ laundry Ineq_ vacuuming Ineq_ homerepairs Ineq_ accounting homo -0.0660 -0.168*** -0.322*** -0.615*** -0.147** -0.414*** 0.251*** (0.0631) (0.0640) (0.0675) (0.0724) (0.0658) (0.0677) (0.0666) nb_children -0.0621*** 0.0585*** 0.00157 -0.0256 -0.00652 0.00724 0.00629 (0.0206) (0.0210) (0.0236) (0.0250) (0.0215) (0.0232) (0.0213) stepchildren 0.0498 -0.0487 0.00785 0.0114 0.0627 -0.0896 -0.0483 (0.0539) (0.0543) (0.0600) (0.0660) (0.0564) (0.0594) (0.0558) dif_employ 0.255*** 0.0775 0.118** 0.00870 0.0845 0.0171 -0.103** (0.0498) (0.0505) (0.0578) (0.0635) (0.0521) (0.0557) (0.0514) dif_income 0.0578*** 0.0208 0.0681*** 0.0523*** 0.0853*** 0.00224 0.0694*** (0.0162) (0.0184) (0.0216) (0.0196) (0.0176) (0.0184) (0.0190) relation_length 0.00978*** 0.00865*** 0.0139*** 0.0165*** 0.00830*** 0.00314 0.0124*** (0.00214) (0.00215) (0.00249) (0.00277) (0.00226) (0.00241) (0.00224) rural 0.0123 0.0837 0.101* 0.157** 0.0875 -0.0727 0.0286 (0.0509) (0.0518) (0.0597) (0.0700) (0.0539) (0.0573) (0.0538) large_city 0.00303 -0.0380 0.0124 -0.145** -0.00992 0.0220 -0.0140 (0.0495) (0.0500) (0.0565) (0.0617) (0.0521) (0.0560) (0.0520) owner -0.113** 0.245*** 0.0172 0.140** 0.123** 0.145*** 0.0842 (0.0507) (0.0508) (0.0571) (0.0630) (0.0528) (0.0560) (0.0525) idf 0.0593 -0.131** -0.0440 -0.112 0.00314 0.0237 -0.121* (0.0600) (0.0608) (0.0680) (0.0707) (0.0632) (0.0680) (0.0625) spc_indep 0.233** 0.639*** 0.245** -0.307** 0.101 -0.161 0.296*** (0.100) (0.105) (0.124) (0.127) (0.108) (0.108) (0.107) spc_highocc -0.00477 0.457*** 0.0830 -0.197** -0.122* -0.0419 0.0648 (0.0696) (0.0708) (0.0817) (0.0937) (0.0741) (0.0788) (0.0729) spc_lowocc -0.0549 0.358*** -0.0222 0.0279 -0.267*** 0.0163 0.172**
7 What is recorded is the highest diploma in FHP and the highest level of education in ERFI (which does not imply
to have obtained the diploma).
8
European time-use surveys show that domestic tasks involving clothes as well as construction and repair activities are highly gendered, the former being performed mostly (and sometimes exclusively) by women, and the latter by men (e.g. Winqvist, 2004)
(0.0709) (0.0714) (0.0825) (0.0999) (0.0751) (0.0809) (0.0742) monthincome -0.140*** 0.0338 -0.0552* -0.137*** -0.182*** 0.00635 -0.0522* (0.0276) (0.0287) (0.0319) (0.0332) (0.0305) (0.0309) (0.0292) help 0.0634 -0.0378 0.00296 -1.050*** -0.924*** -0.0972 0.0370 (0.0571) (0.0582) (0.0673) (0.0647) (0.0586) (0.0635) (0.0611) Constant 0.240** -0.475*** 0.564*** 1.181*** 0.625*** 0.790*** 0.169 (0.105) (0.107) (0.120) (0.134) (0.112) (0.118) (0.109) Observations 4,181 4,181 4,181 4,105 4,181 4,181 4,181
Standard errors in parentheses *** p<0.01, ** p<0.05, * p<0.1
Looking at the impact of other control variables upon the inequality in the sharing of each of the various tasks, we have to remain cautious at this stage as the HT sample is much bigger than the HM sample. However, it is worth noting that, in accordance with the models of intra-household decision-making, an income differential between partners has a positive effect on inequality. This is true for all the seven tasks and almost always significant. Similarly, but less significantly, a differential in the employment status of partners has a positive impact (except for accounting). Conversely, an increase in the average monthly income of partners has a negative effect, when significant, on the inequality for each task. As expected, the length of the relationship has a positive impact on the inequality in the sharing of the various tasks: in older couples, partners are more often specialized.
Most other control variables have significant impacts only on a few tasks, and some of them have impacts that can be either positive or negative depending on the task considered. Couples living in Ile-de-France share more equally food shopping and accounting. Benefiting from an outside paid help reduces inequality for laundry and vacuuming. Socio-professional categories have a less clear impact: compared to the reference group, belonging to the category “independents”9 increases inequality for dish-washing, food shopping, meal preparation and
accounting, but it decreases it for laundry. Similarly, belonging to intermediate and higher occupations reduces inequality for laundry and vacuuming, but increases it for food shopping. For the “employees/workers” group, however, though a negative impact on inequality is also found for vacuuming, and a positive impact on food shopping, no effect appears for laundry and a positive effect for accounting. Having more children reduces inequality in dish-washing but increases it in food shopping, and couples being home owners tend to share the various tasks less equally, with the exception of dish-washing for which the coefficient is significantly negative. Finally, the geographical location has no significant effect, except for the laundry task
that couples living in rural areas tend to share less equally, while the opposite holds for couples living in large cities. Given the imbalance in the size of the samples, these results are mainly driven by the characteristics of the heterosexual couples, what will be confirmed by the results of the regressions ran separately on the HM and HT samples.
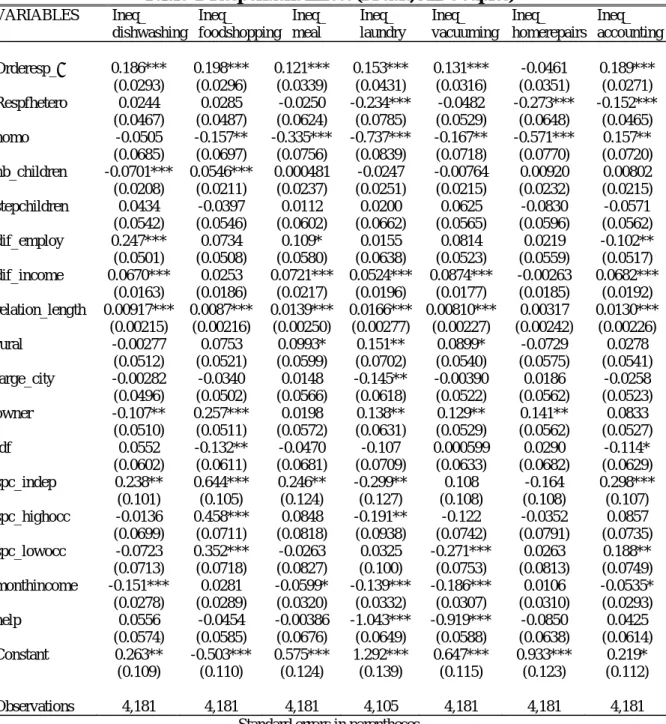
But before examining in more details the results on these two separated samples, let us show evidence of a “respondent effect”. This have been done by constructing the dummy variables “Orderesp_ 𝑖”, with 𝑖 = (dishwashing, foodshopping, meal, laundry, vacuuming, homerepairs, accounting), that have been constructed in the following way: for task 𝑖, it takes the value -1 if
Table 4. Respondent Effect (Probit, All Couples)
VARIABLES Ineq_ dishwashing Ineq_ foodshopping Ineq_ meal Ineq_ laundry Ineq_ vacuuming Ineq_ homerepairs Ineq_ accounting Orderesp_𝑖 0.186*** 0.198*** 0.121*** 0.153*** 0.131*** -0.0461 0.189*** (0.0293) (0.0296) (0.0339) (0.0431) (0.0316) (0.0351) (0.0271) Respfhetero 0.0244 0.0285 -0.0250 -0.234*** -0.0482 -0.273*** -0.152*** (0.0467) (0.0487) (0.0624) (0.0785) (0.0529) (0.0648) (0.0465) homo -0.0505 -0.157** -0.335*** -0.737*** -0.167** -0.571*** 0.157** (0.0685) (0.0697) (0.0756) (0.0839) (0.0718) (0.0770) (0.0720) nb_children -0.0701*** 0.0546*** 0.000481 -0.0247 -0.00764 0.00920 0.00802 (0.0208) (0.0211) (0.0237) (0.0251) (0.0215) (0.0232) (0.0215) stepchildren 0.0434 -0.0397 0.0112 0.0200 0.0625 -0.0830 -0.0571 (0.0542) (0.0546) (0.0602) (0.0662) (0.0565) (0.0596) (0.0562) dif_employ 0.247*** 0.0734 0.109* 0.0155 0.0814 0.0219 -0.102** (0.0501) (0.0508) (0.0580) (0.0638) (0.0523) (0.0559) (0.0517) dif_income 0.0670*** 0.0253 0.0721*** 0.0524*** 0.0874*** -0.00263 0.0682*** (0.0163) (0.0186) (0.0217) (0.0196) (0.0177) (0.0185) (0.0192) relation_length 0.00917*** 0.0087*** 0.0139*** 0.0166*** 0.00810*** 0.00317 0.0130*** (0.00215) (0.00216) (0.00250) (0.00277) (0.00227) (0.00242) (0.00226) rural -0.00277 0.0753 0.0993* 0.151** 0.0899* -0.0729 0.0278 (0.0512) (0.0521) (0.0599) (0.0702) (0.0540) (0.0575) (0.0541) large_city -0.00282 -0.0340 0.0148 -0.145** -0.00390 0.0186 -0.0258 (0.0496) (0.0502) (0.0566) (0.0618) (0.0522) (0.0562) (0.0523) owner -0.107** 0.257*** 0.0198 0.138** 0.129** 0.141** 0.0833 (0.0510) (0.0511) (0.0572) (0.0631) (0.0529) (0.0562) (0.0527) idf 0.0552 -0.132** -0.0470 -0.107 0.000599 0.0290 -0.114* (0.0602) (0.0611) (0.0681) (0.0709) (0.0633) (0.0682) (0.0629) spc_indep 0.238** 0.644*** 0.246** -0.299** 0.108 -0.164 0.298*** (0.101) (0.105) (0.124) (0.127) (0.108) (0.108) (0.107) spc_highocc -0.0136 0.458*** 0.0848 -0.191** -0.122 -0.0352 0.0857 (0.0699) (0.0711) (0.0818) (0.0938) (0.0742) (0.0791) (0.0735) spc_lowocc -0.0723 0.352*** -0.0263 0.0325 -0.271*** 0.0263 0.188** (0.0713) (0.0718) (0.0827) (0.100) (0.0753) (0.0813) (0.0749) monthincome -0.151*** 0.0281 -0.0599* -0.139*** -0.186*** 0.0106 -0.0535* (0.0278) (0.0289) (0.0320) (0.0332) (0.0307) (0.0310) (0.0293) help 0.0556 -0.0454 -0.00386 -1.043*** -0.919*** -0.0850 0.0425 (0.0574) (0.0585) (0.0676) (0.0649) (0.0588) (0.0638) (0.0614) Constant 0.263** -0.503*** 0.575*** 1.292*** 0.647*** 0.933*** 0.219* (0.109) (0.110) (0.124) (0.139) (0.115) (0.123) (0.112) Observations 4,181 4,181 4,181 4,105 4,181 4,181 4,181 Standard errors in parentheses
*** p<0.01, ** p<0.05, * p<0.1
the respondent indicates that he/she does less of the task than his/her partner, +1 if the respondent says that he/she does more of the task, and 0 if the respondent reports an equal sharing of the task. As respondents are nearly as often men than women, if the respondent did not tend to systematically report more charge of domestic tasks than attributed to his/her partner, Oderesp_𝑖 should have no significant effect for any task. Note that, again the other variables are used as control variables. To make sure that the slight disequilibrium between the number of male and female respondents in the ERFI survey (about 40/60) has no effect on the result, we add a control for the respondent’s gender in the sample of heterosexual couples (Respfhetero, equal to 1 if the respondent is a woman and 0 otherwise). Estimations are made on the pooled sample of the two surveys. The results are shown in Table 4.
With the exception of home repairs, for all other tasks, the respondent tends to report that he/she does more than his/her partner (the coefficient of Orderesp_𝑖 is always significantly positive except for home repairs). Also note that, in heterosexual couples, women tend to report significantly less inequalities than men for laundry, home repairs and accounting, but there is no significant impact for the other tasks: compared to male respondents, female respondents tend to moderate the “respondent effect”, at least for some tasks.
Let us now turn to the results of a separate estimation on the sample of HM couples10, with two objectives: first verify that the previous results hold for this much smaller sample, and, second, look if a difference appears between G and L couples. For this, a dummy variable gay (equal to 1 for gay couples) has been added. The results are reported in Table 5.
The first notable result is that, concerning the sharing of domestic tasks, there is no significant difference between G couples and L couples, since the impact of the gay dummy variable is never significant. Also note that if fewer control variables are significant, with a few exceptions, those which remain significant merely show reinforced results compared to those obtained on the pooled sample. This is true for being home owner, for example, which now has an almost always significant positive impact. The same holds for the income gap between partners that
10 The separate estimation on HT couples is given in Appendix 2 as its results are very similar to those obtained
tends to increase inequality. The effect of the length of the relationship is less clear, as it appears to decrease inequality in the case of washing dishes. Similarly, external paid help still has a negative effect on laundry and vacuuming but it also has a significant positive impact on accounting. Note that the presence of stepchildren significantly increases inequality in the sharing of laundry.
Table 5. Probit on the Inequality in the Sharing of Domestic Tasks in HM couples VARIABLES Ineq_ dishwashing Ineq_ foodshopping Ineq_ meal Ineq_ laundry Ineq_ vacuuming Ineq_ homerepairs Ineq_ accounting gay -0.0904 0.202 0.0849 0.154 0.200 0.0127 -0.163 (0.130) (0.133) (0.136) (0.150) (0.148) (0.138) (0.139) nb_children -0.0244 -0.00824 -0.00671 -0.116 0.0995 0.0508 0.0250 (0.0618) (0.0619) (0.0628) (0.0711) (0.0670) (0.0635) (0.0653) stepchildren -0.121 -0.124 0.0585 0.375*** 0.0693 0.130 -0.00347 (0.125) (0.126) (0.128) (0.142) (0.137) (0.132) (0.134) dif_employ 0.0596 0.0479 0.206 -0.104 0.0683 0.133 -0.0831 (0.128) (0.129) (0.134) (0.142) (0.137) (0.136) (0.135) dif_income 0.0463 0.0219 0.00844 0.0994** 0.00501 0.164*** 0.0905* (0.0444) (0.0450) (0.0455) (0.0497) (0.0523) (0.0489) (0.0486) relation_length -0.0182* 0.0250** 0.00599 0.0208* 0.00752 0.00597 0.0121 (0.00967) (0.00979) (0.00973) (0.0109) (0.0105) (0.00997) (0.0103) rural 0.224 0.281* -0.221 0.175 -0.0208 -0.166 0.0453 (0.154) (0.158) (0.157) (0.179) (0.165) (0.161) (0.166) large_city 0.0375 -0.0144 -0.168 -0.0109 0.0703 -0.176 0.0633 (0.117) (0.118) (0.121) (0.131) (0.128) (0.122) (0.124) owner 0.230** 0.220* 0.131 0.282** 0.349*** 0.290** 0.187 (0.115) (0.115) (0.119) (0.132) (0.124) (0.119) (0.121) idf 0.206* 0.00305 -0.0207 0.0221 0.139 -0.0722 -0.150 (0.124) (0.125) (0.128) (0.136) (0.136) (0.129) (0.130) spc_indep -0.260 0.272 -0.334 -1.606*** -0.722 0.0658 0.333 (0.412) (0.425) (0.425) (0.576) (0.479) (0.417) (0.462) spc_highocc 0.0540 0.779** -0.102 -0.716* -0.375 0.491 -0.112 (0.319) (0.336) (0.338) (0.422) (0.353) (0.322) (0.340) spc_lowocc -0.290 0.570 -0.0673 -0.474 -0.466 0.507 0.111 (0.332) (0.347) (0.350) (0.436) (0.363) (0.335) (0.354) monthincome -0.0567 -0.0813 0.0140 -0.128* -0.0807 -0.0114 -0.0736 (0.0640) (0.0642) (0.0656) (0.0745) (0.0757) (0.0658) (0.0679) help -0.106 0.000764 0.00855 -1.001*** -1.747*** -0.104 0.327** (0.144) (0.146) (0.149) (0.166) (0.182) (0.151) (0.160) Constant 0.0686 -0.784** 0.375 0.786* 0.379 -0.400 0.445 (0.346) (0.362) (0.363) (0.457) (0.380) (0.353) (0.370) Observations 624 624 624 548 624 624 624
Standard errors in parentheses. *** p<0.01, ** p<0.05, * p<0.1
Let us now turn to global inequality of the division of domestic chores within the couple. Previously, we raised the question of the meaning of results showing an unequal sharing of each task, all things being equal: an inequality for several tasks does not necessarily imply that the same partner is in charge of most of the tasks which are unequally shared. It could instead reflect a higher degree of specialization of the two partners in different tasks, but a relatively equal burden for each partner. We already verified in Table 4 that, in heterosexual couples, women are more in charge of most tasks. We now confirm that homosexual couples share tasks more equally, using the inequality index presented in Section 1. The results of an ordered probit
estimation of the inequality index Ineq (which takes values 0 to 5, as described in Section 1) are shown in Table 6.
Table 6. Estimation of Inequality in Task Sharing (oprobit)
All HM Couples HT Couples VARIABLES Ineq Ineq Ineq homo -0.288*** (0.0521) gay -0.0397 (0.107) nb_children 0.0299* 0.0875* 0.0205 (0.0168) (0.0504) (0.0183) stepchildren 0.0274 -0.0252 0.0376 (0.0440) (0.103) (0.0501) dif_employ 0.132*** 0.0427 0.139*** (0.0403) (0.106) (0.0438)
dif_income 4.65e-05*** 6.03e-05* 5.88e-05*** (1.31e-05) (3.64e-05) (1.46e-05) relation_length 0.0133*** 0.00309 0.0133*** (0.00174) (0.00788) (0.00185) rural 0.187*** 0.0703 0.173*** (0.0414) (0.127) (0.0443) large_city -0.113*** 0.143 -0.171*** (0.0403) (0.0967) (0.0449) owner -0.00964 0.0277 -0.0104 (0.0413) (0.0950) (0.0461) idf -0.0712 -0.214** -0.0382 (0.0490) (0.102) (0.0568) spc_indep 0.514*** -0.396 0.572*** (0.0810) (0.336) (0.0848) spc_highocc 0.130** -0.465* 0.166*** (0.0564) (0.262) (0.0590) spc_locc 0.188*** -0.469* 0.227*** (0.0575) (0.273) (0.0598)
monthincome -7.31e-05*** 2.77e-05 -0.000110*** (2.25e-05) (5.24e-05) (2.57e-05)
help -0.183*** -0.0655 -0.216***
(0.0463) (0.118) (0.0507)
Observations 4,181 624 3,557 Standard errors in parentheses
*** p<0.01, ** p<0.05, * p<0.1
The results confirm and synthesize those obtained task by task. Let us note first the very significant negative effect of the dummy variable “homo”: heterosexual couples are less egalitarian in the sharing of household tasks than homosexual couples, a result that can be clearly attributed to a “gender effect” that will be highlighted in the following. No surprise either about other significant variables, however aggregating tasks sheds more light upon the global picture as most control variables are now significant, with the exception of stepchildren:
inequality increases with the number of children, with the differences in employment status and incomes, with the length of the relationships, and with rural location. Conversely, inequality decreases, when the couple lives in large cities, when the average monthly income of partners is higher, and when the couple employs a housekeeper.
Now, in order to examine the gendered dimension of the sharing of domestic tasks within heterosexual couples, we ran slightly modified probit regressions on the HT sample, whose results are reported in Table 7. Most of the explaining variables are the same as in Table 5, with two exceptions. First, the income gap is now gendered and measured by the variable “dif_incomef”, as the male monthly income minus the female monthly income. Second, in a similar way as when examining the respondent effect, we added for each task 𝑖, a dummy variables Orderf_ 𝑖 with 𝑖 = (dishwashing, foodshopping, meal, laundry, vacuuming, homerepairs, accounting) that is constructed in the following way: for task 𝑖, it takes the value -1 if the woman does less of the task than her partner, +1 if she does more of the task, and 0 if partners share the task equally. Hence if a task is shared unequally within some couples, but equally between men and women across couples, Oderf_𝑖 will have no significant effect for this task, while it will have a positive significant effect if on average women are mainly in charge of performing this task within couples, and a negative effect in the opposite case, that is if men are mainly in charge of the task.
The results of these regressions (Table 7) confirm the usual result that, all things being equal, women do more domestic tasks than men, with the (expected) exception of home-repair activities. Indeed, the dummy variable “Order_𝑖” has a significantly positive effect for all tasks, with the exception of home repairs (the coefficient of which is significantly negative), meaning that women are disproportionally in charge of domestic tasks, compared to men. This gender inequality in the sharing of tasks is the highest for laundry (which is in line with the literature, see e.g. Winqvist, 2004), followed by home repairs (the only “masculine” task) and the lowest for accounting. The income gap has a significant positive effect on inequality for vacuuming and accounting, and the difference in employment status has a significant positive impact for dish-washing, meal preparation and laundry but negative on accounting. The length of the relationship has a significant positive impact on inequality for all tasks except for home repairs. Conversely, a higher average income of couple members is merely a factor of more equality (a negative coefficient, significant for washing dishes, laundry and vacuuming). Compared to the reference category, belonging to the low or high social categories decreases inequality for vacuuming but increases it for food shopping. The number of children significantly decreases
inequality in washing dishes, food shopping and laundry as does the presence of stepchildren, but only for laundry.
Table 7. Gender Effect in the Inequality of the Sharing of Domestic Tasks in HT couples VARIABLES Ineq_ dishwashing Ineq_ foodshopping Ineq_ meal Ineq_ laundry Ineq_ vacuuming Ineq_ homerepairs Ineq_ accounting Orderf_i 0.688*** 0.797*** 0.877*** 1.394*** 0.946*** -1.199*** 0.268*** (0.0356) (0.0361) (0.0413) (0.0555) (0.0385) (0.0444) (0.0326) nb_children -0.0768*** 0.0525** -0.0222 -0.0804** -0.0355 -0.0139 -0.0111 (0.0259) (0.0264) (0.0323) (0.0364) (0.0278) (0.0331) (0.0254) stepchildren 0.0552 0.0499 0.0413 -0.199* -0.00799 -0.105 -0.0572 (0.0696) (0.0709) (0.0837) (0.102) (0.0755) (0.0873) (0.0691) dif_employ 0.250*** 0.0140 0.151** 0.165* 0.0587 0.0696 -0.110* (0.0613) (0.0623) (0.0760) (0.0971) (0.0665) (0.0776) (0.0599) dif_incomef 0.00922 0.0120 0.00898 0.00764 0.0294* 0.0217 0.0326** (0.0150) (0.0168) (0.0195) (0.0214) (0.0167) (0.0203) (0.0165) relation_length 0.00992*** 0.00782*** 0.0122*** 0.0120*** 0.00697** 0.00483 0.0136*** (0.00257) (0.00260) (0.00324) (0.00394) (0.00283) (0.00329) (0.00259) rural -0.0303 -0.0537 0.143* 0.0641 0.0343 0.0168 -0.0338 (0.0630) (0.0653) (0.0791) (0.105) (0.0695) (0.0807) (0.0641) big_city 0.0400 -0.00617 0.135* -0.0634 0.0431 0.0232 -0.0209 (0.0627) (0.0646) (0.0785) (0.0966) (0.0688) (0.0815) (0.0636) owner -0.211*** 0.163** -0.0887 -0.0682 -0.0282 -0.106 0.0196 (0.0640) (0.0647) (0.0776) (0.0973) (0.0693) (0.0822) (0.0638) idf 0.0281 -0.153* -0.0591 -0.112 0.0440 0.0909 -0.122 (0.0782) (0.0806) (0.0982) (0.110) (0.0853) (0.105) (0.0788) spc_indep 0.194 0.428*** 0.217 -0.209 -0.0891 0.0365 0.332** (0.132) (0.140) (0.175) (0.193) (0.148) (0.156) (0.134) spc_highocc 0.0994 0.360*** 0.189* -0.0795 -0.285*** 0.0500 0.0932 (0.0831) (0.0852) (0.105) (0.137) (0.0929) (0.107) (0.0837) spc_lowocc 0.0149 0.218** -0.0145 -0.102 -0.428*** -0.0355 0.141* (0.0838) (0.0849) (0.104) (0.144) (0.0936) (0.108) (0.0845) monthincome -0.0824*** 0.0404 0.0124 0.102** -0.0934*** -0.0232 -0.00424 (0.0294) (0.0324) (0.0370) (0.0398) (0.0326) (0.0391) (0.0310) help 0.165** 0.0538 0.0224 -0.847*** -0.729*** 0.0582 0.0264 (0.0729) (0.0755) (0.0929) (0.0948) (0.0762) (0.0949) (0.0749) Constant 0.0633 -0.504*** 0.210 0.743*** 0.514*** 0.350** 0.174 (0.128) (0.131) (0.158) (0.193) (0.141) (0.163) (0.128) Observations 2,993 2,993 2,993 2,993 2,993 2,993 2,993
Standard errors in parentheses *** p<0.01, ** p<0.05, * p<0.1
In the following section we try to go further with the “gender effect” shown in Table 7 by proposing a measure of the social gender effects (reflecting gender norms and stereotypes) in explaining the unequal distribution of household chores within heterosexual couples, using a Blinder-Oaxaca type decomposition method.
III. Measuring Social Norms
Returning to the results of the theoretical model in in Appendix 1, we are interested in the inequality gap in the sharing of domestic tasks in the couple, between homosexual and heterosexual couples. We restrict our attention to the difference in mean inequality between the two populations. Under these conditions, the Blinder-Oaxaca (Blinder, 1973; Oaxaca, 1973) decomposition is applicable. The difference in group-means of the inequality index is decomposed into between group differences in the means of observable characteristics, on the one hand, and differences in the effects of these characteristics, as represented by regression coefficients, on the other. This latter part of the inequality differential may be interpreted as a measure of the effect of social gender norms and stereotypes on the choices of heterosexual couples.
Let us assume in first approximation than the inequality index is linearly related to a set of observable determinants (𝑋) and additive unobservables 𝜀 as follows:
𝐼𝑛𝑒𝑞 𝑋 𝛽 𝜀 , 𝑗 𝐻𝑀, 𝐻𝑃 1
where 𝛽 includes an intercept. In order for the unobservables to drop out of the decomposition of the group difference in means, it is necessary to assume that, within each group, 𝜀 is assumed independent of 𝑋 . The HT-HM difference in mean inequality can then be estimated by:
𝐼𝑛𝑒𝑞 𝐼𝑛𝑒𝑞 𝑋 𝑋 𝛽 𝑋 𝛽 𝛽 2
where 𝑋 is a vector of the j-group specific sample means of covariates and 𝛽 is the associated vector of ordinary least squares (OLS) estimates obtained from the respective sample. The decomposition (2) is derived from a particular counterfactual. The first term shows the gap that would prevail if the inequality of both groups was determined as that of the HM couples. The second term indicates the inequality the HT couples would reach, on average, if their sharing of task was determined as that of the HM. As, contrarily to heterosexual couples, homosexual couples are expected not to be11 influenced by traditional gender norms in their division of
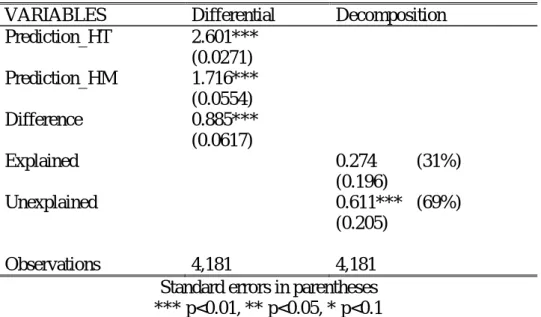
household chores, we choose to use this group’s inequality as the reference on which to build counterfactual. The results of this decomposition are given in Table 8.
The mean gap in inequality in the sharing of domestic tasks within HT and HM couples amounts to 0.885. 31% of this gap can be explained by the differences in characteristics of the two populations, but the remaining 69% are unexplained and can be attributed to social gender norms and stereotypes.
Table 8. Blinder-Oaxaca Decomposition of the Inequality Gap (OLS)
VARIABLES Differential Decomposition Prediction_HT 2.601*** (0.0271) Prediction_HM 1.716*** (0.0554) Difference 0.885*** (0.0617) Explained 0.274 (31%) (0.196) Unexplained 0.611*** (69%) (0.205) Observations 4,181 4,181 Standard errors in parentheses
*** p<0.01, ** p<0.05, * p<0.1
This decomposition is a first approximation but may be misleading since ordinary least squares have been applied whereas the estimation of a nonlinear ordered probit model is required given that we have an ordinal dependent variable. An extension of the Blinder-Oaxaca decomposition to nonlinear regression models was developed by Bauer and Sinning (2008). Following their approach, we performed a Blinder–Oaxaca decomposition of the mean inequality differential based of the estimation of an ordered probit model. The results reported in Table 9 confirm that a major share of the inequality gap in the sharing of domestic tasks between HT and HM couples (59%) can be attributed to social gender effects.
Table 9. Blinder-Oaxaca Decomposition of the Inequality Gap (oprobit)
Number of obs (HT) = 3557 Number of obs (HM) = 624
Results Coef. Percentage
Explained .4028 41.04%
Unexplained .5787 58.96%
Put differently, another interpretation of the results is that between 60% and 70% of the gap between heterosexual and same-sex couples can be attributed to gender norms and/or stereotypes, which conversely implies that only about 30% to 40% of the gender differential in the sharing of domestic tasks in heterosexual couples can be attributed to socio-economic variables in an efficiency framework. The latter figures can be considered a maximum as they are obtained under the strong assumption that same-sex couples totally escape gender norms. These results imply large values for 𝑔 and 𝑔 see Appendix 1 below , which stand for the intensity of gender norms in household work.
Concluding remarks
We compare the sharing of a the main household tasks between homosexual and heterosexual couples. To do this, we run econometric estimations in order to control for couple’s members characteristics and socio-economic variables, such as wages or social categories and thus eliminate, as much as possible, the effect of differences in the structure of the two populations. We do find the expected influence of economic variables (such as wages), but our first estimations confirm what is generally found in the literature, i.e. homosexual partners share household tasks more equally than heterosexual partners: all domestic tasks, with the exception of accounting, more specialized among HT couples, are shared more equally in HM couples. Moreover, when the tasks are aggregated, and controlling for most socio-economic variables, we find that heterosexual couples are less egalitarian in the sharing of total household tasks than homosexual couples, a result that, as we show, can be clearly attributed to a “gender effect”. We then propose a measure of this gender effect, which can be attributed to gender norms and stereotypes, as economic inequalities have been controlled for. To do this, we run a Blinder-Oaxaca type decomposition, assuming that the behavior of same-sex couples is not affected by social norms that assign each gender a role in the family, i.e. taking the sharing of same-sex couples as the norm “without discrimination”. Our results show that between 60% and 70% of the gap between heterosexual and same-sex couples can be attributed to gender norms and stereotypes, which conversely implies that only about 30% to 40% of the gender differential in the sharing of domestic tasks in heterosexual couples can be attributed to socio-economic variables.
Our results rely on the comparison of two surveys, whose questions are close but not totally comparable for all domestic tasks and, especially for parental tasks, which we could not include
in the comparison. A further work would consist in using a survey which includes the two populations. This survey, yet to be run, would include an over representation of same-sex couples compared to a representative household survey, and ask questions relative to all domestic and parental tasks.
Appendix 1
I. A model of differing social norms12 between same-sex and heterosexual couples
The following model stems from the literature on collective models including household production, on the one hand (Apps and Rees 1997, Chiappori, 1997, Rapoport et al, 2011) and on the theory of employer discrimination (Becker 1957) on the other hand. Indeed, social norms add psychological costs to usual monetary costs taken into account in economic models (Akerloff and Kranton, 2000). Our main assumption here is that deviating from the traditional gender division of labor where the woman is mainly in charge of household work implies a psychological cost to heterosexual couples. In contrast, same-sex couples do not suffer the same psychological costs whatever their way of sharing domestic tasks13. As psychological costs here originate from the production side (the sharing of tasks), it can be included in a simple way in an equilibrium model using Becker’s theory of employer discrimination. Indeed, in the discrimination model, the wage of people belonging to the group discriminated against are over-evaluated (psychological costs are added to monetary costs) and those of the dominant group under-evaluated (the psychological costs are subtracted). Here, in the same way, considering heterosexual couples and aggregate domestic work, the cost of time in domestic work of people whose gender role is to perform it (namely women) is under-evaluated , while over-evaluation stands for men who perform domestic production: the gender social norm acts here as a psychological cost, added when the “wrong” person performs the work, and conversely subtracted when it is the “right” person.
𝑢 𝑙 , 𝐶 𝜇 . 𝑢 𝑙 , 𝐶 (2)
𝑠𝑢𝑏𝑗𝑒𝑐𝑡 𝑡𝑜 𝐶 𝐶 𝑙 𝑤 𝑙 𝑤 𝑇𝑤 𝑇𝑤 𝑦 𝜋 𝑤 ,𝑤 (2)
Where y represents the household’s non-labour income, and 𝜇 =𝜇 𝑤 , 𝑤 , 𝑦 is a weighting factor of 1 and 2’s utilities. 𝜋 𝑤 ,𝑤 is the profit function from household production.
Under the usual assumptions, the household maximization program could be thought of as decentralized in three steps. In a first stage, the household would maximize the profit from household production:
12 The model developed in this section could as well apply to gender stereotypes, defined as false beliefs about
respective women’s and men’s productivity in household production (see Couprie et al, 2019)
13 Of course, this is not to say that they could not suffer from other types of psychological/discrimination costs
max
, 𝜋 𝑌 𝑤 𝑡 𝑤 𝑡 (3) This allows to determine 𝑡 and 𝑡 , domestic work times.
In a second stage, spouses agree on the sharing of full income. Full income contains household non labor income and profit from household production. Each spouse receives the share Ψ 𝑗 1,2 .
In the third stage, the couple’s members separately maximize their own utility function, under their own budget constraint, in order to determine quantities of leisure 𝑙 and consumption 𝐶 𝑗 1,2 . max , 𝑢 𝑙 , 𝐶 𝐶 𝑙 𝑤 Ψ w 𝐿 𝑙 𝐿 𝑡 𝑇
The model above represents a gender neutral couple, which, in our case, stands for a same-sex couple. Considering now an heterosexual couple, gender social norms or stereotypes, in the context of household production, can be represented in a similar way as a simple discrimination model (Becker, 1957): assuming 1= the woman and 2= the man, the cost of the time w1
(corresponding to her market wage) spent by the woman at household work is under-evaluated while that spent by the man w2 (corresponding to his market wage) is over-evaluated. Let us
concentrate upon the first stage described above, which represents the production side of the Pareto-optimal equilibrium of the model: to the monetary household profit is now added a psychological component so that equation (3) becomes:
max
, 𝜋 𝑝𝑌 𝑤 1 𝑔 𝑡 𝑤 1 𝑔 𝑡 (3’)
𝑔 𝑟𝑒𝑠𝑝. 𝑔 are both >0 (𝑔 <1) and stand for the intensity of gender norms i. e. the under- (resp. over-) evaluation of women’s (resp. men’s) costs in household work.
With household production function ℎ 𝑡 , 𝑡 ; 𝒛 kept constant the equilibrium domestic times for heterosexual couples become: 𝑤 1 𝑔 and 𝑤 1 𝑔 14 . Hence,
14 An alternative assumption that would bring the same result is to add a “psychological” productivity component:
both couple’s members believe that the woman’s productivity is / 1 𝑔 i.e. higher than it really is, and
compared to a same-sex couple with same members’ wages and same household production function, the woman will spend more time and the man will spend less time to household production. Two remarks can be added:
1/ Women will also tend to spend more time at household work and less time on the labor market than men even in couples where their wage equals or is higher than their husband’s (see Sofer & Thibout 2019)
2/ Adding psychological costs on the production side (or, as implied by stereotypes, false beliefs upon productivity, see note 14) permits at first sight to keep the benefits of the separability assumption of the general equilibrium model with production. However, though the corresponding equilibrium is the result of an optimization problem, it is nevertheless certainly not the first best standard optimum.
Appendix 2
Table A1. Probit on the sharing of domestic tasks (HT couples)
VARIABLES Ineq_ dishwashing Ineq_ foodshopping Ineq_ meal Ineq_ laundry Ineq_ vacuuming Ineq_ homerepairs Ineq_ accounting nb_children -0.0629*** 0.0736*** -0.00158 -0.0279 -0.0208 -0.0108 0.000887 (0.0226) (0.0229) (0.0263) (0.0276) (0.0233) (0.0255) (0.0232) stepchildren 0.0925 -0.00672 -0.0166 -0.0893 0.0336 -0.182*** -0.0554 (0.0619) (0.0621) (0.0703) (0.0769) (0.0642) (0.0690) (0.0633) dif_employ 0.279*** 0.0791 0.0949 0.0576 0.0897 -0.00244 -0.107* (0.0545) (0.0552) (0.0645) (0.0725) (0.0569) (0.0616) (0.0559) dif_income 0.0618*** 0.0154 0.0889*** 0.0481** 0.0945*** -0.0209 0.0697*** (0.0180) (0.0208) (0.0253) (0.0225) (0.0193) (0.0203) (0.0210) relation_length 0.0113*** 0.0087*** 0.0139*** 0.0158*** 0.00738*** 0.00170 0.0126*** (0.00229) (0.00229) (0.00270) (0.00297) (0.00240) (0.00261) (0.00238) rural -0.0152 0.0556 0.164** 0.140* 0.0986* -0.0425 0.0246 (0.0546) (0.0555) (0.0653) (0.0775) (0.0577) (0.0621) (0.0575) large_city -0.00733 -0.0449 0.0702 -0.173** -0.0171 0.0769 -0.0261 (0.0554) (0.0560) (0.0649) (0.0717) (0.0580) (0.0642) (0.0581) proprio -0.196*** 0.250*** -0.0108 0.106 0.0771 0.0821 0.0607 (0.0572) (0.0569) (0.0657) (0.0730) (0.0592) (0.0644) (0.0586) idf 0.0109 -0.167** -0.0518 -0.162* -0.00670 0.0399 -0.114 (0.0701) (0.0710) (0.0823) (0.0842) (0.0733) (0.0827) (0.0726) spc_indep 0.318*** 0.699*** 0.323** -0.260* 0.157 -0.152 0.295*** (0.106) (0.112) (0.135) (0.134) (0.113) (0.114) (0.111) spc_highocc -0.00469 0.401*** 0.109 -0.198** -0.117 -0.0982 0.0896 (0.0728) (0.0741) (0.0865) (0.0986) (0.0772) (0.0831) (0.0762) spc_lowocc -0.0111 0.338*** -0.0285 0.0254 -0.255*** -0.00415 0.169** (0.0739) (0.0742) (0.0865) (0.106) (0.0780) (0.0851) (0.0771) monthincome -0.156*** 0.0584* -0.0844** -0.146*** -0.199*** 0.0275 -0.0535 (0.0315) (0.0332) (0.0376) (0.0379) (0.0342) (0.0363) (0.0332) help 0.0964 -0.0376 0.00383 -1.070*** -0.802*** -0.101 -0.0182 (0.0629) (0.0640) (0.0762) (0.0710) (0.0633) (0.0709) (0.0664) Constant 0.275** -0.503*** 0.577*** 1.286*** 0.692*** 0.907*** 0.199* (0.115) (0.117) (0.133) (0.147) (0.121) (0.131) (0.119) Observations 3,557 3,557 3,557 3,557 3,557 3,557 3,557
References
Anxo, D., Flood, D. and Y. Kocoglu (2002). “Offre de travail et répartition des activités domestiques et parentales au sein du couple: une comparaison entre la France et la Suède”,
Economie et Statistique, 352-35: 127–150.
Aronsson, T., Daunfeldt, S.-O., and M. Wikström (2001). “Estimating intrahousehold allocation in a collective model with household production”, Journal of Population
Economics, 14(4): 569-584.
Bauer, T. K., and M. Sinning (2008). “An extension of the Blinder–Oaxaca decomposition to nonlinear models. Advances in Statistical Analysis 92: 197–206.
Becker, G. S. (1981). A Treatise on the Family, Harvard University Press
Bittman, M., P. England, L. Sayer, N. Folbre and G. Matheson (2003), “When does gender trump money ? Bargaining and time in household work”, American Journal of Sociology, 109: 186-214.
Blinder, A. S. (1973). “Wage discimination: Reduced form and structural estimates”. Journal
of Human Resources 8: 436–455.
Brines J. (1994). “Economic Dependency, Gender, and the Division of Labor at Home”,
American Journal of Sociology, Vol. 100, No. 3 (Nov., 1994), pp. 652-688.
Champagne C., A. Pailhé and A. Solaz (2015). “House-keeping and parenting time of men and women: what factors have driven change over the past 25 years?”, Economie & Statistique, N°478-479-480.
Couprie H., E. Cudeville and C. Sofer (2015), “Efficiency versus Stereotypes: An Experiment in Domestic Production”, CES Working Paper 2015.25, University of Paris 1.
Chan, R. W., Brooks, R. C., Raboy, B., & Patterson, C. J. (1998). Division of Labor Among Lesbian and Heterosexual Parents: Associations With Children's Adjustment. Journal of
Family Psychology, 12(3), 402-419.
Conelly R. and J. Kimmel (2009). “Spousal influences on parents' non-market time choices”, Review of Economics of the Household.
Cudeville E. and M. Recoules (2015), “Household Behavior and Social Norms: A Conjugal Contract Model”, Annals of Economics and Statistics, N°117 / 118.
Giddings, L., J. Nunley, A. Schneebaum and J. Zietz (2014). “Birth Cohort and the Specialization Gap Between Same-Sex and Different-Sex Couples”. Demography, 51(2), 509-534.
Goldberg, A. E. (2013). “Doing” and “undoing” gender: The meaning and division of housework in same-sex couples. Journal of Family Theory and Review, 5, 85–104.
Goldberg, A. E., J. Z. Smith and M. Perry-Jenkins (2012). “The division of labor in lesbian, gay, and heterosexual new adoptive parents ». Journal of Marriage and Family, 74, 812– 828.
Goldschmidt-Clermont, L. and E. Pagnossin-Aligisakis (1995), “Measures of unrecorded economic activities in fourteen countries” UNDP, Background Papers for the Human
Development Report, New York: Oxford University Press: 105-155.
Gross, M., et J. Courduriès. (2014). « Logiques conjugales et liens de parenté dans les familles homoparentales », Cahiers critiques de thérapie familiale et de pratiques de réseaux, vol. 52, no 1, p. 71-89.
Gronau, R. (1977). “Leisure, Home Production, and Work--the Theory of the Allocation of Time Revisited”, Journal of Political Economy, Volume 85, Number 6.
Hersch, J. and L.S. Stratton (1994). “Housework, Wages, and the Division of Housework Time for Employed Spouses”, American Economic Review, vol. 84(2): 120-25.
Jaspers E. and E. Verbakel (2013). “The division of paid labor in same-sex couples in the Netherlands”, Sex Roles 68, 335–348.
Kalenkoski, C.M., Ribar, D.C. and L. Stratton (2009). “The Influence of Wages on Parents’ Allocations of Time to Child Care and Market Work in the United Kingdom”, Journal of
Population Economics, 22 (2), 399-419.
Kelly M, E. Hauck (2015). “Doing Housework, Redoing Gender: Queer Couples Negotiate the Household Division of Labor”. Journal of GLBT Family Studies. 11(5):438–64. Lert F. and P. Plauzolles (2003). “Apports des enquêtes quantitatives dans la connaissance des
comportements sexuels et préventifs chez les homosexuels et bisexuels masculins”.
L’homosexualité au temps du sida. Paris, ANRS, p. 55-69.
Lhomond B. (1997). Le sens de la mesure. Le nombre d’homosexuels/les dans les enquêtes sur les comportements sexuels et le statut du groupe minoritaire. Sociologie et sociétés, volXXIX, n°1, p 61-69.
Oaxaca, R. (1973). “Male–female wage differentials in urban labor markets”. International
Economic Review 14: 693–709.
Patterson, C. J. (1995). “Families of the lesbian baby boom: Parents’ division of labor and children’s adjustment”. Development Psychology, 31,115–123.