HAL Id: cea-02389398
https://hal-cea.archives-ouvertes.fr/cea-02389398
Submitted on 2 Dec 2019
HAL is a multi-disciplinary open access
archive for the deposit and dissemination of
sci-entific research documents, whether they are
pub-lished or not. The documents may come from
teaching and research institutions in France or
abroad, or from public or private research centers.
L’archive ouverte pluridisciplinaire HAL, est
destinée au dépôt et à la diffusion de documents
scientifiques de niveau recherche, publiés ou non,
émanant des établissements d’enseignement et de
recherche français ou étrangers, des laboratoires
publics ou privés.
Graphite monochromator for actinide L-line energy
dispersive X-ray fluorescence analysis in liquid sample
E. Esbelin
To cite this version:
E. Esbelin. Graphite monochromator for actinide L-line energy dispersive X-ray fluorescence analysis
in liquid sample. X-Ray Spectrometry, Wiley, 2014, 43 (4), pp.198-208. �10.1002/xrs.2540�.
�cea-02389398�
Graphite monochromator for actinide L-line energy dispersive X-ray fluorescence analysis in liquid sample
E. Esbelin
CEA, Nuclear Energy Division, RadioChemestry & Processes Department, Service d’Etudes du recyclage des combustibles et d’Analyses - LAMM
F-30207 Bagnols sur Cèze, France 1. Introduction
The analysis laboratory in the CEA Atalante complex at Marcoule performs analyses for numerous R&D studies carried out in glove-boxes (intermediate activity) or in hot cells (high activity). The samples are measured in the liquid phase, either aqueous (mainly concentrated nitric acid media) or organic (TBP 30%/TPH 60% v/v for example). For radioactive samples derived from high-level tests, which can have very high radioactive dose rates, analyses are preferably carried out in shielded cells. The concentration of the main actinides of interest (U, Np, Pu, Am and Cm) are determined by XRF (X-Ray Fluorescence) in a hot cell using a device built specifically for these actinides analyses via their L line X-ray between 13 and 15 keV. In order to limit the counting rate of many radioactive emitters (X-ray and gamma emitters) in the analysis solution and the continuous spectrum, a graphite
monochromator is placed between the sample and detector.
Commercial or freesoftware packages available for processing X-ray spectra are usually designed and dedicated to a specific instrument and/or do not take into account the specific feature of our system: the presence of a monochromator. Mathematical modeling of the spectrum takes into account the relative X-ray emission rates of elements, but in the presence of the monochromator, these ratios are changed in appearance. The difficulty of correctly describing our system led us to develop new X-ray analysis software for this particular system.
Until now in our laboratory, X-ray fluorescence analysis was restricted to samples with the same matrix used for the calibration. Dilution of samples for analysis is commonly used to conform to a known matrix. However, the analyzed media constantly vary depending on the R&D studies in progress, and when the actinide concentrations are low (on the order of 1 mg·L-1) in these samples,
dilution is not a suitable option and it is essential to take the change of matrix into account. Similarly, when one of the elements constituting the sample has a high concentration (>1 g·L-1), absorption
phenomena were not taken into account and only the dilution could allow a relevant analysis. The new algorithm implemented takes these remarks into account.
This article describes the new semi-empirical model in place in the laboratory. This software was developed using Python(x,y), a Scientific-oriented Python Distribution based on Qt and Spyder [1]. It has a user-friendly interface and is relatively simple for daily use and for X-ray spectrum fitting of many samples in different media.
2. Experimental
The X-ray generator and X-ray tube (Rh anode, 3 kW, 75 µm) are marketed by PANalytical. Two X-ray tube configurations are used in the laboratory: 50 kV/30 mA and 30 kV/10 mA. The primary X-ray photon beam is filtered by an Rh target (200 µm) producing an almost monochromatic beam. The detector is a hyper-pure Ge crystal (Eurisys EGX 30-05, active area 30 mm2) cooled with liquid
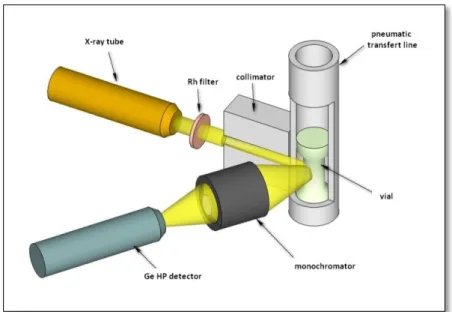
nitrogen. The acquisition electronics were recently replaced by a Canberra DSA-1000 coupled with Genie 2000 software. The sample is transferred pneumatically from a shielded cell to the analytical equipment. The device, located behind the shielded line, is also fully shielded (Pb protection). Figure 1 schematically illustrates the device used for this study. This system was designed in the 1990s.
Figure 1. Simplified diagram of the nuclearized high activity X-ray fluorescence device. The collimator between the vial and the monochromator is not represented.
The samples are packaged in small polypropylene vials 1.5 cm in diameter and 1.5 mm thick. The primary X-ray beam reaches the sample vial laterally after passing through a mylar window not represented on figure. Given these dimensions, the sample is regarded as thick. Moreover, the presence of many attenuators along the X-ray beam limit the actinide quantification threshold to about 0.5 mg·L-1.
The shape of the monochromator is cylindrical. It is made with thin strips of graphite on inner area. In order to avoid direct X-ray, two tungsten discs with smaller diameter are on every end of cylinder on the axial position. This device was custom-made. Thus, the studied energy range is restricted by this monochromator, and the elements of interest (U, Pu, Np) in this range have one L-line with an apparent emission rate exceeding 95%. For example, only the L3O45 lines between 13.6 and 14.3 keV are visible for U and Pu respectively, while their theoretical emission rates are 44% and 45% respectively. For an X-ray beam at 50 kV and 30 mA, their respective L3O1 lines at 17.2 and 18.3 keV, with theoretical emission rates of 23% and 21% are visible only at concentrations greater than 5 g·L-1 and represent less than 5% of the apparent total emission. For an X-ray beam at
30 kV/10 mA and up to 10 g·L-1 in U or Pu, no secondary line is visible; for a 20 g·L-1 Pu concentration,
the secondary lines represent less than 0.2‰ of the maximum intensity of the main line.
Analysis of high atomic number elements in a limited energy range through a monochromator makes our system very specific: the “apparent” element spectrum contains only a single main line. Experience has shown that the secondary fluorescence phenomena are negligible, and they are therefore disregarded in the remainder of this article.
The name of this device “L-line ED-XRF” is based on its specificity: the use of a monochromator in order to focus on energetic range corresponding to L-line X-ray of actinides.
3. Data Processing
Most available free or commercial software for XRF data processing are dedicated to a specific device and/or are based on the use of relative X-ray emission rates of elements. In our case, these ratios are changed in appearance by the presence of a monochromator. Then homemade processing software has been developed [2].
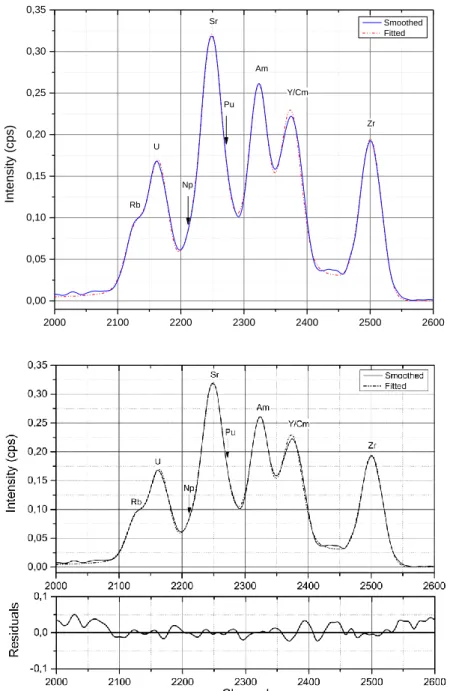
The basic principle is to deconvolute spectrum as a linear combination of elementary spectra (see Figure 2). The resulting fit is very close to the experimental curve. Some fission products such as Rb, Sr, Y, Zr are also analyzed (via their K-lines) in the energetic windows of monochromator.
2000 2100 2200 2300 2400 2500 2600 0,00 0,05 0,10 0,15 0,20 0,25 0,30 0,35 U Zr Y/Cm Am Np Sr Intens ity (cps ) Smoothed Fitted Rb Pu
Figure 2. Spectrum of a sample taken in a test of liquid-liquid extraction on nuclear fuel dissolution solution.
For that, a library of standard samples has been needed. This library is not a simple storage of standard spectra fingerprint. For each standard element, calibration is realized for every channel (multichannel analyzer) linking intensity and concentration by a nonlinear function (because of auto-attenuation effect for the highest concentration). Thus the calibration file is a huge array with all parameters of calibration function for every channel and every standard.
A new approach has been proposed for matrix correction effects. Similar to that of Lachance-Traill established for solid sample, this approach is dedicated to liquid sample. This correction requires a good description of the analyzed sample matrix and the use of data from the XCOM mass attenuation coefficients database [3]. Another benefit of this correction establishment is the possibility to use calibration file with another sample matrix that one of standard sample. For example, an organic sample can be analyzed with a good estimation providing that the matrix can be accurately described. This is particularly useful for our R&D studies because a rapid estimation of results can be obtained without a long time calibration process.
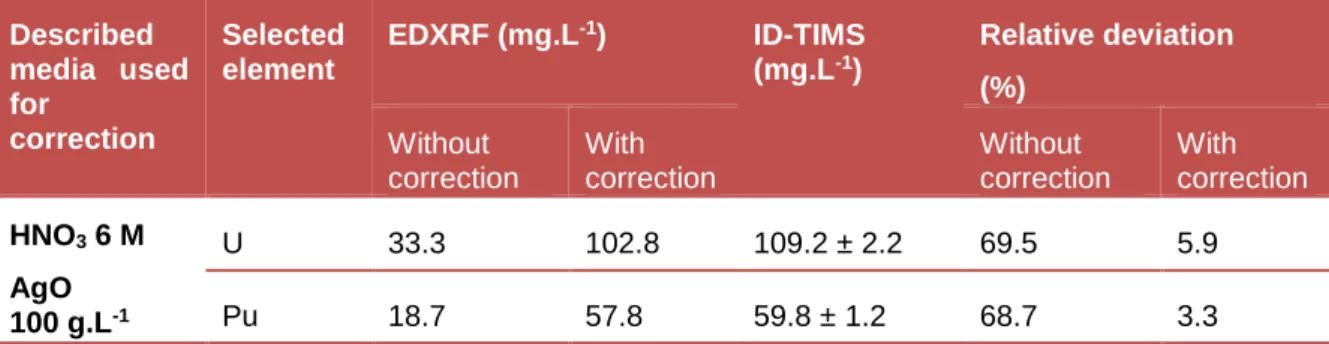
An example is given in Table 1: a dissolution test of spent fuel residues in presence of a high amount of AgO (~100 g/L) in HNO3 6 M media was realized. Calibration was done in HNO3 3 M media. Matrix
effects correction take into account the presence of AgO and the difference in acid concentration.
Table 1. Validation of proposed method. Described media used for correction Selected element EDXRF (mg.L-1) ID-TIMS (mg.L-1) Relative deviation (%) Without correction With correction Without correction With correction HNO3 6 M AgO 100 g.L-1 U 33.3 102.8 109.2 ± 2.2 69.5 5.9 Pu 18.7 57.8 59.8 ± 1.2 68.7 3.3 Estimated uncertainty
The estimation of the uncertainty is a delicate step. To date, we have studied the dispersion due to the positioning of the vial in the counting station, and the electronics and detector. This dispersion is less than 2 %. Nevertheless, a lot of parameters are involved in the uncertainty such as the calibration parameters, the number of selected element in deconvolution process, etc. The study is still in progress in our laboratory. Right now, an uncertainty of the order of 10 % is retained by feedback. 4. Conclusion
This device is suitable for actinide analysis (U, Np, Pu, Am, Cm) in the range 0.5 mg/L to 20 g/L. Other element, via their K-line, are analyzed in the energetic windows of monochromator such as Br, Rb, Sr, Y, Zr. The data process needs a good knowledge of sample matrix in order to correctly apply the matrix effect correction.
5. References
[1] Python(x,y): a scientific-oriented Python distribution based on Qt and Spyder. Available from :
http://code.google.com/p/pythonxy/
[2] E. ESBELIN
Graphite monochromator for actinide L-line energy dispersive X-ray fluorescence analysis in liquid sample
X-ray Spectrometry,2014, 43, 198-208 [3] M. J. BERGER, J. H. HUBELL
XCOM:photon cross sections on a personal computer