HAL Id: hal-02470674
https://hal.archives-ouvertes.fr/hal-02470674
Submitted on 7 Feb 2020HAL is a multi-disciplinary open access archive for the deposit and dissemination of sci-entific research documents, whether they are pub-lished or not. The documents may come from teaching and research institutions in France or abroad, or from public or private research centers.
L’archive ouverte pluridisciplinaire HAL, est destinée au dépôt et à la diffusion de documents scientifiques de niveau recherche, publiés ou non, émanant des établissements d’enseignement et de recherche français ou étrangers, des laboratoires publics ou privés.
Characterization of SiC ceramics with complex porosity
by capillary infiltration: Part B – Filling by molten
silicon at 1500 °C
Jérôme Roger, M. Avenel, L. Lapuyade
To cite this version:
Jérôme Roger, M. Avenel, L. Lapuyade. Characterization of SiC ceramics with complex porosity by capillary infiltration: Part B – Filling by molten silicon at 1500 °C. Journal of the European Ceramic Society, Elsevier, 2020, 40 (5), pp.1869-1876. �10.1016/j.jeurceramsoc.2019.12.050�. �hal-02470674�
1
Characterization of SiC ceramics with complex porosity by capillary infiltration: Part B – Filling by molten silicon at 1500°C
J. Roger a,*, M. Avenel a, L. Lapuyade a
a Université de Bordeaux, CNRS, Laboratoire des Composites ThermoStructuraux, UMR
5801, 33600 Pessac, France
* Corresponding author: e-mail: jerome.roger@lcts.u-bordeaux.fr
Abstract
In Part A of this study, infiltrations experiments of porous SiC samples by hexadecane with pore-size distributions comprising small and large pores were realized. Two successive stages were identified during the filling of these samples corresponding to the infiltration of the two types of pores. The experimental data were successfully treated with a new analytical function. In Part B, it was found that this function can also be applied to the analysis of the mass gain during molten silicon infiltration at 1500°C. Prior to silicon infiltration, it was found that the operating temperature induces a shift of the pore size distributions towards larger values. A dissolution-recrystallisation mechanism can also occur during the infiltration of silicon. During the first stage, liquid silicon fills rapidly larger pores than hexadecane. The kinetics are significantly larger with liquid silicon. Consequently, the durations for the complete filling are very short with molten silicon.
Keywords: SiC; Molten silicon; Microstructure evolution; Infiltration kinetic; Washburn equation
2 1. Introduction
One of the main challenges for the modern industry is the availability of new materials for the development of parts and components potentially exposed to extremely hostile environmental conditions [1-3]. Infiltration of molten metal into ceramic performs without external pressure is an efficient process in the fabrication of composites with a high ceramic content [4]. The possibility of including a high volume of ceramic filler in a metal matrix allows a greater maneuvering margin for adjusting the thermal stability and thermophysical characteristics of the composites. This way was applied at relatively low temperatures with aluminum and copper [5-9]. Recently, special interest has been focused on SiC ceramic-reinforced metal-matrix composites. Indeed, SiC is important in a broad range of technological applications because it is an excellent structural ceramic material with low density, high strength, high thermal expansion, and chemical stability. SiC ceramics are widely used in machinery manufacturing, aerospace, chemical equipment, electronic devices and many fields [10-12]. SiC is a promising material for ceramic-matrix composites for the hot parts of the structures in engines [1,2]. It was demonstrated that high SiC volume fraction composites can be produced by infiltrating liquid Cu and pure Al into packed SiC powder. But the poor wettability for these metals on sintered SiC and severe interfacial reaction between the liquid and SiC grains are the main remaining problems [5,6]. Good wettability of the molten metal on the reinforcement is required preferably without any reactivity. This technic is also applicable to the infiltration of metals with a high melting point as nickel and titanium or silicon [13-15]. Liquid silicon infiltration process is developed to improve the mechanical properties of SiC composites and to realize near-net formed ceramic components [16,17]. This way commonly called LSI (Liquid Silicon Infiltration) implies a production temperature higher than the melting point of Si (1414°C). In a previous study, we examined the infiltration kinetic of molten silicon at 1500°C in porous and homogeneous SiC preforms [15]. But the infiltration mechanisms and kinetics of liquid silicon in heterogeneous SiC materials remain largely unknown, especially since chemical processes may occur at such an elevated temperature. Consequently, the aim of the present study is to investigate the kinetics of pressureless infiltration of molten silicon into several SiC materials with or without cracks and/or wide porosities. The infiltration progression was monitored in-situ by the measurement of the
3
weight gain versus time. The effects of the heating on the pore size of the samples have been studied as they can affect the liquid infiltration. The influence of the heating on the pore size distribution without silicon infiltration was estimated from mercury porosimetry. In Part A of the present study, the effects of cracks and large pores were examined by capillary infiltration of hexadecane at room temperature and an analytical model has been proposed for describing the capillary infiltration. In this part, kinetic studies for silicon infiltration are being reported. The infiltration curves were mathematically analyzed and compared to the corresponding results obtained from hexadecane capillary infiltrations at room temperature.
2. Background on the capillary infiltration of silicon into porous SiC
A preliminary thermodynamic analysis of the equilibrium in the Si-C system was performed with the help of the ThermoCalc software [18]. The calculated phase diagram is shown in Figure 1-a) from the relevant thermodynamic descriptions of this binary system reported by Grobner et al. [19]. The particularity of the Si-C system is the formation of only one binary compound SiC which incongruently decomposes. At the working temperature of 1500°C, silicon is in the liquid state and in equilibrium with SiC. According to literature data, the maximum value of carbon solubility into liquid silicon at 1500°C is close to 170 ppm in mass as shown in Figure 1-b) [18-23]. From this very low value, the interaction between pure molten silicon and SiC can be considered a priori as negligible. The background on the capillary infiltration into porous SiC was detailed in Part A of this study. In summary, the infiltration of a wetting liquid in porous and homogeneous SiC material with micronic grains is expected to follow the Washburn equation. We demonstrated in a recent work that this equation is suitable to model the capillary infiltration of molten silicon in porous SiC compacts [15].
3. Experimental
3.1 Starting materials
Experimental details pertaining to fabrication and characterization of SiC samples are already presented in Part A. In this part, details pertaining to liquid silicon infiltration are given. Silicon of commercial purity (99.9999%, Strem Chemicals, Inc., Germany) was used in the experiments.
4
The melt silicon infiltration experiments were carried out in high vacuum (5×10⁻³ mbar) at
1500°C. In Table 1 we give the upper and lower values of the contact angle on SiC, the dynamic viscosity, the density and the surface tension of silicon, for the density and the dynamic viscosity of molten silicon at 1500°C [15]. The samples infiltrated by molten silicon are mentioned in Table 2 with their characteristics.
3.2 Heat treatment and pressureless infiltration of liquid silicon
The setup of the silicon infiltration experiments is schematically represented in Figure 2-a). The heat treatments with or without silicon capillary infiltration experiments were performed at 1500°C in this equipment which is an inductively-heated furnace fitted with a graphite susceptor. The natural infiltration processing was carried out in at a vacuum better than 5×10⁻³ mbar and the
temperature was regulated with a bichromatic pyrometer (Modeline 5, Ircon, USA). The temperature was increased to 1500°C at a heating rate of 20°C.min-1, kept constant for 15 minutes
to melt the silicon and to stabilize its temperature. Then, either the temperature is directly decreased at a rate of 30°C.min-1 or molten silicon is put in touch with the compact for a maximal
duration of 160 seconds. The ensuing cooling is performed in the same manner as indicated above. The typical shape of silicon-infiltration curves is shown in Figure 2-b). for each test, the graphite crucible, coated with a protective boron nitride (BN) layer, contained 8g of silicon chips. This crucible was raised through an automatic jack controlled by a step motor system to keep the contact between the compact and the liquid. The SiC compacts were drilled to be held with a graphite hanger and a SCS-6TM fiber. This assembling is suspended to an analytical balance with
a resolution of 0.3µg (ANR DS1070, Setaram Instrumentation, France) to numerically record the weight variation versus time every second. Figure 2-c) shows a silicon-infiltrated compact covered with a BN layer applied by spraying (HeBoCoat 21E, Henze Boron Nitride Products AG, Germany). A BN layer limits the rise of the liquid along the faces. It was verified that the BN powder remains on-surface and does not penetrate into the compact.
5
Identically to the Part A, six kinds of samples were also considered and characterized in this part. The characteristics of the samples infiltrated by molten silicon are summarized in Table 2. In a previous work, we identified a slight shift of the pore-size distributions towards larger pore sizes during the heating prior to LSI [15]. That is why samples of each type were heated according to the heating cycle but without infiltration of silicon. Then, the pore-size distributions were characterized by mercury intrusion porosimetry. The pore size distributions without and with heating are shown in Figure 3 for SiC reference compacts, SiC Galtenco compacts and SiC foams. The evolutions of the others compacts are very weak and equivalent to the reference compacts, so they are not reported. The weight gain curves obtained from silicon infiltration experiments are shown in Figure 4. The microstructures of the samples infiltrated with silicon were performed with a FEI Quanta 400FEG scanning electron microscopy (SEM) operated at 5 kV. The silicon-infiltrated compacts were cut and embedded in epoxy resin under vacuum. The cross-section was ground and polished to a 1µm diamond finish. The corresponding backscattered electrons images are shown in Figure 5.
4. Results and discussion
4.1 Effect of the heat treatment at 1500°C
It was previously demonstrated in our recent paper that the increase, the dwell and the decrease of the temperature may have noticeable effects on the pore spectra of the SiC samples [15]. The pore size distributions of Reference SiC, SiC Galtenco and SiC foam before and after a heating at 1500°C for 15 minutes are shown in Figures 3-a) and 3-b), respectively. The evolution of Reference SiC is very weak with an increase of the mean pore size from 0.21µm to 0.24µm, which corresponds to a variation of about 15%. Furthermore, the pore distribution remains narrow. Identical variations were predictably obtained for the three others types of compact (Cracked SiC, SiC+10%vol. balls and SiC+7.5%vol. fibers) prepared from β-SiC powder and are consequently not reported here. Figure 6 shows the effect of the heating on the infiltration kinetic. An increase of 66% is measured for the infiltration kinetic of SiC foam (4). The kinetic increase is of 47% for SiC Galtenco (3) and a lower variation of only +30% is obtained for Reference SiC (2). These variations confirm the effect of the heating on the infiltration kinetics also identified from the
6
evolutions of the pore-size distributions. Concerning the SiC Galtenco and SiC foam samples, strong evolutions of their pore size distributions are observed which are induced by the heating (Figures 3-a) and 3-b)). In both cases, an important shift of the pore size distribution is measured associated to a tightening of the pore-size distribution. The main change is the disappearance of the pores smaller than 0.10µm and 0.05µm of SiC Galtenco and SiC foam samples, respectively. This effect may have a considerable effect on the infiltration kinetic and mechanism as the first pores filled during the infiltration of a liquid are the smallest ones. A presintering process without densification is at the origin of these evolutions since the dimensions of the compacts remain constant.
4.2 Infiltration of molten silicon at 1500°C
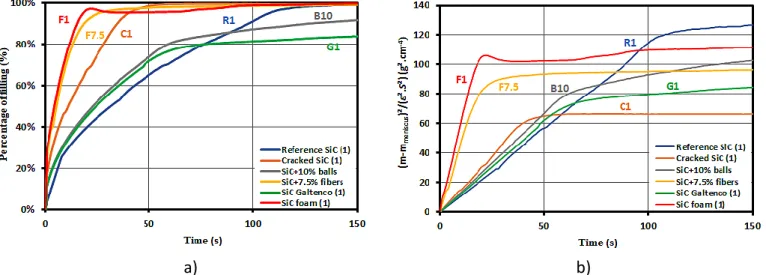
The time dependence of the silicon filling percentage for the six samples are shown in Figures 4-a). The corresponding squared weight gains corrected from the meniscus weight and normalized to the infiltration section and to the porosity are plotted in Figure 4-b). These curves indicate that the kinetics of the weight gains are very elevated compared to the kinetics measured for the filling with hexadecane. On a general manner, all the samples are rapidly filled for durations comprised between 100 to 600 seconds. The lose by evaporation of silicon can be neglected as the saturation vapor pressure of silicon evaporated from a silicided graphite cell at 1500°C is found equal to 9.3210-3 Pa [24]. For all samples, the curves exhibit similar shapes with two successive filling
kinetics as evidenced in Figure 4-b). The first kinetic is elevated for all samples and larger than the reference compact and occurs for various durations depending on the sample. The higher first kinetic is observed for the SiC foam and the compact prepared with fibers. The first kinetics of the others samples are close, the lower value is obtained with the reference sample. The second kinetics are clearly lower and occurs during short durations for R1, C1, F7.5 and F1 samples, and they are longer in time for B10 and G1 samples. The first and second slopes of all the samples seem to vary practically linearly in Figure 4-b) and the transition between the two rates of filling occurs at different durations. As mentioned in Part A, the first linear variations are in agreement with the Washburn equation, but the second linear variations cannot be described by this equation. Obviously, the first rate mainly corresponds to the filling of small pores and the second rate is
7
associated to the filling of the large pores. All the samples were analyzed by SEM to verify the filling state of each sample, the images were taken in representative areas close to the top of each sample. Figure 5 shows that all the samples can be considered as fully filled. It is to note that F1 sample exhibits a complete transformation of its microstructure even at the infiltration front. The observed transformation is a dissolution-recrystallization mechanism with formation of large and mobile SiC crystals. This kind of transformation was recently examined on the β-SiC powder used in the present work [25]. It was found that the driving force of this mechanism is the minimization of the interfacial solid/liquid energy which therefore concerns mainly the smaller particles. The consolidate β-SiC compacts are less sensitive to this evolution compared to the SiC Galtenco and SiC foam as highlighted by the evolutions of the pore-size distributions during the heating at 1500°C (Figure 3).
4.3 Analytical analysis of molten silicon infiltration
As proposed in Part A of this work, the two successive linear variations of the squared weight gain with time during the infiltration of a liquid called 𝑖 are analytically described with two successive kinetics, called 𝑘1𝑖 and 𝑘2𝑖. The kinetic 𝑘1𝑖 relates to the filling of the smaller pores, and
the kinetic 𝑘2𝑖 describes the slower filling of the larger pores. Equation 1 describes the evolution
in time of the weight gain normalized ∆𝑚 to the porous section (𝑆. 𝜀): ∆𝑚2 𝑆2. 𝜀2= ∑ 𝑘1𝑖. (𝑡𝑖− 𝑡𝑖−1). 𝑓(𝑡𝑖) + 𝑘2𝑖. (𝑡𝑖− 𝑡𝑖−1). (1 − 𝑓(𝑡𝑖)) 𝑗 𝑖=1 𝑡0=0 Equation 1 Equation 2 shows the expression of 𝑓(𝑡𝑖) function which varies between 0 and 1:
𝑓(𝑡𝑖) =
1
1 + (𝛼 + 𝛽. 𝑡𝑖+ 𝛾. 𝑡𝑖3). 𝑒𝑥𝑝 (𝑡𝛿 𝑖)
Equation 2 where 𝛼, 𝛽, 𝛾 and 𝛿 are adjustment coefficients. A numerical solver was used to fit the experimental curves with Equation 1. The obtained values of 𝑘1𝑆𝑖 and 𝑘2𝑆𝑖 kinetics and 𝛼, 𝛽, 𝛾 and
𝛿 are detailed is Table 3. The correlation percentages are found appropriate since greater than 99.5%. Figures 7-a,b,c,d,e,f) show the experimental and fitted curves of the mass increase versus
8
time for these six compacts and the corresponding fitted variations of the mixing functions 𝑓(𝑡) and 1 − 𝑓(𝑡). According to the elevated correlation percentages, all the fitted mass gain curves are very close to the experimental curves. Consequently, the 𝑘1𝑆𝑖 and 𝑘2𝑆𝑖 kinetics are significant
and the crossing times of the 𝑓(𝑡) and 1 − 𝑓(𝑡) functions are also in good agreement with the experimental transition times. The comparison of the 𝑘1𝑆𝑖 and 𝑘2𝑆𝑖 kinetics in Figure 8 indicates
that the 𝑘2𝑆𝑖 kinetics are very low compared to the 𝑘1𝑆𝑖 kinetics. Two ranges of value can be
distinguished for 𝑘1𝑆𝑖 kinetics: R1, C1, B10 and G1 samples have relatives close values between
1.12710-4 and 1.47310-4 g2.mm-4.s-1, whereas F7.5 and F1 samples exhibit higher values of
4.36810-4 and 6.10610-4 g2.mm-4.s-1, respectively. These trends are already visible in Figure
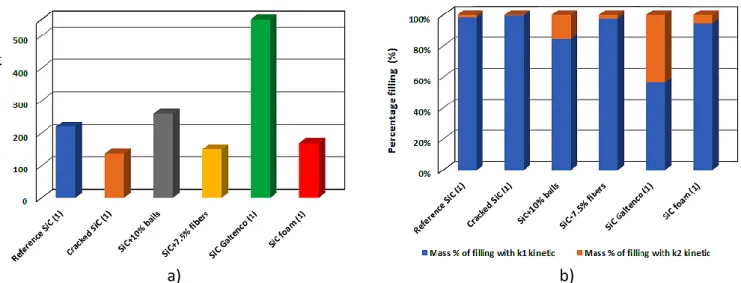
4-b). One can deduce that the interconnected large porosities of the F7.5 and F1 samples are rapidly filled during the first infiltration regime, and that is why the corresponding kinetics are higher. The calculated times for the saturation of each sample are shown in Figure 9-a) and the percentage of filling associated with each kinetic regime are shown in Figure 9-b). The complete filling occurs for short duration between 130 and 260 seconds, except for SiC Galtenco (1) with a duration of saturation close to 550 seconds. This particular behavior can be explained both by low filling kinetics and a low-time transition so that only half of the porosities are rapidly filled. Indeed, the volume filled during the second stage is found elevated for this sample compared to the other samples (Figure 9-b)). Compared to the reference compact, the filling durations of F7.5 and F1 samples are consistently low due to their elevated 𝑘1𝑆𝑖 kinetics. The complete filling of the
B10 sample occurs slightly later because of the largest pores. The filling duration of C1 compact occurs rapidly due to a smaller height dimension of only 36mm. On the basis of the pore-size distributions after heating, the sizes of the largest pores filled during the first stage are estimated to 6; 150; 4, 60; 0.4 and 10µm for R1, C1, B10, F7.5, G1, and F1 samples, respectively. These values are given with the hypothesis that the smaller pores are filled first. From these different values, it can be deduced that liquid silicon can fill rapidly large pores of several microns and the limits reported above reveal the interconnectivity of the pores. Indeed, the elevated infiltration kinetics of F7.5 and F1 are correlated to their very elevated limits (150 and 60µm) of the largest pores filled during the first stage. On the contrary, the elevated filling duration of the G1 sample seems to be correlated to a lower limit of the largest pores filled during the first stage, i.e. 0.4µm.
9
The particular behavior of this sample is probably induced by its sandwich microstructure with a central layer containing the largest pores. An effect of the heating on the microstructure cannot be ruled out. Compared to the experiments with hexadecane of Part A, the infiltration kinetics are extremely higher with molten silicon, that is why the saturation time are very low. Finally, the analytical method presented herein gives important and relevant information. It is thus shown that the effect of a heating must be considered. As previously reported by us [15], this effect is mainly attributed to the coarsening of the SiC grains and to the dissolution-reprecipitation in presence of molten silicon which increases progressively the size of the pore and modify the pore-size distribution, as evidence in Figure 3. The effect of thermal expansion is proportionally limited with a value of only 5.510-6 K-1 at 1500°C [26]. Partial permeabilities can be obtained for each
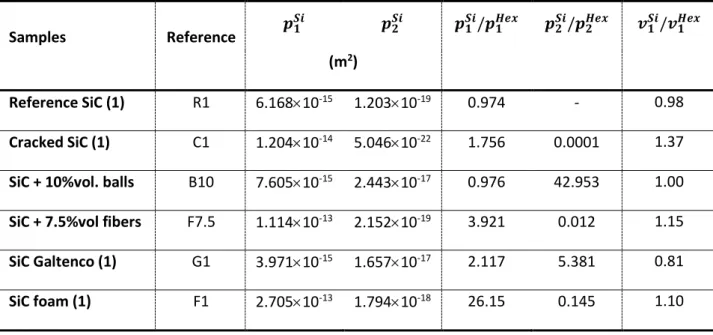
stage from the corresponding filled porosity and the value of the kinetic coefficient 𝐾𝑆𝑖 for molten silicon in SiC materials at 1500°C determined in a previous article [15]. They are named 𝑝1𝑆𝑖 and
𝑝2𝑆𝑖 for, respectively, the first and the second kinetics. These values and their ratios with the
corresponding values with hexadecane are reported in Table 4. It is found that the 𝑝1𝑆𝑖 values of
R1 and B10 are close, whereas the values of C1, F7.5 and F1 are, respectively, twice, eighteen and forty-four times larger than R1. The values of G1 is around half of R1. The ratios of these partial permeabilities with the values from hexadecane show that the permeability of the first stage of R1 and B10 are close, what is in agreement with the fact that the same fraction of the pore is filled with the two liquids, i.e. 𝑣1𝑆𝑖/𝑣1𝐻𝑒𝑥 (Table 4). All the others 𝑝1𝑆𝑖/𝑝1𝐻𝑒𝑥 ratios are
larger. This can be correlated to the fact that the 𝑣1𝑆𝑖/𝑣1𝐻𝑒𝑥 ratios are different from 1. In these last
cases, the direct correlation between the two liquids is clearly no possible. In regard to the 𝑝2𝑆𝑖/𝑝2𝐻𝑒𝑥 ratios, they are found clearly lower for the samples with 𝑣1𝑆𝑖/𝑣1𝐻𝑒𝑥 ratios larger than 1,
i.e. C1, F7.5 and F1. This can be explained by the fact that larger pores are filled by molten silicon during the first stage, then the pores filled by molten silicon during the second stage are larger. For B10 and G1, the 𝑝2𝑆𝑖/𝑝2𝐻𝑒𝑥 ratio is larger than 1, whereas the 𝑣1𝑆𝑖/𝑣1𝐻𝑒𝑥 ratio is equal or less than 1. This is more difficult to justify, especially for B10. The low interconnectivity of the large pores of these two samples is probably at the origin of this variation. Generally, these results confirm that a direct extrapolation of the measurements with one these liquids to the other is only possible in particular cases. The nature of the liquid is of prime importance and extrapolations are
10
directly possible only for porous materials with a monomodal pore size distribution. The situation is more complex for samples with multimodal pore size distribution. This is evidenced in the present case by a very marked gap between the volume fraction of pores, proportional to the mass fraction of liquid, filled during the two successive stages of the filling. This means that the pores filled during the first stage are not exactly the same with hexadecane and silicon, what implies that a direct correlation is not possible. Indeed, temporally and weight normalized curves cannot be superimposable. It would be probably possible to extrapolate the measurements from hexadecane to silicon taking into account the evolution of the porous network under the effect of the temperature, due to coarsening and dissolution-reprecipitation, which are currently not established. Subsequent works should give a more extended comprehension of the factors on the capillary rise of hot liquids.
5. Conclusion
From the findings of both the parts, A and B of this study, the following conclusions may be drawn. First, the infiltration of SiC porous materials with different pore sizes can be described by two successive stages for both hexadecane at 20°C and molten silicon at 1500°C. In both cases, the weight gain kinetics of the first stage vary by respecting the Washburn equation. It corresponds to the filling of the smallest pores. The larger pores shaped as cracks and/or holes are apparently filled with lower kinetics depending on the properties of the liquid. It was proposed and successfully tested a new analytical function to extract the relevant data about the infiltration kinetics and the transition time. Very different kinetics were obtained on the same samples during hexadecane and liquid silicon capillary rises. In a general way, the operating temperature induces a more or less important increase of the pore sizes which promotes silicon infiltration. It appears also that molten silicon can filled larger pores than hexadecane with a much higher speed. Consequently, the calculated filled volumes during the two stages are very different depending on the liquid used. An important finding is that the extrapolation of hexadecane infiltration to liquid silicon experiment is not directly possible because of the irreversible and continuous pore transformation induced by the high temperature. In this aim, a better knowledge of the infiltration mechanisms is essential. The analysis method of infiltration experiments is promising and will be experienced and improved in the future.
11 Acknowledgement
The authors wish to thank Olivier Caty and Muriel Alrivie from the Laboratory of ThermoStructural Composites (LCTS - UMR 5801 - UB-CNRS-CEA-SAFRAN) for their kind assistance. The Galtenco company is thanked for the supply of custom samples. A part of t
his
work has been performed within the frame of the training of Kylia Marcus-Cesaire from
the University of Bordeaux, France.
12 References
[1] K.K. Chawla, Ceramic Matrix Composites, second ed., Kluwer Academic Publishers, Boston, 2003, pp. 417-419.
[2] N.P. Bansal, Hand Book of Ceramic Composites, Kluwer Academic Publishers, Boston, 2005, pp. 117-147
[3] N. Durlu, Titanium carbide-based composites for high temperature applications, J. Eur. Ceram. Soc. 19 (1999) 2415-2419, https://doi.org/10.1016/S0955-2219(99)00101-6 [4] M.K. Aghajanian, M.A. Rocazella, J.T. Burke, S.D. Keck, The fabrication of metal matrix
composites by a pressureless infiltration technique, J. Mater. Sci. 26 (1991) 447-454. https://doi.org/10.1007/BF00576541
[5] J. Liu, Z. Zheng, J. Wang, Y. Wu, W. Tang, J. Lu, Pressureless infiltration of liquid aluminum alloy into SiC preforms, J. Alloys Compd. 465 (2008) 239-243. https://doi.org/10.1016/j.jallcom.2007.10.055
[6] S.B. Ren, X.H. Qu, J. Guo, X.B. He, M.L. Qin, X.Y. Shen, Net-shape forming and properties of high-volume fraction SiCp/Al composites, J. Alloys Compd. 484 (2009) 256-262. https://doi.org/10.1016/j.jallcom.2009.04.074
[7] S. Zhang, M. Zhu, X. Zhao, D. Xiong, H. Wan, S. Bai, X. Wang, A pore-scale, two-phase numerical model for describing the infiltration behaviour of SiCp/Al composites,
Composites: Part A 90 (2016) 71-81. http://dx.doi.org/10.1016/j.compositesa.2016.06.014 [8] K. Zhang, Z. Shi, G. Liu, G. Qiao, SiC/Cu composite prepared by spontaneous infiltration of
copper alloy into porous SiC ceramic, Mater. Sci. For. 814 (2015) 569-573. https://doi.org/10.4028/www.scientific.net/MSF.814.569
[9] L. Zhang, X.H. Qu, X.B. He, B.H. Duan, S.B. Ren, M.L. Qin, Thermo-physical and mechanical properties of high-volume fraction SiCp/Cu composites prepared by pressureless
infiltration, Mater. Sci. Eng. A 489 (2008) 285e293, https://doi.org/10.1016/j.msea.2007.12.028
[10] M. Steen, L. Ranzani, Potential of SiC as a heat exchanger material in combined cycle plant, Ceram. Int. 26 (2000) 849-854. https://doi.org/10.1016/S0272-8842(00)00027-4
13
[11] W. Zhuo, F. Niu, Y. Zhao, J. Liu, Hermeticity and tensile experiment of small platetype SiC ceramic composites for advanced reactor applications, Ann. Nucl. Energy 110 (2017) 1098-1106. https://doi.org/10.1016/j.anucene.2017.08.036
[12] Z.B. Yu, V.D. Krstic, Fabrication and characterization of laminated SiC ceramics with self-sealed ring structure, J. Mater. Sci. 38 (2003) 4735-4738. https://doi.org/10.1023/A:1027423001928
[13] C.L. Cramer, A.D. Preston, A.M. Elliott, R.A. Lowden, Highly dense, inexpensive composites via melt infiltration of Ni into WC/Fe preforms, Int. J. Refract. Metals Hard Mater. 82 (2019) 255-258. https://doi.org/10.1016/j.ijrmhm.2019.04.019
[14] C.A. Leon-Patino, R.A.L. Drew, Role of metal interlayers in the infiltration of metal-ceramic composites, Curr. Opin. Solid State Mater. Sci. 9 (2005) 211e218, https://doi.org/10.1016/j.cossms.2006.04.006
[15] J. Roger, L. Guesnet, A. Marchais, Y. Le Petitcorps, SiC/Si composites elaboration by capillary infiltration of molten silicon, J. Alloys Compd. 747 (2018) 484-494. https://doi.org/10.1016/j.jallcom.2018.03.024
[16] L. Hozer, J.R. Lee, Y.M. Chiang, Reaction-infiltrated, net-shape SiC composites, Mater. Sci. Eng. A-Struct. Mater. Prop. Microstruct. Proc. 195 (1995) 131-143. https://doi.org/10.1016/0921-5093(94)06512-8
[17] S. Aroati, M. Cafri, H. Dilman, M.P. Dariel, N. Frage, Preparation of reaction bonded silicon carbide (RBSC) using boron carbide as an alternative source of carbon, J. Eur. Ceram. Soc. 31 (2011) 841-845. https://doi.org/10.1016/j.jeurceramsoc.2010.11.032
[18] J. Andersson, T. Helander, L. Höglund, P. Shi, B. Sundman, Thermo-Calc & DICTRA, computational tools for materials science, Calphad 26 (2002) 273-312. https://doi.org/10.1016/S0364-5916(02)00037-8
[19] J. Grobner, H.L. Lukas, F. Aldinger, Thermodynamic calculation of the ternary system Al-Si-C, Calphad 20 (1996) 247-254. https://doi.org/10.1016/S0364-5916(96)00027-2
[20] K. Yanaba, M. Akasaka, M. Takeuchi, M. Watanabe, T. Narushima, Y. Igushi, Solubility of carbon in liquid silicon equilibrated with silicon carbide, Mater. Trans. 38 (1997) 990-994. https://doi.org/10.2320/matertrans1989.38.990
14
[21] R.N. Hall, Electrical contacts to silicon carbide, J. Appl. Phys. 29 (1958) 914-917. https://doi.org/10.1063/1.1723329
[22] R.I. Scace, G. A. Slack, Solubility of carbon in silicon and germanium, J. Chem. Phys. 30 (1959) 1551-1555. https://doi.org/10.1063/1.1730236
[23] H. Dalaker, M. Tangstad, Time and temperature dependence of the solubility of carbon in liquid silicon equilibrated with silicon carbide and its dependence on boron levels, Mater. Trans. 50 (2009) 1152-1156. https://doi.org/10.2320/matertrans.M2009034
[24] S.I. Lopatin, V.L. Stolyarova, V.G. Sevast’yanov, P. Ya. Nosatenko, V.V. Gorskii, D.V. Sevast’yanov, N.T. Kuznetsov, Russ. J. Inorg. Chem. 57 (2012) 219-225. https://doi-org/10.1134/S0036023612020167s
[25] J. Roger, Y. Le Petitcorps, Microstructural evolution of SiC powder in molten silicon, Ceram. Inter. 44 (2018) 19836-19845. https://doi.org/10.1016/j.ceramint.2018.07.243
[26] R.G. Munro, Material Properties of a Sintered alpha-SiC, J. Phys. Chem. Ref. Data, 26 (1997) 1195-1203. https://doi.org/10.1063/1.556000
15
a)
b)
Figure 1. Si-C system: a) calculated Si-C diagram [18,19] and b) solubility of carbon in molten silicon
from literature [19-23]. The values from Grobner et al. were calculated by using ThermoCalc
software [18].
a)
b)
c)
Figure 2: Capillary rise tests in SiC compacts with molten silicon at 1500°C: a)
schematics of the experimental set-up, b) Typical time dependence of capillary
infiltration into consolidated compacts, and c) sample picture is a sample after
silicon infiltration.
a)
b)
Figure 3: Pore-size distribution for reference SiC, SiC Galtenco and SiC foam: a) before the heating at
1500°C; and b) after the heating at 1500°C during 15min.
16
a)
b)
Figure 4: Time dependence of the weight gain during silicon capillary rise in one compact of each family:
a) percentage of filling curves and b) squared weight gain curves normalized to the section, saturation
17
a)
b)
c)
d)
e)
f)
Figure 5: Backscattered electrons images of the samples after molten silicon
infiltration: a) reference SiC (1); b) cracked SiC (1); c) SiC+10%vol. balls; d)
SiC+7.5%vol. fibers; e) SiC Galtenco (1), f) SiC foam (1). SiC grains are dark grey and
18
a)
b)
c)
Figure 6: Time dependence of the squared weight gain curves normalized to the section during hexadecane
capillary rise before and after heating at 1500°C for 15min: a) reference SiC (2), b) SiC Galtenco (3), and c) SiC
19
a)
b)
c)
d)
e)
f)
Figure 7: Experimental and fitted time dependence of the weight gain during silicon capillary rise and
fitted values of
𝑓(𝑡) and 1 − 𝑓(𝑡):a) reference SiC (R1), b) cracked SiC (C1), c) SiC + balls (B10), d) SiC +
20
Figure 8: Graphic comparison of the
𝑘1𝑆𝑖and
𝑘2𝑆𝑖kinetics for the six samples infiltrated with molten silicon.
a)
b)
Figure 9: Extrapolations for the six samples infiltrated with molten silicon: a) estimated saturation times
and b) estimated ratio of the filled volumes with
𝑘1𝑆𝑖and
𝑘2𝑆𝑖kinetics.
21
Table 1: Physical properties of liquid silicon at 1500°C [17]
Physical properties Liquid silicon (1500°C)
Contact angle on β-SiC (°) 38
Dynamic viscosity μ (g.cm-1.s-1) 5.1×10⁻³ 7.4×10⁻³
Density ρ (g.cm-3) 2.565 2.490
Surface tension σ (g.s-2) 860.9 715.7
Table 2: Porosity, dimensions and filling kinetics of the six samples infiltrated by molten silicon
Table 3: Filling kinetics of the six samples by liquid silicon
Samples Reference Dimensions
(mm)
Porosity ε (%) (±1)
Reference SiC (1) R1 5065 47
Cracked SiC (1) C1 361110 53
SiC + 10%vol. balls B10 4775 59
SiC + 7.5%vol fibers F7.5 4655 57
SiC Galtenco (1) G1 5055 45 SiC foam (1) F1 4585 73 Samples 𝒌𝟏𝑺𝒊 𝒌𝟐𝑺𝒊 𝛂 𝛃 𝛄 𝛅 Correlation percentages (%) (g2.mm-4.s-1) Reference SiC (1) 1.12710-4 3.83210-6 -2.444105 -2.36310-3 2.543101 1.931103 99.979 Cracked SiC (1) 1.47310-4 5.00910-7 -4.768103 -9.56410-3 7.361100 5.977102 99.609
SiC + 10%vol. balls 1.32210-4 1.74910-5 -1.142102 2.00210-1 4.95310-2 6.216102 99.969
SiC + 7.5%vol fibers 4.36810-4 3.76910-6 5.989102 4.68710-3 1.21410-1 1.578102 99.923
SiC Galtenco (1) 1.22010-4 8.96410-6 -3.416104 -3.955100 3.84810-1 6.853102 99.990
22
![Figure 1. Si-C system: a) calculated Si-C diagram [18,19] and b) solubility of carbon in molten silicon from literature [19-23]](https://thumb-eu.123doks.com/thumbv2/123doknet/13050813.383050/16.892.131.816.36.275/figure-calculated-diagram-solubility-carbon-molten-silicon-literature.webp)