HAL Id: hal-00532173
https://hal.archives-ouvertes.fr/hal-00532173
Submitted on 4 Nov 2010
HAL is a multi-disciplinary open access
archive for the deposit and dissemination of sci-entific research documents, whether they are pub-lished or not. The documents may come from teaching and research institutions in France or abroad, or from public or private research centers.
L’archive ouverte pluridisciplinaire HAL, est destinée au dépôt et à la diffusion de documents scientifiques de niveau recherche, publiés ou non, émanant des établissements d’enseignement et de recherche français ou étrangers, des laboratoires publics ou privés.
by energy dispersive spectroscopy and low-temperature
magnetic remanence and hysteresis measurements
Melanie Dillon, Christine Franke
To cite this version:
Melanie Dillon, Christine Franke. Diagenetic alteration of natural Fe-Ti oxides identified by energy dis-persive spectroscopy and low-temperature magnetic remanence and hysteresis measurements. Physics of the Earth and Planetary Interiors, Elsevier, 2008, 172 (3-4), pp.141. �10.1016/j.pepi.2008.08.003�. �hal-00532173�
Title: Diagenetic alteration of natural Fe-Ti oxides identified by energy dispersive spectroscopy and low-temperature magnetic remanence and hysteresis measurements Authors: Melanie Dillon, Christine Franke
PII: S0031-9201(08)00224-0
DOI: doi:10.1016/j.pepi.2008.08.003
Reference: PEPI 5043
To appear in: Physics of the Earth and Planetary Interiors Received date: 20-12-2007
Revised date: 24-7-2008
Accepted date: 6-8-2008
Please cite this article as: Dillon, M., Franke, C., Diagenetic alteration of natural Fe-Ti oxides identified by energy dispersive spectroscopy and low-temperature magnetic remanence and hysteresis measurements, Physics of the Earth and Planetary Interiors (2007), doi:10.1016/j.pepi.2008.08.003
This is a PDF file of an unedited manuscript that has been accepted for publication. As a service to our customers we are providing this early version of the manuscript. The manuscript will undergo copyediting, typesetting, and review of the resulting proof before it is published in its final form. Please note that during the production process errors may be discovered which could affect the content, and all legal disclaimers that apply to the journal pertain.
Accepted Manuscript
1Diagenetic alteration of natural Fe-Ti oxides identified by energy dispersive
1
spectroscopy and low-temperature magnetic remanence and hysteresis measurements
2
Melanie Dillon* 1 and Christine Franke1,2 3
1
Department of Geosciences, University of Bremen, P.O. Box 330 440, 28334 Bremen, 4
Germany 5
2
Laboratoire des Sciences du Climat et de l´Environnement,CEA-CNRS-UVSQ, Campus du 6
CNRS, Bat. 12, Avenue de la Terrasse, 91190 Gif-sur-Yvette Cedex, France 7
* corresponding author: e-mail: mdillon@uni-bremen.de; fax: +49-421-218-7008 8
9
Abstract
10
Low-temperature (LT) magnetic remanence and hysteresis measurements, in the range 300 to 11
5 K, were combined with energy dispersive spectroscopy (EDS) in order to characterize the 12
magnetic inventory of strongly diagenetically altered sediments originating from the Niger 13
deep-sea fan. We demonstrate the possibility of distinguishing between different 14
compositions of members of the magnetite-ulvöspinel and ilmenite-hematite solid solution 15
series on a set of five representative samples, two from the upper suboxic and three from the 16
lower sulfidic anoxic zone. Highly sensitive LT magnetic measurements were performed on 17
magnetic extracts resulting in large differences in the magnetic behaviour between samples 18
from the different layers. This emphasizes that both Fe-Ti oxide phases occur in different 19
proportions in the two geochemical environments. 20
Most prominent are variations in the coercivity sensitive parameter coercive field (BC). At
21
room-temperature (RT) hysteresis loops for all extracts are narrow and yield low coercivities 22
(6 - 13 mT). With decreasing temperature the loops become more pronounced and wider. At 23
5 K an approximately 5-fold increase in BC for the suboxic samples contrasts a 20- to 25-fold
Accepted Manuscript
increase for the samples from the anoxic zone. We demonstrate that this distinct increase in 25BC at LT corresponds to the increasing proportion of the Ti-rich hemoilmenite phase, while
26
Fe-rich (titano-)magnetite dominates the magnetic signal at RT. This trend is also seen in the 27
room-temperature saturation isothermal remanent magnetization (RT-SIRM) cycles: suboxic 28
samples show remanence curves dominated by Fe-rich mineral phases while anoxic samples 29
display curves clearly dominated by Ti-rich particles. 30
We show that the EDS intensity ratios of the characteristic Fe Kα and Ti Kα lines of the Fe-31
Ti-oxides may be used to differentiate between members of the magnetite-ulvöspinel and 32
ilmenite-hematite solid solution series. Furthermore it is possible to calculate an approximate 33
composition for each grain if the intensity ratios of natural particles are linked to well known 34
standards. Thus, element spectra with high Fe/Ti intensity ratios were found to be rather 35
typical of titanomagnetite while low Fe/Ti ratios are indicative of hemoilmenite. 36
The EDS analyses confirm the LT magnetic results, Fe-rich magnetic phases dominate in 37
the upper suboxic environment whereas Ti-rich magnetic phases comprise the majority of 38
particles in the lower anoxic domain: The mineral assemblage of the upper suboxic 39
environments is composed of magnetite (~19 %), titanomagnetite (~62 %), hemoilmenite 40
(~17 %) and ~2 % other particles. In the lower anoxic sediments, reductive diagenetic 41
alteration has resulted in more extensive depletion of the (titano-)magnetite phase, resulting in 42
a relative enrichment of the hemoilmenite phase (~66 %). In these strongly anoxic sediments 43
stoichiometric magnetite is barely preserved and only ~5 % titanomagnetite was detected. The 44
remaining ~28 % comprises Ti-rich particles such as pseudobrookite or rutile. 45
46
Keywords: magnetic Fe-Ti oxides, energy dispersive spectroscopy (EDS), marine sediments,
47
scanning electron microscopy (SEM), low-temperature magnetism, early diagenesis 48
Accepted Manuscript
Introduction
49
A detailed rock magnetic study of diagenetically altered sediments from the Niger deep-sea 50
fan (GeoB 4901) was reported recently by Dillon & Bleil (2006). Room-temperature 51
hysteresis, IRM, ARM, high- and low-temperature data were combined to provide a 52
comprehensive interpretation of the magnetic assemblage and its modification by a variety of 53
diagenetic processes. The authors suggested that the vast majority of the magnetic assemblage 54
reaching the core location was composed of eroded volcanic material originating from the 55
Cameroon Volcanic Line. The volcanic assemblage was considered to be of variable 56
composition, containing Ti-poor and Ti-rich titanomagnetites and 57
ilmenohematites / hemoilmenites (Herrero-Bervera et al., 2004, Ubangoh et al., 2005). 58
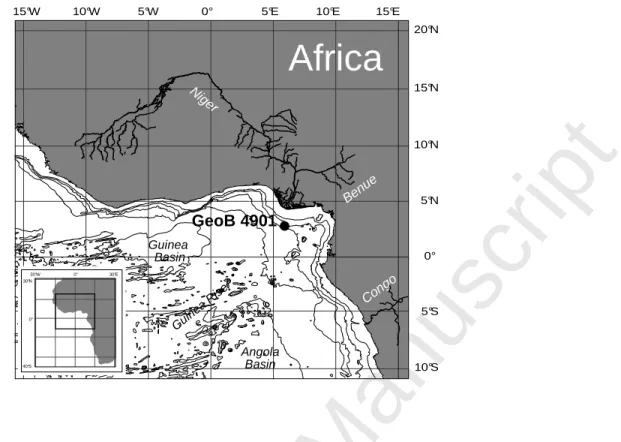
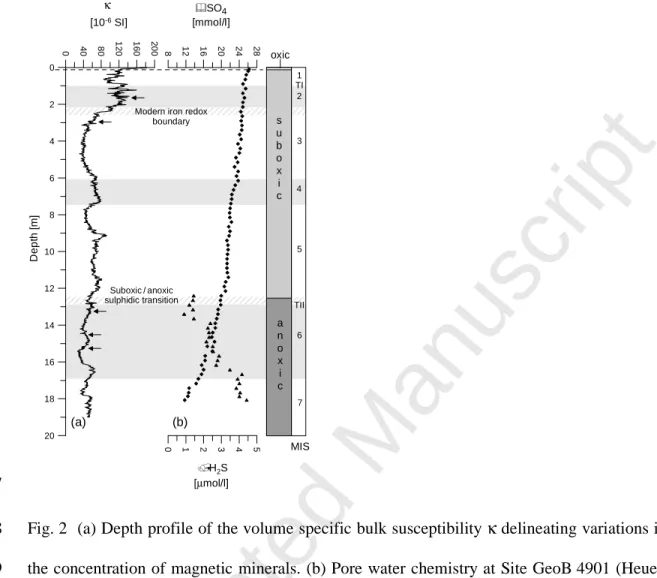
At gravity core location GeoB 4901 (02°40.7’N / 06°43.2’E, 2184 m water depth, Schulz 59
et al., 1998; Fig. 1) the degradation of organic matter results in a specific redox zonation of 60
the sediment column, with only the upper 10 cm being oxic. Suboxic conditions are 61
characterized by dissolved manganese in the pore water and are established down to 12.50 m. 62
Anoxic conditions prevail below this level where anaerobic oxidation of methane results in 63
free H2S in the pore water (Heuer, 2003). In this distinct redox zonation the magnetic iron
64
oxide mineral inventory undergoes a two-stage diagenetic alteration. The modern iron redox 65
boundary (~2.95 m) is characterized by a drastic decline in magnetic mineral content, a 66
coarsening of the grain size spectrum, and a reduction in coercivity at room-temperature. Such 67
reductive diagenesis in the suboxic zone is a common and frequently studied phenomenon in 68
organic rich marine sediments (e.g. Karlin and Levi, 1985; Canfield and Berner, 1987). Below 69
the second diagenetic horizon, the suboxic / sulfidic anoxic transition (~12.50 m), a further 70
but less pronounced decrease in magnetic concentration and grain size occurs. The 71
contribution of finer magnetic particles and the proportion of higher coercive magnetic 72
constituents substantially increase in the anoxic environment (Dillon and Bleil, 2006). 73
Accepted Manuscript
Diagenetic alteration of the primary detrital magnetic mineral inventory was found to be 74dependent on both particle size and Ti-content, with the smallest particles dissolving first and 75
the Ti-rich component being more resistant to the reducing conditions. Possible candidates for 76
the preserved grains are titanomagnetite (Fe3-xTixO4) and hemoilmenite (Fe2-yTiyO3) with
77
compositions of x > 0.75 and y > 0.75, respectively. Both mineral phases with Ti-contents 78
≥ 0.75 are paramagnetic at ambient temperatures and exhibit high magnetic stabilities at low-79
temperature (Bozorth et al., 1957; Schmidbauer and Readman, 1982; Ishikawa et al., 1985). 80
More recent work by Burton et al. (2008) states that this is actually the case for hemoilmenite 81
compositions of y ≥ 0.8. Nevertheless, a definite distinction between the two mineral phases 82
remains unresolved. Titanomagnetites with such compositions are rather uncommon as 83
natural compounds. Therefore it appears more conceivable that Fe-Ti oxides of y > 0.75 84
constitutes hemoilmenite. The role of members of the ilmenite-hematite solid solution series 85
in a magnetic mineral assemblage is often disregarded, although these particles exist in a large 86
range of compositions and are frequent constituents of many types of rocks. However, the 87
presence of (titano-)magnetite usually masks the signature of the magnetic members of the 88
ilmenite-hematite solid solution series when both are present in a sample because the 89
saturation moment of magnetite is at least three times greater than that of e.g. hemoilmenite 90
(y = 0.63) at room temperature (Nord and Lawson, 1989). For the sake of clarity in 91
nomenclature we will use the term ‘hemoilmenite’ for compositions of y ≥ 0.5 and the term 92
‘ilmenohematite’ for mineral phases with y < 0.5. Detailed compositions are expressed using 93
the definitions of Nord and Lawson, (1989), e.g. Ilm80Hem20 for y = 0.8. 94
At room temperature members of the ilmenite-hematite solid solution series are either 95
para-, ferri-, or antiferromagnetic, depending on their individual cation ordering and spin 96
structure (e.g. McEnroe et al., 2000; Burton et al., 2008). Ilmenohematites with compositions 97
of 0 < y < 0.5 are antiferromagnetic at room temperature and their magnetic moments are 98
aligned as in hematite (Warner et al., 1972). Ferrimagnetic ordering in hemoilmenite occurs 99
Accepted Manuscript
for intermediate compositions (0.5 < y < 0.8) and is related to the ordering of Fe and Ti on 100separate sub-lattices (Ishikawa, 1985; Burton et al., 2008). Compositions with y > 0.8 are 101
paramagnetic at room temperature, but magnetic ordering does occur at lower temperatures, 102
e.g. the end-member ilmenite is antiferromagnetic below its Néel temperature of ~58 K (Kato 103
et al., 1982). 104
This study has two aims: first to identify the low-temperature remanence and hysteresis 105
characteristics that will help to discriminate between the members of the magnetite-ulvöspinel 106
and ilmenite-hematite solid solution series. This will expand the low-temperature database 107
and therefore our understanding of natural samples. Secondly, the applied low-temperature 108
magnetic measurements provide an insight into the environmental implications for the gravity 109
core retrieved from the Niger deep-sea fan, by demonstrating the compositional changes of 110
the magnetic mineral assemblage during progressive sub- and anoxic diagenesis. The rock 111
magnetic results are linked to findings of quantitative SEM energy dispersive spectroscopy 112
(EDS) analyses. In particular, the intensity ratios of the characteristic Fe Kα and Ti Kα lines 113
are used to differentiate between the mineral phases of the magnetite-ulvöspinel and ilmenite-114
hematite solid solution series. This combination of magnetic and electron microscopic 115
techniques is helpful in understanding the post-depositional processes in the sedimentary 116
setting of the Niger deep-sea fan and therefore allows us to draw conclusions on the alteration 117
of the primary continental input. 118
119
Materials and methods
120
Sample selection and treatment
121
Magnetic extraction following the method of Petersen et al. (1986) was applied to obtain 122
magnetic concentrates for five representative samples along the depth profile of gravity core 123
GeoB 4901 from (a) the upper suboxic sediments above the Fe-redox boundary (1.65 m), (b) 124
Accepted Manuscript
the upper suboxic sediments below the Fe-redox boundary (2.95 m), and (c) to (e) from the 125anoxic sulfidic sediments (13.25, 14.55 and 15.25 m; see Fig. 2). The enrichment of the 126
magnetic fraction was necessary because the starting concentration is too low for meaningful 127
bulk sediment measurements. Mass determination of the extracts is not practical here, since 128
the typical amount for these magnetic extracts is below the precision of a microbalance 129
(σ = 10-5
g). The sample from 1.65 m depth represents the zone where diagenetic influences 130
are minimal and hence characterizes the primary magnetic mineralogy. The main interest of 131
sampling at 2.95 m was to detect the potential existence of biogenic magnetite, which may 132
form around the modern Fe-redox boundary (Hilgenfeldt, 2000). Samples between 13.25 m 133
and 15.25 m were selected to characterize the magnetic mineral assemblage in the anoxic 134
sediments (Fig. 2). 135
136
Scanning electron microscopy
137
SEM analysis included backscatter electron (BSE) imaging (Lloyd, 1985) performed on the 138
magnetic extracts of selected unconsolidated samples from depths of 1.65, 14.55 and 15.25 m 139
depth, using a FEI XL30 SFEG scanning electron microscope at the EMU (Electron 140
Microscopy Utrecht, The Netherlands). The SEM was operated at an acceleration voltage 141
between 12 and 30 kV, with a ~2 nA beam current and a spot size of ~0.5 µm. Sample 142
preparation for SEM analysis was carried out as described in Franke et al. (2007a). The 143
elemental composition was acquired using energy X-ray dispersive spectroscopy (EDS; 144
Goldstein et al., 1992). The obtained element spectra were (semi-)quantified using the 145
‘Remote SEM Quant Phiroz’ program version 3.4. All element spectra are normalized to the 146
height of their oxygen peak. Background noise was subtracted before calculation of the 147
element composition. The SEM analyses are restricted to the resolvable µm-particle fraction 148
of the extracts and EDS was performed for about 40 to 50 particles per sample. The upper 149
Accepted Manuscript
suboxic environment is represented by the sample from 1.65 m depth. Samples from 14.55 m 150and 15.25 m depth represent the anoxic zone. In the following the SEM results of the two 151
samples from 14.55 m and 15.25 m depth are combined and will be referred to as anoxic 152
samples. 153
154
Low-temperature magnetic measurements
155
Low-temperature magnetic measurements were performed on a superconducting Quantum 156
Design Magnetic Property Measurement System (MPMS), with an instrumental noise level of
157
~10-11 Am2. Two types of low-temperature measurements were performed in this study: (1) 158
saturation isothermal remanent magnetization imparted at room temperature (RT-SIRM) by 159
applying a maximum field of 5 T at 300 K followed by continuous cooling in zero field to 5 K 160
and subsequent continuous warming back to 300 K. (2) Hysteresis loops measured between 161
magnetic peak fields of ± 5 T at 15 distinct temperatures between 5 and 295 K. From these 162
loops the temperature dependence of the standard hysteresis parameters such as saturation 163
magnetization (MS), saturation remanent magnetization (MRS) and coercive force (BC) were
164
determined. 165
166
Scanning electron microscopic results
167
Discrimination between titanomagnetite and hemoilmenite
168
Studies such as Franke et al. (2007b) and Lattard et al. (2005) have shown that the EDS 169
intensity ratios of the characteristic Fe Kα and Ti Kα lines can be used under certain 170
conditions to differentiate between mineral phases of the magnetite-ulvöspinel and ilmenite-171
hematite solid solution series. Element spectra with high Fe/Ti intensity ratios were found to 172
be rather typical of titanomagnetite while low Fe/Ti ratios are indicative of hemoilmenite. 173
Accepted Manuscript
With increasing Ti-content the Fe/Ti ratio decreases for both solid solution series, the lowest 174possible value is Fe/Ti = 2 for the magnetite-ulvöspinel solid solution series and Fe/Ti = 1 for 175
the ilmenite-hematite solid solution series according to their respective stoichiometric 176
formulas. Ratios of Fe/Ti < 1 constitute members of the ternary system between rutile (TiO2)
177
and the pseudobrookite-ferropseudobrookite solid solution series (Fe2TiO5 - FeTi2O5).
178
Therefore particles with ratios of Fe/Ti > 2 could be theoretically either members of the 179
magnetite-ulvöspinel or the ilmenite-hematite solid solution series, while particles with ratios 180
of 1 ≤ Fe/Ti < 2 can only be members of the ilmenite-hematite solid solution series. 181
To test this method, EDS spectra were taken from a defined synthetic sample (6F72x2.4) 182
of well-known composition, which was provided by the Mineralogical Institute of the 183
University of Heidelberg. The sample was synthesized at 1300°C in the Fe-Ti-O system and 184
contains titanomagnetite (TM63) and synthetic hemoilmenite (= ferrian ilmenite; 185
Ilm76Hem24). This sample was subsequently used as a pre-defined standard to which the 186
EDS peak intensities of the unconsolidated natural particles of this study were compared. 187
Another advantage of the synthetic sample is its ideal flat polished surface, which means that 188
considerable scattering effects can be neglected. 189
The element spectra were derived on the same SEM instrument for both the synthetic and 190
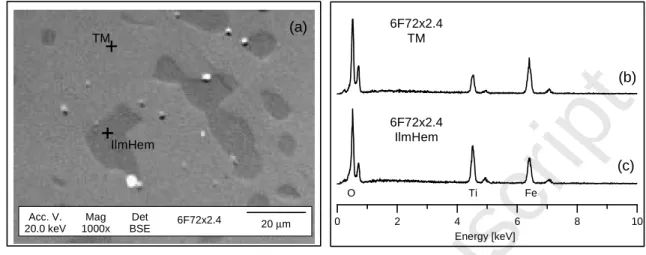
natural samples. Fig. 3a shows a backscatter electron (BSE) micrograph of the synthetic 191
sample 6F72x2.4. The gray tones in the BSE image reflect the different chemical 192
compositions of the two mineral phases, with lighter areas corresponding to titanomagnetite 193
(Fe-richer areas) and darker areas corresponding to members of the ilmenite-hematite solid 194
solution series (Fe-poorer areas). Completely black or white spots mark pores in the polished 195
sample, where surface charging might have an effect due to poor carbon coating. The two 196
mineral phases can be discriminated by their EDS element spectra (Figs. 3b and 3c), since the 197
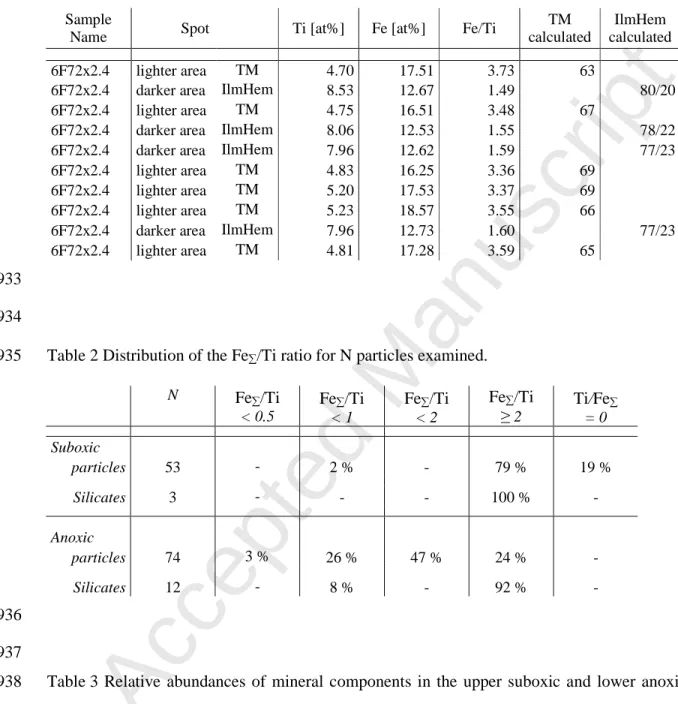
intensity ratios of the characteristic Fe Kα and Ti Kα lines are distinct. In Table 1 the semi-198
Accepted Manuscript
quantified Fe and Ti contents are listed for ten spot checks analyzed on the polished section of 199the synthetic sample. The values were used to calculate the Fe/Ti ratios and the resulting 200
titanomagnetite (TM) and hemoilmenite (IlmHem) mean compositions. Spectra from TM 201
(lighter area) show Fe/Ti ratios > 2, corresponding to quantitative EDS spectra for which the 202
Fe-peak is equal or higher than the Ti-peak. Spectra from hemoilmenite (darker areas) have 203
ratios 1 ≤ Fe/Ti < 2, showing Ti-peaks that are much higher than the Fe-peaks. This can be 204
easily explained by the position of the Ti Kα (at 5.896 eV) and Fe Kα (at 6.403 eV) lines in 205
the spectra, e.g. a particle with the same peak height for both elements contains therefore less 206
Ti than Fe. The average composition of the synthetic sample 6F72x2.4 was calculated as 207
TM68 and Ilm78Hem22. These values are only slightly higher than the compositions (TM63 208
and Ilm76Hem24) derived from published electron microprobe (EMP) analyses and 209
inductively coupled plasma atomic emission spectrometry (ICP-AES) reported by Lattard et 210
al. (2005; 2006). The error of our EDS method is therefore less than 3%. This discrepancy is 211
presumably due to slightly inhomogeneous chemical compositions within the sample from the 212
rim to the center of the synthesized pellet (R. Engelmann, pers. comm., 2006). These results 213
underline that it is in principle possible to discriminate between titanomagnetite and 214
hemoilmenite phases on the basis of the element intensity ratio Fe/Ti, hence that it is possible 215
to calculate a close approximate composition for each individual particle. 216
217
Magnetic particle discrimination
218
The selected beam strength between 12 and 30 kV used for the quantitative EDS analysis 219
detects all main elements within the Fe-Ti-O system and furthermore all potential minor 220
element contributions which might be present in the mineral grains. The elements V, Cr, Al 221
and Ti are common substitutions in hematite, whereas Mg and Mn are rather typical 222
Accepted Manuscript
constituents in ilmenite. Besides Ti, magnetite may also contain the elements Mg, Mn, Cr and 223Al. 224
In practice, the analyzed particles from both solid solution series mainly show 225
substitutions of Mg and Al. Other minor element contributions were rarely detected in our 226
samples and were found in less than 20% of all analyzed particles. The contribution of these 227
additional minor elements to the individual EDS spectra is usually less than 3%. Therefore the 228
effect of minor elements other than Al and Mg can be neglected for this study. This concurs 229
with the fact that Mg and Al are the most common cation impurities in natural 230
titanomagnetites and hemoilmenites found in igneous rocks (Creer et al., 1975). 231
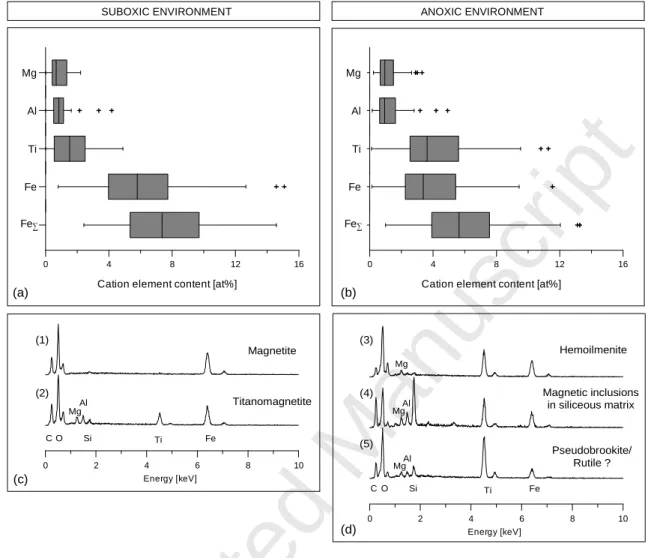
Fig. 4a and 4b show the cation element content in at% for the main elements Fe and Ti 232
and the minor abundant elements Mg and Al for all the examined particles, divided into 233
suboxic and anoxic environments. To generally consider the effect of substitution of Fe with 234
either Mg or Al, regardless for which member of both solid solution series, the total of the 235
three elements Fe, Mg and Al was calculated and will be referred to as Fe∑ (= Fe+Al+Mg) in 236
the following interpretations. 237
The magnetic mineral assemblage of the upper suboxic environment is dominated by Fe-238
rich mineral phases with fairly low Ti-contents (Fig. 4a). In contrast, the Ti-content increases 239
notably and even exceeds the Fe-content in the particles of the lower anoxic samples (Fig. 240
4b). In Fig. 4c and Fig. 4d representative element spectra of typical particles from the 241
magnetic extracts are shown, originating from the upper suboxic and lower anoxic domain. 242
These EDS analyses clearly show that the natural magnetic grains contain minor amounts of 243
other ions than Fe and Ti. The presence of the supplementary elements, such as Na, Mg, Al 244
and Si support the assumption of the detrital origin of these particles. Small amounts of Al 245
and Si are most likely also due to clay mineral coatings on the grains. 246
Accepted Manuscript
In Table 1 the element ratios of Fe∑/Ti for each analyzed particle are divided into the 247Fe∑/Ti ≥ 2; 1 ≤ Fe∑/Ti < 2; 0.5 ≤ Fe∑/Ti < 1 and Fe∑/Ti < 0.5 fractions. In the upper suboxic 248
zone ~19% of the examined particles exhibit spectra without any Ti-content, comparable to 249
spectrum (1) in Fig. 4c. They represent detrital magnetite, a common component in the upper 250
suboxic core section. However, the majority of the magnetic particles contain Ti, with an 251
element ratio Fe∑/Ti varying between 0.75 and 13.89; 79% of these particles have Fe∑/Ti 252
ratios ≥ 2, only 2% have Fe∑/Ti ratios < 1 (Table 2). 253
According to the (semi-)quantitative EDS spectra, the Ti-content for particles with ratios of 254
Fe∑/Ti ≥ 2 varies between 0.4 and 4.9 at%. As already explained in the precedent section, this 255
could either correspond to a titanomagnetite composition between TM20 and TM90 or 256
tocompositions between Ilm13Hem87 and Ilm60Hem40 for members of the ilmenite-hematite 257
solid solution series. For 0 ≥ x > 0.75 these assumed titanomagnetite compositions are 258
conceivable. However, titanomagnetites with x > 0.75 are quite uncommon in nature 259
(Petersen and Bleil, 1982). Instead it is more likely that grains with x > 0.75 represent 260
hemoilmenite particles instead, which then would correspond to compositions between 261
Ilm50Hem50 and Ilm60Hem40. Hemoilmenites of such compositions are typical for 262
volcanogenic rocks that underwent high-temperature deuteric oxidation processes. 263
We have to keep in mind however, that natural mineral grains of the magnetite-ulvöspinel 264
and ilmenite-hematite solid solution series occur rarely in completely homogenous 265
compositions. In fact paragenesis between Ti-poor (titano-)magnetite or ilmenohematite and 266
Ti-rich hemoilmenite is a common aftereffect of oxy-exsolution of volcanic rocks. Depending 267
on the progression of such alterations, the crystal matrix might contain exsolution lamellae in 268
nano- or even micrometer scale (e.g. McEnroe et al., 2001; Garming et al., 2007). The EDS 269
analyses has a spatial resolution of ~ 0.5 µm, therefore it was possible to resolve 270
inhomogeneities up to that limit. Beyond this spatial resolution we might have to deal to a 271
Accepted Manuscript
certain degree with overlap analyses, if exsolution features are present in a given grain. For 272particles larger than 0.5 µm, multiple spot analyses were performed to check local 273
inhomogeneities or to derive average compositions. 274
Additionally, magnetic inclusions in silicates were observed. They make up ~5 % of the 275
magnetic assemblage in the upper suboxic zone. The major elements in the measured spectra 276
are Si and O, which are accompanied by Fe and Ti as minor components. Calculated element 277
compositions for the magnetic inclusions show Fe∑/Ti ratios of ≥ 2, resulting in either TM15 278
to TM60 or alternatively Ilm09Hem91 to Ilm40Hem60. Such typical Ti-poor composites have 279
been found in various sedimentary environments as described by e.g. Garming et al. (2005). 280
Shrinking cracks are evidence for a mild maghemitization (Dunlop and Özdemir,1997), 281
but only a small number was observed in the upper suboxic sample. This suggests that (titano-282
)maghemite is of low importance in these samples. In addition to the observed microparticles, 283
a considerable number of much smaller grains in the nm-range are present in the sample from 284
the upper suboxic zone. These grains are beyond the spatial resolution of the used SEM. This 285
is indicative for the presence of small PSD/SD particles. 286
In contrast to the analysis of the suboxic sample, only minor amounts of nm-sized particles 287
were observed in the magnetic extracts from 14.55 and 15.25 m. These samples mainly 288
consist of somewhat “coarser” grains in the grain-size range from ~2 to 5 µm. Non-magnetic 289
particles, such as silicates and feldspars are more abundant here than in the upper suboxic 290
sample. This has to be kept in mind for the interpretation of the hysteresis data. 291
The average Ti-content of all particles examined is notably higher for the anoxic samples 292
(~ 4.06 at%) compared to the suboxic samples (~1.61 at%) and even exceeds the meager Fe 293
content (Fig. 4b). When taking the Mg and Al concentrations into account, the mean value of 294
Fe∑ is slightly higher than the average Ti-content. 295
Accepted Manuscript
In terms of numbers of grains the Ti-rich mineral phases clearly dominate the (magnetic) 296mineral inventory in the lower anoxic sediments. Here the ratios Fe∑/Ti vary between 0.21 297
and 4.87, particles without any Ti-content were no longer observed. Only 24% of the 298
examined grains exhibit Fe∑/Ti ratios ≥ 2. These particles would either refer to compositions 299
between TM51 and TM99 or to compositions of Ilm34Hem66 to Ilm66Hem34. Particles with 300
1 ≤ Fe∑/Ti < 2 (47%) appear to be the most abundant members of the ilmenite-hematite solid 301
solution series. Their Ti-content varies between 0.95 and 7.04 at%, corresponding to 302
Ilm68Hem32 and Ilm99Hem01, respectively. 303
Additionally, a considerable number of particles yield Fe∑/Ti ratios of < 1 (26%) or even 304
< 0.5 (3%). The element spectra for this particle type exhibit much higher Ti- than Fe-content 305
(Fig. 3; compare spectrum (5)). This composition corresponds rather to the pseudobrookite-306
ferropseudobrookite solid solution series. Pseudobrookite may be present in the detrital Fe-Ti 307
oxide assemblage as minor constituents within titanomagnetite and –hematite grains as a 308
result of high-temperature oxidation during the initial cooling of igneous rocks (Reynolds and 309
Goldhaber, 1978; Frost and Lindsley, 1991). Another possibility for the genesis of such Ti-310
rich mineral phases is the further alteration of members of the ilmenite-hematite solid solution 311
series towards hematite with fine rims of anatase (Houston and Murphy, 1962). This would 312
enrich the elemental bulk composition of the grains in terms of their TiO2 content.
313
The number of silicates with magnetic inclusions was found to be reasonably higher (14%) 314
in the anoxic sediments compared to the suboxic sample (5%). The majority of these 315
inclusions (92%) have Fe∑/Ti ratios ≥ 2 (resulting in compositions of TM09 to TM75 or 316
Ilm06Hem94 to Ilm50Hem50), only 8% of the inclusions show Fe∑/Ti ratios of < 1. 317
318 319
Accepted Manuscript
Summary of SEM results
320
As mentioned above, titanomagnetites with x > 0.75 are quite rare in nature (Petersen and 321
Bleil, 1982). The range of the composition for hemoilmenite strongly relates to the bulk 322
chemistry of the rock, but lies typically above y = 0.5 (Petersen and Bleil, 1973). Considering 323
these restrictions, the approximate abundances of the various Fe-Ti oxides in the magnetic 324
mineral assemblage of the investigated samples can be estimated (Table 3). 325
The mineral assemblage of the upper suboxic environment constitutes ~19% magnetite, 326
~62% titanomagnetite (TM20 to TM70), ~17% hemoilmenite (Ilm50Hem50 to Ilm60Hem40) 327
and ~2% other particles. The composition of magnetic inclusions in the siliceous matrix 328
varies between TM15 and TM60. The main magnetic mineral component in the magnetic 329
assemblage of the lower suboxic environment is hemoilmenite with an abundance of ~66% 330
and compositions varying between Ilm53Hem47 and Ilm99Hem01. Pure magnetite is no 331
longer present and only ~5% titanomagnetite was found. The remaining ~28% are Ti-rich 332
particles, such as (ferro-)pseudobrookite or rutile. When titanomagnetite is preserved as 333
inclusions in a siliceous matrix it apparently withstands diagenetic alteration even in the 334
anoxic environment. 335
336
Low-temperature magnetic results
337
Room-temperature SIRM (RT-SIRM)
338
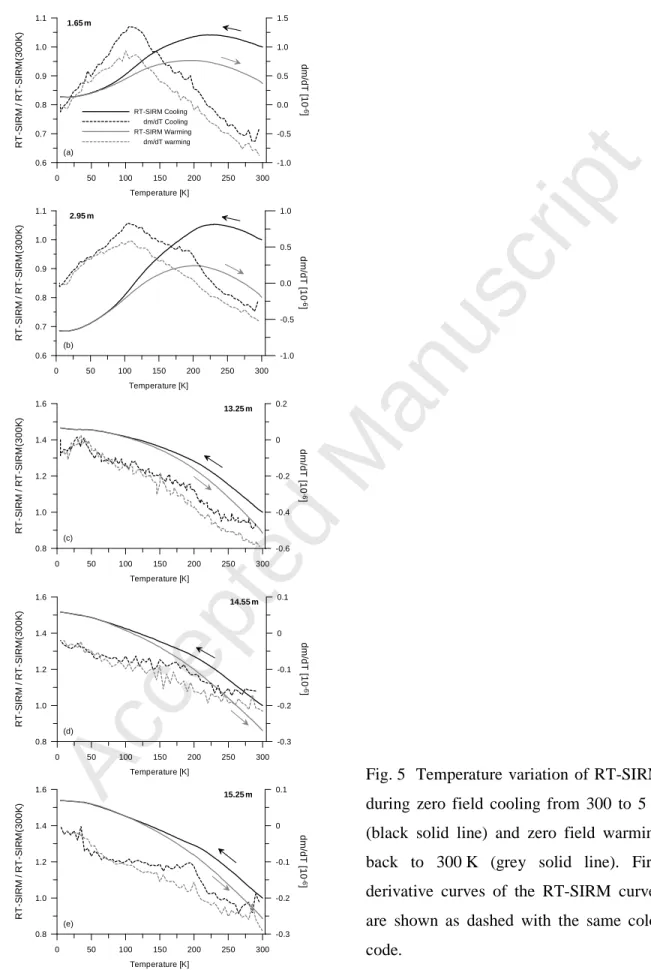
Fig. 5 shows the RT-SIRM curves normalized to their initial value at 300 K and the respective 339
derivatives for all analyzed samples. The samples from the suboxic zone (Fig. 5a-b) clearly 340
show ferrimagnetic dominated curves typical of (titano-)magnetite as described by Özdemir 341
and Dunlop (2003) and Kosterov (2003). The RT-SIRM first increases upon cooling, reaching 342
a maximum around 220 K (Fig. 5a) and 230 K (Fig. 5b). According to Dankers (1978) such 343
an increase upon cooling is related to an increase in the spontaneous magnetization of 344
Accepted Manuscript
titanomagnetite phases whose Curie point is above the temperature where the remanence is 345acquired. For such cases the spontaneous magnetization has not reached its maximum 346
intensity at 300 K, which results in an increase while cooling. Upon further cooling the RT-347
SIRM curves decrease with decreasing temperature. At 5 K some 83% (Fig. 5a) and 69% 348
(Fig. 5b) of the initial RT-SIRM are demagnetized. At 100 to 110 K the maximum gradient of 349
the cooling curve is reached, corresponding to the temperature interval that is indicative for 350
the Verwey structural phase transition of magnetite. This complies with results from zero field 351
cooling (ZFC) and field cooling (FC) thermal demagnetization experiments, published by 352
Dillon and Bleil (2006), which revealed partially suppressed Verwey transitions in the same 353
temperature interval. During warming from 5 to 300 K the RT-SIRM retraces the cooling 354
curve between 5 and 50 K. Upon further warming only limited remanence recovery is 355
observed when passing back through the Verwey transition. At 300 K about 87% (Fig. 5a) 356
and 80% (Fig. 5b) of the initial RT-SIRM is recovered. 357
The RT-SIRM behavior of samples from the anoxic zone differs strongly to that of the 358
samples from the suboxic layers. However, within the anoxic zone all samples (Fig. 4 c-d) 359
reveal very similar low-temperature behavior with comparable remanence memory. The RT-360
SIRM cooling curves show a continuous gradual increase between 300 and 5 K, where the 361
RT-SIRM is 46 to 69% higher than the initial remanence. Upon warming the curves resemble 362
the corresponding cooling curves back to ~ 100 K. However, above 100 K the warming 363
curves are below the cooling curves. The remanence loss when returning to 300 K accounts 364
for 86 to 89% of the initial RT-SIRM. No specific magnetic transitions were observed on 365
warming, though the first derivatives of samples 13.25 and 15.25 m display an inflection 366
around 210 K. This may be indicative of the transition of hemoilmenite with an approximate 367
composition of y = 0.85 from ferrimagnetism / superparamagnetism back to paramagnetism 368
(Burton et al., 2008). 369
Accepted Manuscript
370Low-temperature magnetic hysteresis
371
For all five magnetic extracts the temperature dependence of their hysteresis loops was 372
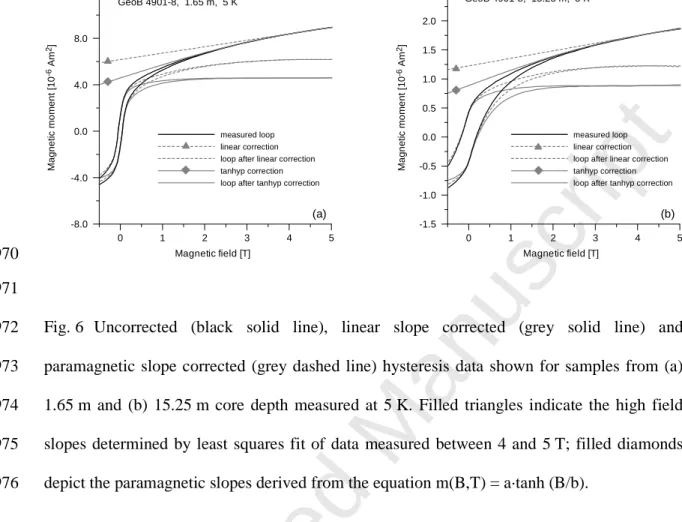
examined between 5 and 295 K. The measured hysteresis loops contain diamagnetic 373
contributions originating from the sample holder (gelatine capsule) and non-ferromagnetic 374
sediment constituents in the extracts such as feldspars and silicates, which to a certain extent 375
were included in the extract. The temperature dependence of the paramagnetic contribution 376
was calculated, using the relationship m(B,T) = a · tanh (B/b), where -m(B,T) equals the 377
measured magnetic moment in the applied field B at the temperature T, and a and b are 378
constants (Dunlop and Özdemir, 1997). This approach was necessary since the induced 379
magnetization of paramagnetic constituents begins to saturate in high fields at low-380
temperatures and cannot be approximated with a linear function. Using this approach, 381
excellent fits to the magnetization curves were achieved (Fig. 6). 382
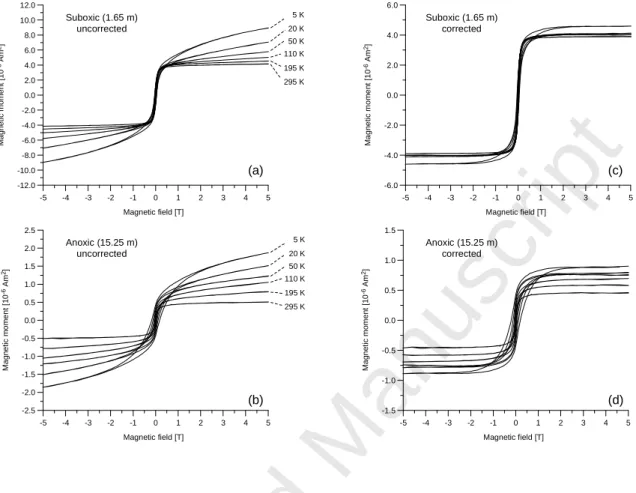
The results of hysteresis measurements for the suboxic and anoxic samples are largely 383
different. To represent the suboxic and anoxic environments, the temperature evolution of the 384
hysteresis loops is shown for the samples from 1.65 m (Fig. 7a) and 15.25 m (Fig. 7b) depth. 385
For the sake of clarity only six selected temperature steps (295 K, 195 K, 110 K, 50 K, 20 K 386
and 5 K) are given here. The hysteresis loops systematically change in shape with decreasing 387
temperature and increasing sediment depth. At room temperature hysteresis loops for all 388
extracts are quite narrow and yield low coercivities. Saturation magnetization is usually 389
reached in low to moderate fields (< 500 mT), which is indicative of the presence of a soft 390
ferrimagnetic mineral phase. With decreasing temperature the loops become more pronounced 391
and wider, in particular, the samples from the anoxic zone exhibit distinct hysteresis at lower 392
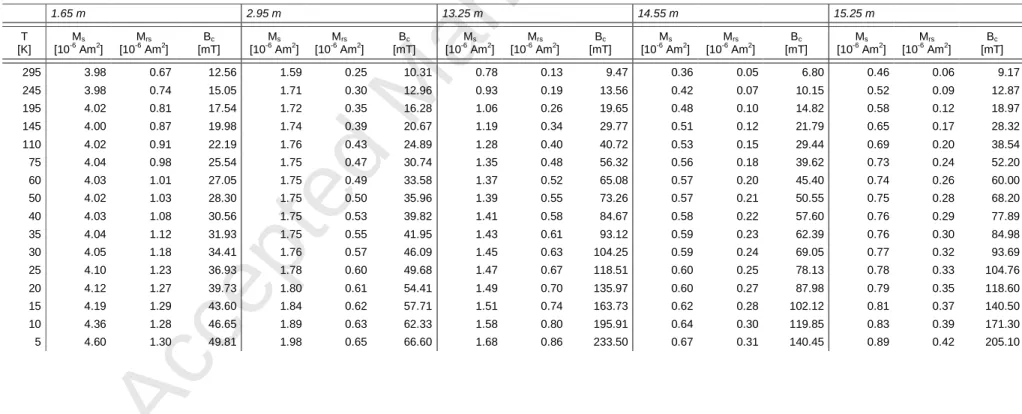
temperatures. This effect is most pronounced in the temperature dependence of BC (Table 4).
Accepted Manuscript
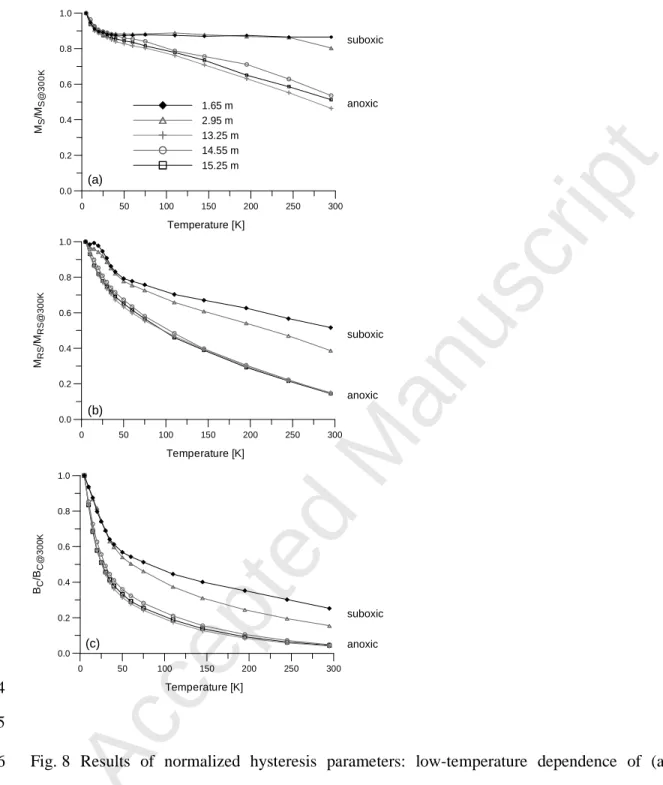
The temperature dependence of the hysteresis properties quantified after dia- and 394paramagnetic correction is shown in Fig. 8. Due to the inability of mass determination, the 395
parameters have been normalized to their respective value at 5 K so that the samples can be 396
compared with each other. The absolute values are summarized in Table 4. 397
The saturation magnetization MS (Fig. 8a) for the suboxic samples shows only subtle
398
temperature variations between 295 and 30 K. Upon further cooling to 5 K an increase of 399
about 20% is observed. In contrast a quasi-continuous increase for MS with decreasing
400
temperature can be seen for the anoxic samples. At 5 K the values for MS are about a factor of
401
two to three higher for the anoxic and only 1.15 for the suboxic samples compared to room 402
temperature. However, the complexity of the paramagnetic correction may effect the accurate 403
determination of MS and thus the results should be treated with caution.
404
Saturation remanence MRS (Fig. 8b) for the suboxic samples increases slightly between
405
295 and 50 K and in a steeper manner below 50 K. MRS seems to reach saturation at very low
406
temperatures, however, the overall increase of two to three times is relatively small. For the 407
anoxic samples a continuous increase with decreasing temperature is observed, with an 408
overall seven-fold increase between 295 and 5 K. 409
At room temperature, values of BC (Fig. 8c) range between 6 and 13 mT for all samples.
410
Thompson and Oldfield (1986) report this as a typical value for multi-domain magnetite. 411
Upon cooling, BC varies little between 295 and 50 K. Below 50 K the coercive field starts to
412
increase sharply, reaching values of 50 – 67 mT at 5 K for the suboxic samples and up to 413
140 – 233 mT for the anoxic samples. This equals a four- and seven-fold increase for the 414
suboxic samples and on average 25-fold higher coercivities for all of the anoxic samples. No 415
ordering temperature could be determined from the temperature dependence of the coercivity 416
(such as the magnetic ordering transition from ferrimagnetism to paramagnetism at 210 K for 417
TH80, as seen before in the RT-SIRM cycling experiments, compare to Fig. 5). The distinct 418
Accepted Manuscript
increase of BC below 50 K might potentially be due to the hemoilmenite entering its spin glass419
state (Burton et al., 2008). 420
The hysteresis loops at certain low-temperatures exhibit a peculiar wasp-waisted shape, 421
which is more pronounced for the anoxic than for the suboxic samples (Fig. 9). Roberts et al. 422
(1995) and Tauxe (1996) describe this phenomenon as indicative for a mixture of relatively 423
high- and low-coercive material. Such a mixture could consist of either distinct magnetic 424
minerals or a bi-modal grain-size distribution of a single magnetic component. 425
Large quantities of superparamagnetic magnetite or hard coercivity particles (such as 426
hematite or goethite) are commonly assumed to be the main reason for wasp-wasited 427
hysteresis loops. In this study these options appear implausible for several reasons: the 428
applied extraction method tends to favor the collection of rather low-coercivity components 429
(Franke et al. 2007b). Moreover, hematite and/or geothite must be a hundred times more 430
abundant in the sediment to rival the magnetization of (titano-)magnetite. Secondly, the 431
observed hysteresis loops become more constricted with decreasing temperature. 432
Superparamagnetic (magnetite) particles are expected to cause constriction in the room 433
temperature loops rather than low-temperature loops because they block at lower temperatures 434
and become stable single domain grains (Dunlop, 1973). 435
An alternative explanation for the wasp-waisted hysteresis loops at low-temperature are the 436
observed Ti-rich hemoilmenites with compositions 0.85 < y < 1. These members of the 437
ilmenite-hematite solid solution series are paramagnetic at room-temperature but exhibit 438
superparamagnetic properties just below room temperature and their Néel temperature 439
(Ishikawa, 1962) and antiferromagnetic behavior at lower temperatures (Burton et al., 2008). 440
Accepted Manuscript
Discussion
442
SEM analyses have shown, that the predominant magnetic minerals in the upper suboxic 443
sediments are (titano-)magnetites of variable Ti composition. Both, ilmenohematites and 444
hemoilmenites are also present, but relative to (titano-)magnetite they are less abundant and 445
thus less important in this depth interval. Dillon and Bleil (2006) already suggested that the 446
vast majority of the magnetic assemblage reaching the gravity core location was composed of 447
eroded volcanic material originating from the Cameroon Volcanic Line. Herrero-Bervera et 448
al. (2004) and Ubangoh et al. (2005) reported titanomagnetites, both poor and rich in Ti, as 449
the principal magnetic minerals in rocks from the Cameroon volcanics in the drainage area of 450
the Niger River tributaries. Ubangoh et al. (2005) also observed rocks with abundant ilmenite 451
lamellae in the titanomagnetites. Both investigations used Curie temperature experiments 452
above room-temperature for the discrimination of the magnetic particles. Hemoilmenites with 453
high Ti-contents could not be determined by these former studies, as they may actually have 454
Curie temperatures below room-temperature. Combined with our microscopy findings, which 455
show that hemoilmeniteis are a minor component of the primary magnetic mineral 456
assemblage compared to (titano-)magnetite, sub-room temperature Curie points provide a 457
possible explanation why members of the ilmenite-hematite solid solution series have not 458
been identified previously. 459
In the lower anoxic sediments early diagenetic alteration after deposition has resulted in a 460
more complete depletion of the (titano-)magnetite phase, producing a relative enrichment of 461
the hemoilmenite phase in the strongly diagenetically altered section so that the relative 462
abundance of the hemoilmenite particles increases to ~66%. This change in abundance can be 463
interpreted in terms of selective diagenetic effects on the magnetic mineral assemblage. Dillon 464
and Bleil (2006) reported that reductive diagenesis has extensively affected the magnetic 465
mineral inventory of these organic-rich late Quaternary sediments in the Niger deep-sea fan. 466
Accepted Manuscript
Fig. 2b shows the extent of the suboxic zone and the transition to anoxic conditions in the 467pore water profile of the sedimentary sequence. The rock magnetic investigation showed that 468
diagenetic processes did not act uniformly across the detrital magnetic mineral assemblage, 469
but instead depended strongly on particle size and Ti-content, with the smallest particles 470
dissolving first and the Ti-rich component being the most resistant to the reducing conditions. 471
Another important determining factor is the availability of sulfur in this geochemical system. 472
Due to the already considerable strong alteration of the upper suboxic sediments, one of 473
the main challenges in this study is the generally low magnetic mineral content. Therefore the 474
concentration of magnetic carriers is even lower in the anoxic sediments and only relicts of 475
the primary magnetic mineral assemblage remain. Highly sensitive low-temperature magnetic 476
measurements on the magnetic extracts were therefore required for magnetic mineral 477
identification. These measurements revealed large contrasts between the samples from the 478
suboxic and anoxic layers. This emphasizes that the Fe-Ti oxide phases occur in different 479
proportions in the two different geochemical zonations, which is also reflected in the 480
magnetic behavior of these samples. 481
482
Suboxic samples
483
In the upper suboxic sediments (titano-)magnetite particles dominate the low-temperature 484
magnetic characteristics. The increase in the RT-SIRM cooling curves just below room 485
temperature and the broad decrease around 120 K were described by Özdemir and Dunlop 486
(2003) and Kosterov (2003)as characteristic behavior for a mineral assemblages dominated by 487
(Ti-poor) titanomagnetite (Fig. 3). Additionally, the low-temperature hysteresis 488
measurements confirm the presence of a soft ferrimagnetic mineral phase, documented in the 489
relatively small increase in hysteresis parameters with decreasing temperature. The value of 490
the coercive force, showing an overall increase by a factor of four to seven between 300 and 491
Accepted Manuscript
5 K, is comparable with results obtained from synthetic magnetites by Özdemir et al. (2002). 492Harrison and Putnis (1995) analyzed the low-temperature dependence of the magnetite-493
ulvöspinel solid solution series and observed low coercivities (10 mT) for the magnetite-rich 494
(Fe-rich) endmembers at low-temperatures (4.4 K). The synthetic submicron magnetites in the 495
study of Özdemir et al. (2002) yield coercivities of ~15 mT at room temperature and ~50 mT 496
at 15 K, which is a similar increase in BC by a factor of three to four. The coercivity of the
497
synthetic samples increases sharply when crossing the Verwey transition because their 498
compositions are close to stoichiometry. The lack of the Verwey transition in the suboxic 499
samples of this study is presumably due to their Ti-content, since at fairly low Ti-contents of 500
x > 0.04 the transition is suppressed (Kakol et al., 1994). The small amount of observed 501
shrinking cracks is indicative of a small degree of maghemitization, which may additionally 502
subdue the Verwey transition (Dunlop and Özdemir, 1997). Tucker (1981) reported low-503
temperature magnetic hysteresis properties for two multi domain titanomagnetite crystals with 504
compositions of x = 0.52 and x = 0.65. The first titanomagnetite (x = 0.52) shows values of 505
BC (~25 mT) and MRS/MS (0.29) at 77 K that are comparable with our results at 75 K of
506
BC=25 mT and a MRS/MS ratio of 0.25. The calculated average titanomagnetite composition
507
for our suboxic mineral assemblage results in a mean value of TM55 which is very close to 508
the composition of the respective single crystal of Tucker (1981). For the TM65 crystal from 509
the study of Tucker (1981) the reported values are higher (BC = 58mT; MRS/MS = 0.58), with
510
the increased coercivity explained as a result of increasing in magnetic anisotropy. At even 511
lower temperatures of 4.2 K, Schmidbauer and Readman (1982) observed coercivity values of 512
comparable magnitude for titanomagnetites with compositions of x = 0.5 (BC ~ 31 mT) and
513
x = 0.6 (BC ~ 70 mT).
514
The hysteresis loops of the suboxic samples show wasp-waisted shapes at lower 515
temperatures. The presence of an intermediate titanomagnetite phase in paragenesis with a 516
hemoilmenite phase as described by Krása et al. (2005) would offer a reasonable explanation 517
Accepted Manuscript
for this behavior. According to Buddington and Lindsley (1964) the ilmenite content of a 518hemoilmenite phase coexisting with a titanomagnetite phase with a composition of x > 0.5 519
would be y > 0.85. Since hemoilmenite phases of y > 0.87 exhibit superparamagnetic 520
properties at low-temperatures (Ishikawa, 1962), this could explain the constriction that was 521
observed in the hysteresis loops of the suboxic samples. This is also consistent with the SEM 522
and EDS analyses, which revealed the presence of hemoilmenite as minor constituents 523
(~17%) in the primary magnetic mineral assemblage of the suboxic samples. 524
Nevertheless, the Ti-contents derived from the SEM analysis are not overly high. 525
However, the hysteresis loop for the synthetic sample 6F72x2.4 clearly shows wasp-waisted 526
characteristics at temperatures ≤ 55 K (Fig. 10), even though the composition of the 527
hemoilmenite phase is below y = 0.8. With y = 0.76 the hemoilmenite composition of 528
6F72x2.4 is still higher than in our natural sample, but it generally shows that wasp-waisted 529
shapes do occur for such Ti-contents. The distribution of the two phases in the synthetic 530
sample is comparable (79% TM : 21% IlmHem) to the derived distribution in our natural 531
suboxic sample (82% Mt/TM : 17% IlmHem). Therefore the wasp-waisted shape in our 532
hysteresis loops is most likely the result from the interplay between titanomagnetite and 533 hemoilmenite. 534 535 Anoxic samples 536
The results of the low-temperature measurements from the anoxic layers lead to the 537
conclusion, that titanomagnetite can not be the predominant magnetic mineral phase in this 538
depth interval. Here, Ti-rich hemoilmenite dominates the magnetic mineral assemblage. This 539
was also confirmed by the findings of Heslop and Dillon (2007), who used a non-negative 540
matrix factorization (NMF) algorithm to unmix remanence data into constituent end-members 541
from the same Niger deep-sea fan sediments. Based on the coercivity distribution, fine and 542
Accepted Manuscript
coarse grained (titano-)magnetite was found to make the greatest contribution to the 543remanence signal in the upper sediments. However, a third component was needed to 544
successfully model the detrital magnetic mineral assemblage. This third component 545
comprised the hardest coercivity and was argued to be Ti-rich titanomagnetite or 546
hemoilmenite. It could be shown by the present study, that below the anoxic/sulphidic 547
transition, this Ti-rich component had the highest resistance to reductive dissolution and 548
dominates the magnetic mineral assemblage. The coarse and fine (titano-)magnetite fraction 549
almost disappears completely towards the base of the sediment core. 550
During cooling, the RT-SIRM increases continuously with decreasing temperature. Franke 551
et al. (2007c) considered two possibilities for this phenomenon, either the presence of a high-552
coercive mineral such as goethite or a Ti-rich oxide phase. Due to their assumption that high-553
coercivity minerals are generally under-represented in magnetic extracts, it appears more 554
probable for the natural samples in this study that a Ti-rich mineral phase is responsible for 555
the observed increase of RT-SIRM during cooling. The assumption that this behavior can be 556
attributed to the presence of hemoilmenite in our Niger deep-sea fan samples is therefore 557
reasonable, although the interpretation of low-temperature RT-SIRM curves from comparable 558
natural samples is still lacking in the literature (Kosterov, 2007). 559
Fig. 11 compares the low-temperature measurements performed on the natural sample 560
from gravity core GeoB 4901 (15.25 m; Fig. 11a) and the well-defined synthetic sample 561
6F72x2.4 (Fig. 11b). The continuous increasing trend in the RT-SIRM curves with decreasing 562
temperature can be seen for both samples. Since the composition of the synthetic sample is 563
well known, goethite can be excluded as a possible reason for this low-temperature behavior. 564
Here this phenomenon can be rather attributed to the presence of a Ti-rich mineral phase. The 565
RT-SIRM curve of another well-defined single phase titanomagnetite of synthetic origin 566
(TM60) (not shown here; R. Engelmann, unpublished data) shows a rather similar RT-SIRM 567
Accepted Manuscript
curve progression as the suboxic samples of this study, with a large decrease around 190 K. 568This particular sample does not contain any hemoilmenite, therefore we suggest that in the 569
two-phase synthetic sample 6F72x2.4 the distinct low-temperature increase refers to the 570
presence of a Ti-rich hemoilmenite phase. 571
This sample possibly shows paramagnetic-like LT-behavior caused by the presumable 572
presence of near endmember ilmenite. The magnetically harder nature of this mineral phase 573
suggests that a higher coercitivity magnetic component other than (titano-)magnetite must be 574
present to create such a low-temperature increase in the RT-SIRM. In particular the EDS 575
results of the SEM analyses confirm an overall higher content of Ti-rich particles in the lower 576
anoxic part of the sediment series. The main component here is hemoilmenite (~66%) with 577
compositions between Ilm50Hem50 up to nearly pure ilmenite (Ilm99Hem01). 578
The unusually high coercivities of the anoxic samples at low-temperatures also concur with 579
the presence of hemoilmenite, rather than titanomagnetite. The stability at low-temperatures 580
with BC values up to 220 mT is remarkable. For titanomagnetites such high coercivities at
581
low-temperatures have been rarely published in the literature. Schmidbauer and Readman 582
(1982) reported coercive forces of 500 mT for synthetic titanomagnetites with a composition 583
of x = 0.8 at 4.2 K, which is twice as high as the natural samples in our study. 584
Brown et al. (1993) also reported coercivity values for members of the ilmenite-hematite 585
solid solution series. For synthetic ilmenohematites (= titanohematites) with compositions of 586
y = 0.2 and y = 0.4 to 0.6 they observed values between 170 mT and 260 mT at temperatures 587
of 125 K. They also found that samples quenched at high-temperatures have significantly 588
higher coercivities than those annealed at temperatures below the order-disorder transition of 589
hemoilmenite. Nord and Lawson (1992) correlate this behavior to the development of twin 590
domain boundaries during quenching from high-temperature, and suggest that annealing 591
Accepted Manuscript
above the order-disorder transition temperature results in a substantial increase in twin-592domain boundaries and a drastic increase in the coercivity of the material. 593
Gehring et al. (2007) studied micromagnetic properties of ilmenite-hematite particles 594
originating from an alluvial soil. X-ray diffraction revealed hemoilmenite grains with an 595
ilmenite mole fraction of y = 0.86. The hysteresis loops at 20 K yielded BC = 92mT, reached
596
BC = 144 mT at 15 K, and BC = 244 mT at 6 K. These values are clearly consistent with the
597
results of our study (compare Table 2). Here, the calculated average hemoilmenite 598
composition is Ilm77Hem23. In metamorphic ilmenite-hematite bearing rocks from Norway 599
stable natural remanences have been identified by McEnroe et al. (2001). Such natural phases 600
show high coercivities that are attributed to their small grain-sizes (Merrill, 1968, McEnroe et 601
al., 2001). 602
Besides the unusually high coercivities of the natural samples, the wasp-waisted shape of 603
the low-temperature hysteresis loops hints at the presence of Ti-rich hemoilmenite phases. For 604
the suboxic samples the wasp-waisted shape could be explained by the interaction between 605
titanomagnetite and hemoilmenite. In the anoxic sediments titanomagnetite is only present in 606
very minor amounts (~5%), but wasp-waisted hysteresis loops are still observed. These are 607
most pronounced in the temperature interval between 30 and 50 K. Apparently, another 608
mechanism must be responsible for this phenomenon. The hysteresis loops measured by 609
Gehring et al. (2007) showed typical wasp-waisted shapes at temperatures between 150 and 610
30 K, which became more pronounced with decreasing temperature. They explained the 611
wasp-waisted shape by the generation of short-range ordered areas in the superparamagnetic 612
state within the hemoilmenite particles. 613
Hemoilmenites with 0.8 ≤ y ≤ 0.87 are known to exhibit superparamagnetic behavior at 614
temperatures below 50 K (Ishikawa et al., 1985) and thus can account for the wasp-waisted 615
shape of the hysteresis loops at low-temperatures. Such Ti-rich phases are rather untypical as 616
Accepted Manuscript
individual homogenous grains, but are more likely to be present as intergrown exsollution 617lamellae within the Ti-poor ilmenohematite matrix. Dunlop and Özdemir (1997) report that if 618
the cooling of a melt is slow enough, hemoilmenite of intermediate composition tends to 619
exsolve into intergrown Ti-poor (near hematite) and Ti-rich (near ilmenite) phases. However, 620
compositions with y > 0.8 were identified in the magnetic extracts of this study. Whether they 621
consist of either homogenous grains or of intergrown exsolved phases cannot be verified by 622
the technique used for our unconsolidated samples but it seems very likely. 623
Nord and Lawson (1992) reported that hemoilmenites with y > 0.5 are magnetically 624
inhomogeneous and consist of cation-ordered ferrimagnetic microstructures which are 625
separated by boundary layers. Earlier, Lawson and Nord (1984) showed that synthetic 626
Ilm80Hem20 (y = 0.8) samples had remanence properties that can be explained by the 627
presence of a single SD-like magnetic carrier, even though Ilm80Hem20 should be 628
paramagnetic at room temperature. The source of the measured remanence is argued to be 629
SD-like material within the grains themselves, resulting from the generation of transformation 630
induced domain boundaries, which are partly enriched in the hematite component relative to 631
the bulk composition of the grain. 632
Specific low-temperature magnetic measurements can be used to differentiate between Fe 633
and Ti dominated magnetic mineral assemblages. If Fe-rich mineral phases prevail, RT-SIRM 634
cycles in the low-temperature range show a distinct decrease around the Néel temperature 635
and/or Verwey transition of magnetite. For Ti-rich particles the RT-SIRM curves 636
continuously increase with decreasing temperature. However, solely on the basis of the RT-637
SIRM experiments it is not possible to differentiate unambiguously between the magnetite-638
ulvöspinel (Fe3-xTixO4) and ilmenite-hematite solid solution series (Fe2-yTiyO3). The hysteresis
639
parameters reveal additional diagnostic features that can help to differentiate between Fe-rich 640
and Ti-rich oxide mineral phases. The characteristic evolution of the measured loops with 641
Accepted Manuscript
decreasing temperature points towards two distinct mineral phases in the different 642environments. In particular the coercive force was found to be a helpful indicative parameter, 643
with a 25-fold increase characteristic of phases from the ilmenite-hematite solid solution 644
series. Such high values were not found for any Fe-rich mineral phase. The high coercivities 645
most likely result from exsolution or lamellar magnetism in hemoilmenite grains. 646
647
Environmental implication: correlation of Fe and Ti vs. κ
648
EDS analyses have clearly shown, that Fe-rich particles dominate the magnetic mineral 649
assemblage in the upper suboxic environment, whereas Ti-rich particles prevail in the lower 650
anoxic section. The dominance of Ti-rich magnetic particles in the lower anoxic environments 651
is also strongly reflected in the downcore profile of the volume magnetic susceptibility κ. 652
Fig. 12 (left) shows the downcore profiles of κ compared to the solid phase concentrations of 653
Fe and Ti in the bulk sediments derived from ICP-EAS analysis (Zabel et al., 2001). 654
The correlation between κ and Fe is in general clear throughout the whole depth profile, as 655
is the correlation between κ and Ti. Only for the depth interval from the top of the core to the 656
modern Fe-redox boundary (upper three meters) is the correlation not significant. However, 657
for this section the correlation is higher between κ and Fe (r = 0.17, Pearson; Fig. 12d) 658
relative to the correlation between κ and Ti (r = 0.05; Fig. 12e). Below the modern Fe-redox 659
boundary the correlation between κ and Ti is consistently higher than between κ and Fe. Not 660
including the upper three meters, Pearson´s correlation coefficient between κ and Ti (r = 0.70) 661
is noticeably higher than between κ and Fe (r = 0.51). 662
Between 3.0 and 12.5 m core depth the correlation of κ and Ti is considerably higher 663
(r = 0.79) than for κ and Fe (r = 0.29; Fig. 12d-e). This suggests that below the modern Fe-664
redox boundary the relative contribution of Ti-rich mineral phases to the magnetic 665
Accepted Manuscript
susceptibility signal increases notably. The transition from suboxic to anoxic sedimentary 666conditions is located at 12.5 m core depth. Below this transition the highest correlation of 667
r = 0.86 exists between κ and Ti. For the same depth interval the correlation also increases 668
slightly again for κ and Fe (r = 0.59; Fig. 12d). Here, iron is mainly bound to non-magnetic 669
phases such as pyrite, which was identified in previous high-temperature thermomagnetic 670
measurements (Dillon and Bleil, 2006). This agrees well with the fact that the magnetic 671
susceptibility of hemoilmenites (χ = 100 - 100000·10-8
m3/kg; Bleil und Petersen, 1982) is at 672
least one magnitude higher compared to the magnetic susceptibility of pyrite (χ = 30·10-8 673
m3/kg; Thompson and Oldfield, 1982). 674
In the uppermost core section above the modern Fe-redox boundary, the good correlation 675
between κ and Fe implies that reactive Fe is bound in Fe-rich magnetic mineral phases. These 676
phases dominate the magnetic mineral assemblage, both in concentration and concerning their 677
magnetic properties. 678
In the subsequent lower suboxic and anoxic intervals the clear correlation between κ and 679
Ti and the less pronounced correlation between κ and Fe demonstrates that most of the Fe is 680
bound to phases that are non-magnetic at room-temperature or is present in its reduced state. 681
Here reactive Fe was subsequently depleted, relocated and the formation of secondary Fe 682
minerals took place. As a consequence the influence of the Ti-rich phases on the magnetic 683
signal increases significantly. This is also reflected in the magnetic susceptibility record. 684
Therefore we conclude that the degree of correlation between κ and Fe, and Fe and Ti, 685
represents whether the magnetic assemblage is dominated rather by Fe-rich magnetic mineral 686
phases, components of intermediate Ti-content, depleted in reactive Fe, or by Ti-rich 687
magnetic phases, including mainly non-reactive Fe. 688