HAL Id: hal-00275914
https://hal.archives-ouvertes.fr/hal-00275914
Submitted on 25 Apr 2008
HAL is a multi-disciplinary open access
archive for the deposit and dissemination of
sci-entific research documents, whether they are
pub-lished or not. The documents may come from
teaching and research institutions in France or
abroad, or from public or private research centers.
L’archive ouverte pluridisciplinaire HAL, est
destinée au dépôt et à la diffusion de documents
scientifiques de niveau recherche, publiés ou non,
émanant des établissements d’enseignement et de
recherche français ou étrangers, des laboratoires
publics ou privés.
VLTI monitoring of the dust formation event of the
Nova V1280 Scorpii
O. Chesneau, D. P. K. Banerjee, F. Millour, N. Nardetto, S. Sacuto, A. Spang,
M. Wittkowski, N. M. Ashok, R. K. Das, C. Hummel, et al.
To cite this version:
O. Chesneau, D. P. K. Banerjee, F. Millour, N. Nardetto, S. Sacuto, et al.. VLTI monitoring of the
dust formation event of the Nova V1280 Scorpii. Astronomy and Astrophysics - A&A, EDP Sciences,
2008, 487, pp.223-235. �10.1051/0004-6361:200809485�. �hal-00275914�
hal-00275914, version 1 - 25 Apr 2008
April 25, 2008
VLTI monitoring of the dust formation event of the Nova
V1280 Sco
⋆
O. Chesneau
1, D. P. K. Banerjee
2, F. Millour
3, N. Nardetto
3, S. Sacuto
1, A. Spang
1, M. Wittkowski
4, N. M. Ashok
2,
R. K. Das
2, C. Hummel
4, S. Kraus
2, E. Lagadec
5, S. Morel
6, M. Petr-Gotzens
4, F. Rantakyro
6, and M. Sch¨oller
61 UMR 6525 H. Fizeau, Univ. Nice Sophia Antipolis, CNRS, Observatoire de la Cˆote d’Azur, Av. Copernic, F-06130 Grasse, France e-mail: Olivier.Chesneau@obs-azur.fr
2 Physical Research Laboratory, Navrangpura, Ahmedabad, Gujarat, India
3 Max-Planck-Institut f¨ur Radioastronomie, Auf dem H¨ugel 69, 53121 Bonn, Germany
4 European Southern Observatory, Karl-Schwarzschild-Strasse 2 D-85748 Garching bei M¨unchen, Germany
5 Jodrell Bank Center for Astrophysics, The University of Manchester Oxford Street Manchester M13 9PL, United Kingdom 6 European Southern Observatory, Casilla 19001, Santiago 19, Chile
Received ;accepted
ABSTRACT
Context.We present the first high spatial resolution monitoring of the dust forming nova V1280 Sco performed with the Very Large Telescope Interferometer (VLTI).
Aims.These observations aim at improving the distance determination of such events and constraining the mechanisms leading to very efficient dust formation under the harsh physical conditions encountered in novae ejecta.
Methods.Spectra and visibilities were regularly obtained from the onset of the dust formation 23 days after discovery (or 11 days after maximum) till day 145, using the beam-combiner instruments AMBER (near-IR) and MIDI (mid-IR). These interferometric observations are complemented by near-infrared data from the 1.2m Mt. Abu Infrared Observatory, India. The observations are first interpreted with simple uniform and Gaussian models but more complex models, involving a second shell, are necessary to explain the data obtained from t=110d after outburst. This behavior is in accordance with the light curve of V1280 Sco which exhibits a secondary peak around t=106d, followed by a new steep decline, suggesting a new dust forming event. Spherical dust shell models generated with the DUSTY code are also used to investigate the parameters of the main dust shell.
Results.Using uniform disk and Gaussian models, these observations allow us to determine an apparent linear expansion rate for the dust shell of 0.35 ± 0.03 mas day−1 and the approximate time of ejection of the matter in which dust formed as t
e jec= 10.5 ± 7d, i.e. close to the maximum brightness. This information, combined with the expansion velocity of 500±100km.s−1, implies a distance estimate of 1.6±0.4kpc. The sparse uv coverage does not allow to get clear indications of deviation from spherical symmetry. The dust envelope parameters were determined. The dust mass generated was typically 2-8 10−9M
⊙day−1, with a probable peak in production at about 20 days after the detection of dust and another peak shortly after t=110d, when the amount of dust in the shell was estimated as 2.2 10−7M
⊙. Considering that the dust forming event lasted at least 200-250d, the mass of the ejected material is likely to have exceeded 10−4M
⊙. The conditions for the formation of multiple shells of dust are also discussed.
Key words. Techniques: interferometric; Techniques: high angular resolution; (Stars:) novae, cataclysmic variables;individual: V1280 Sco; Stars: circumstellar matter; Stars: mass-loss
1. Introduction
Infrared observations of classical novae have established that dust grains can condense in the harsh environment formed in the ejecta generated by thermonuclear runaways on the surfaces of white dwarfs in close binary systems (Gehrz, 1988; Gehrz et al., 1998). The formation and evolution of dust grains, follow-ing a nova outburst, remains a difficult problem both from the observational and the theoretical point of view. The typical light curve during dust formation shows a deep minimum lasting for months; the observed timescale for dust formation is short - typ-ically of the order of 1-20 days - indicating an efficient process of dust formation. Most dust-forming novae condense amor-phous carbon which produces a featureless gray body or
black-Send offprint requests to: O. Chesneau
⋆ Based on observations made with the Very Large Telescope Interferometer at Paranal Observatory under programs 278.D-5053, 279.D-5014 and 079.D-0415
body spectral energy distribution (SED). These appear to re-sult from thermonuclear runaways on low-mass, carbon-oxygen (CO) WDs that tend to eject more mass under less energetic con-ditions than novae on oxygen-neon-magnesium (ONeMg) WDs (Schwarz et al. 1997, 2001, 2007, Rudy et al. 2003). V705 Cas (Nova Cas 1993) was probably to date the best studied case showing such a phenomenon (Gehrz et al., 1995; Evans et al., 1996, 2005).
The recent application of optical interferometers to the study of nova eruptions, not only provide information on the diame-ter and the shape of the ejecta (Quirrenbach et al., 1993; Lane et al., 2007b), but also on the physical processes at work. The state of the art facility of the VLTI, both in terms of infrastruc-ture and management of the observations, allows one to sched-ule fast evolving novae observations (Sch ¨oller et al., 2006). A snapshot of the early phase of the outburst (t=5.5d) of the fa-mous recurrent nova RS Oph was caught by AMBER, the near-IR VLTI recombiner, allowing to reveal the complex geometry
and kinematics of the ejection studied at a spectral resolution of 1500 (Chesneau et al., 2007). Monnier et al. (2006) and Lane et al. (2007a) reported on the monitoring of the RS Oph outburst using several near-IR optical interferometers during two months following the 2006 outburst. These observations allowed them to follow the expansion of the source and give some estimates of the free-free emission from the nova wind. RS Oph was also ob-served in the N band with the Keck Interferometer Nuller ∼3.8 days after discovery that provided evidence that some nebular lines and hot dust were present outside the obscured area, i.e.
before the arrival of the blast wave of the outburst (Barry et al.,
2008).
V1280 Sco was discovered in outburst by Yamaoka et al. (2007) on February 04.86 2007, about 12 days before reaching its maximum in visual light (mV ∼4). This climb to maximum
is exceptionally slow, and the nova also exhibited an unusual characteristic by forming dust as soon as two weeks after maxi-mum. The first description of its infrared spectrum can be found in Rudy et al. (2007). Das et al. (2007) report near-infrared JHK spectroscopy of V1280 Sco, obtained with the Mt. Abu 1.2-m telescope displaying several strong C I emission lines. Further spectra, obtained on Mar. 4.95 UT showed a sharply rising con-tinuum in the J, H, and K bands, indicating dust formation in the nova ejecta, a few days after a clear change is seen in the slope of the visual light curve.
We report on the first infrared interferometry observations ever recorded of a dust forming nova, providing a unique set of spectra and visibilities obtained during the first 145 days of the eruption of V1280 Sco. It was initially planned to exclusively use the VLTI/AMBER near-IR combiner, but as the nova contin-ued producing dust at a high rate, most of the observations were shifted to the VLTI/MIDI mid-IR combiner. We were able to fol-low the expansion of the dust shell for more than one hundred days and to detect the appearance of a new shell. This allows us to constrain simultaneously the extension and content of the newly formed dust by means of simple geometric models and also by using the public domain DUSTY code (Ivezic et al., 1999; Ivezic & Elitzur, 1997). It must however be emphasized that the parameter space characterizing the dust shells was not exten-sively covered and that the parameters proposed in the present article have to be considered as indicative only pending further detailed investigations. The outline of the paper is as follows: in Section 2 we present the analysis of the interferometric and spectroscopic data, in Section 3 we present a semi-quantitative interpretation of the event by means of the light curve and asso-ciated classical relations, in Section 4 we analyze the interfero-metric data using simple geointerfero-metrical models and in Section 5 an attempt is made to investigate further the shell parameters using the DUSTY code. Finally, we discuss in Section 6 some mecha-nisms for dust formation around novae that are able to account for observed the multiple shell behavior; the conclusions are pre-sented in Section 7.
2. Observations
2.1. A complex light curve
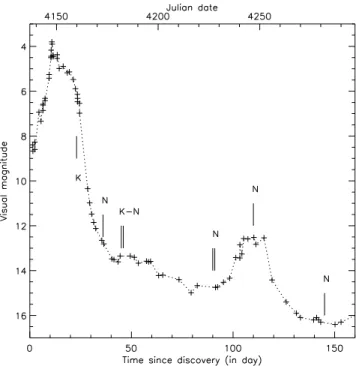
Once a nova has been discovered, its light curve provided mostly by amateur observations, is the first measurement used to in-fer about the nature of the event. The light curve of V1280 Sco, characterized by some interesting features, is shown in Fig.1. This curve was extracted from the AFOEV database, operated at CDS1. The first notable feature is the slow rise to visual
max-1 http://cdsweb.u-strasbg.fr/cgi-bin/afoevList?sco/v1280
Fig. 1. The visual light curve of V1280 sco from AFOEV data
with the dates of the present VLTI observations superposed on it. The time for the light curve to drop by 2 magnitudes, t2, seems to
occur after the beginning of dust formation which is suggested by the sharp change in slope of the light curve.
imum lasting about 12 days since the discovery was reported. Very few novae have exhibited such long premaximum behavior which is generally found only in slow novae. The maximum of visual light on the 16th of February is characterized by a sharp rise from the 5th to the maximum magnitude mv ∼3.8. This
is followed by a smoother decline lasting less than 10 days, in-terrupted abruptly by the dust formation event. The source faded over the next few days from 7th to the 12th magnitude, then con-tinued to fade at a lower rate to reach and stabilize at 15th magni-tude between t=80 and t=90 days (2007-04-27/2007-05-06). A second maximum occurred, peaking near t=104d (2007-05-20) with a magnitude mV= 12.5 followed again by a sharp decline
to the 16th magnitude. The sequence of our observations is as follows. The first AMBER observations were performed on the 28th of February, while the nova had not yet formed dust. The next observations, originally planned with AMBER, were car-ried out on the 13th of March with MIDI as it appeared that dust was forming at a high rate. The first MIDI observations were successfully performed with the 1.8m Auxiliary Telescopes (ATs) on the 13th of March. These observations were difficult to reduce because the N band flux of V1280 Sco of 15-20Jy was close to the MIDI sensitivity limit. Only the visibility mea-surement performed at the lower airmass (∼1.1) could be sci-entifically used, the two other measurements having error bars that are too large. On the 22nd of March, AMBER observations with 2 ATs were performed followed by MIDI observations on 23rd March. In May, the visual flux dropped below the sensitiv-ity limit of mV= 13.5, which is required to acquire the source
on the ATs. Therefore, the observations were then conducted us-ing the 8.2m Unit Telescopes (UTs) although the source was at this epoch even brighter in the N band, rising to mN= -1.5 on
Table 1. Observing log reporting the interferometric observations used in the paper. In the column UTC Date are reported the date
and hour of observation in the format year-month-day-T-hour. In the column Base are reported the different telescopes and stations used: the 8.2m fixed unit telescopes are labeled with U and the number of the telescope; the stations of the movable auxiliary telescopes are labeled with the letters A, G, H and K and a number. The reader can have an overview of the array in the following link: http://www.eso.org/observing/etc/doc/vlti/baseline/vltisations.html.
Julian Day 2007 UTC Date Day1 Instrument Magnitude Telescope Projected baseline Airmass Closest
stations Length PA Calibrator2
[meter] [degrees] 2454160.4 2007-02-28T09 23 AMBER(K) 3.8 (K) G1 - H0 71 175 1.14 HD151680 2454173.3 2007-03-13T08 36 MIDI(N) 1 (N) G0 - K0 60.2 53 1.10 HD150798 2454181.3 2007-03-22T07 45 AMBER(K) 4.2 (K) G0 - H0 29.0 46 1.21 HD149447 2454182.4 2007-03-23T08 46 MIDI(N) 0.3 (N) A0 - G0 62.7 61 1.04 HD150798 2454182.4 2007-03-23T09 46 MIDI(N) 0.3 (N) A0 - G0 63.9 67 1.01 HD150798 2454226.7 2007-05-06T05 90 MIDI(N) -0.8 (N) U3 - U4 60.1 102 1.04 HD163376 2454226.9 2007-05-06T09 90 MIDI(N) -0.8 (N) U3 - U4 57.9 132 1.18 HD163376 2454227.8 2007-05-07T08 91 MIDI(N) -0.8 (N) U3 - U4 59.3 128 1.11 HD163376 2454246.5 2007-05-26T01 110 MIDI(N) -1.5 (N) U3 - U4 35.0 75 1.69 HD163376 2454281.5 2007-06-30T00 145 MIDI(N) -1.1 (N) U3 - U4 52.8 93 1.17 HD123139 2454281.7 2007-06-30T05 145 MIDI(N) -1.1 (N) U3 - U4 58.7 129 1.15 HD163376 2454281.8 2007-06-30T07 145 MIDI(N) -1.1 (N) U3 - U4 49.5 166 2.07 HD177716
1From discovery, Feb. 4.85 UT. JD=2454136.85
2HD151680 (K2.5III, 5.83±0.06), HD150798 (K2III, 8.76±0.12), HD149447 (K6III, 4.55±0.05), HD163376 (M0III, 3.79±0.12), HD123139 (K0III, 5.12±0.02), HD177716 (K1III, 3.72±0.07)
some crucial moments during the evolution of the nova. The first K band observations were made at t=23d (2007-02-28) just be-fore the dust formation event, while the subsequent observations cover the evolution from t=36d (2007-03-13) to the minimum light at t=90d (2007-05-06). One observation was recorded near the top of the second maximum at t=110d (2007-05-26) while the last observations at t=145d (2007-06-30) cover the second deep minimum.
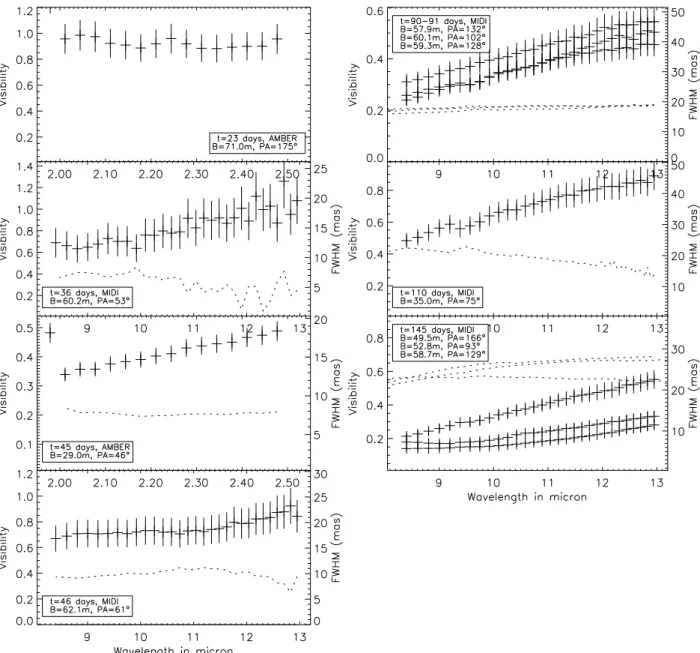
The sequence of VLTI observations is described in Table 1. We used the VLT Unit Telescopes (8.2m, UTs), whose sta-tions are labeled U2, U3 or U4 in the table and the Auxiliary Telescopes (1.8m, ATs), which were located at stations A0, G0, G1, H0, K0. The spectrally dispersed visibilities are shown in Fig.2
2.2. AMBER data
The AMBER data were recorded using the combination of 2 telescopes only, as the three telescope mode was difficult to orga-nize and operate under conditions with a sense of urgency need-ing observations to be planned at short notice2. For the same
rea-sons, the data were secured using the lowest spectral resolution (λ/δλ=35). The AMBER data were reduced using the amdlib software developed by the AMBER consortium following the scheme described by Tatulli et al. (2007). The squared visibility estimator is computed from the basic observables coming from the used algorithm: the coherent flux (i.e. complex visibilities obtained frame by frame multiplied by the flux) and the esti-mated fluxes from each telescope.
These low resolution data were reduced applying the ’stan-dard’ AMBER data reduction recipes i.e. selecting files where the optical path difference measurement does not exceed half the coherence length (λ2/δλ) and then applying frame selection,
re-jecting 80% of the ’bad’ frames, according to the fringe contrast SNR measurement (as explained in Millour et al. 2007). Only one calibration star was observed for each night, HD 151680
2 For instance, without having accurately set the Optical Path Delay model for the new baselines by several observations of the calibrators.
(K3III, 5.93±0.06mas) and HD 149447 (K6III, 4.55±0.05mas) for t=23d and t=45d respectively. In this context, accounting for the error bars and systematics is not straightforward. Therefore we consider a conservative value of 10% for the relative accu-racy on V2, much larger than the one we can get from internal
dispersion of the squared visibilities (4% for the first dataset and 2.5% for the second). On other closeby nights, the transfer func-tion scatter is of the order of 10% rms (i.e. 0.1 for a transfer function of 1 and 0.05 for a transfer function of 0.5).
The calibrated visibility of V1280 Sco on the 28 Feb. is very close to 1, meaning that the object is unresolved within the large error bar estimates. The same comment applies to the night of 22 Mar. 2007, but as the calibration star is smaller and the vis-ibility of V1280 Sco is also smaller, the resulting error bar and systematics are less prominent.
We tried to estimate whether the first K band AMBER data were exhibiting some evidence of a rising dust continuum by performing a (crude) flux calibration using the interferometric calibrators as flux standards. The 28 Feb spectrum shows clus-ters of emission lines, not resolved with the low spectral resolu-tion mode, and a decreasing continuum towards longer wave-length. The spectrum taken 22 days after discovery is much smoother and a significant increase of flux toward long wave-lengths is observed.
2.3. MIDI data
The VLTI/MIDI interferometer operates like a classical Michelson interferometer to combine the mid-IR light (N band, 7.5-13.5µm) from two UTs or two ATs. We used a typical MIDI observing sequence, as described in Ratzka et al. (2007), that is briefly summarized here. Chopped acquisition images are recorded (f=2Hz, 2000 frames, 4 ms per frame, 98mas per pixel) for the fine acquisition of the target. The beam combiner and the dispersion unit are then introduced in the optical path and the interference pattern scanned by means of a temporal modula-tion of path by a reflective device mounted on a piezo motor. The lower spectral resolution provided by a prism was mostly used providing a spectral dispersion λ/δλ of about 30, but some
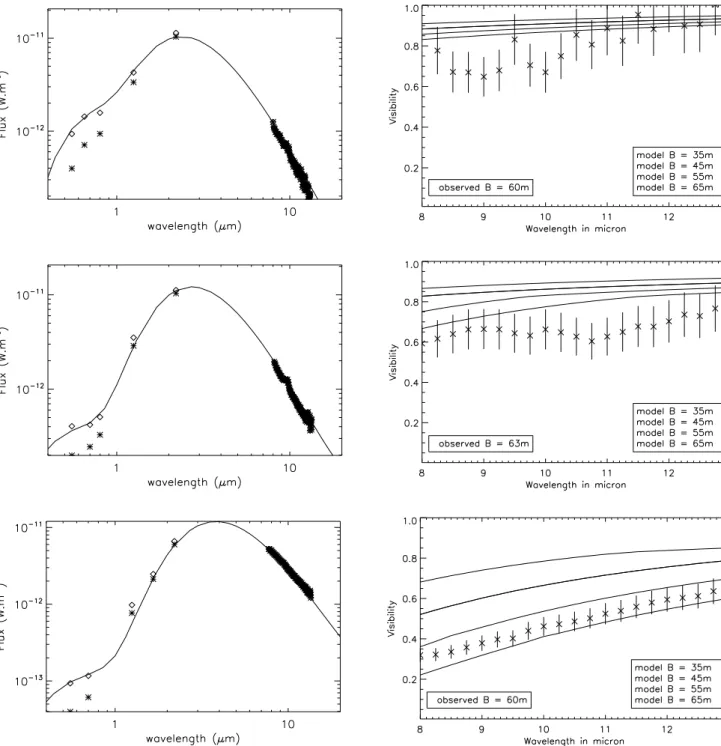
Fig. 2. Full data set of visibilities recorded with MIDI and AMBER, from the earliest dates (top, left) to the latest ones (bottom,
right). The visibilities are indicated by the crosses (left vertical axis), and estimates of the size of the source, using Gaussian models is shown in dotted lines (right vertical axis).
data were recorded with the high spectral mode provided by a grism (λ/δλ=230) although we note that all the data recorded were spectrally featureless. The data reduction softwares3MIA
and EWS were used to reduce the spectra and visibilities. Most of the MIDI observations of V1280 Sco were per-formed in the so-called HIGH SENS mode, meaning that the photometry of each telescope is recorded subsequently to the fringes. The errors, including the internal ones and the ones from the calibrator diameter uncertainty, range from 20% for the first dataset, at the limit of sensitivity of AT telescopes, 10-15% for the AT observations and about 7%-15% for the UT observations. The accuracy of the absolute flux calibration is in the 10-15% in-terval, but the slopes are accurate at the percent level. The fluxes
3 http://www.mpia-hd.mpg.de/MIDISOFT/,
http://www.strw.leidenuniv.nl/∼nevec/MIDI/
are shown in Fig.3, together with the fits to the data using black-body curves indicating their effective temperature.
Accurate differential phase curves could be extracted with EWS from the good quality data recorded on the 6th of May and later on. The curves from V1280 Sco are smooth and domi-nated by atmospheric residuals of the same order as that arising from the calibrators. The corrected differential phase is typically 0◦±5, for each day of observation. These measurements are
in-dicative that the source does not present a strong departure from point symmetry, but does not provide any information on possi-ble departures from spherical geometry (e.g. bipolar geometry). The EWS software removes a large part of the low frequency phase signal, but a strong phase signal from dusty disks can still be detected unambiguously (Deroo et al., 2007).
Fig. 3. From bottom to top, flux calibrated mid-IR spectra
recorded on days 36, 45, 90, 145 and 110. The dashed lines su-perimposed on the maximum flux recorded at day 110 are the fluxes at t=36, 45 and 90 days after scaling. The slopes of the four spectra are similar within error bars indicating an invari-ant temperature for the dust continuum. The t=110 days curve is well fitted by a black-body with T=920K while that for t=145 days exhibits a slightly different slope which is well fitted by a black-body with T=760K. The two fits are indicated in dotted lines.
2.4. Near-Infrared spectroscopy
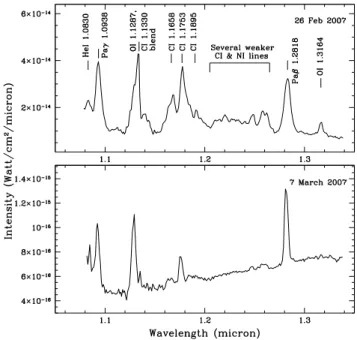
Since its outburst in February 2007, near-infrared JHK observa-tions of V1280 Sco were made on a regular basis from the 1.2m telescope at the Mt. Abu Observatory, India. A detailed presenta-tion of these results is made elsewhere (Das et al., 2008) though an early set of spectra, taken soon after the outburst, is described in Das et al. (2007a) and Das et al. (2007b). In the present work, we show in Fig.4, representative J band spectra of V1280 Sco taken on 26 February 2007 and 7 March 2007. The observations were obtained with the Near Infrared Imager/Spectrometer with a 256x256 HgCdTe NICMOS3 array at a resolution of approx-imately 10 Angstroms/pixel. The J band spectra are typical of a classical nova soon after outburst, showing prominent lines of HI, HeI, OI and CI. The presence of strong neutral CI lines is invoked subsequently (while modeling the dust properties) to be indicative that carbon is the likely principal constituent of the dust that formed around V1280 Sco. The significant change seen in the slope of the continuum, between the two epochs of observations in Fig.4, is also indicative of the formation of dust around this time (this is also manifested by a sharp decline in the optical light curve at approximately this epoch). The later spec-trum of 7 March shows a steepening of the continuum towards longer wavelengths i.e. the building up of an infrared excess which is expected during the onset of dust formation. Several K band spectra, recorded between the 18th of February and the 8th of June, are shown in Das et al. (2008). The 27th of February spectrum exhibits a strong Brγ lines peaking at twice the
contin-Fig. 4. J band spectrum of V1280 Sco on February 26.97 (t=22d,
top panel) and March 7.95, 2007 (t=38d, bottom panel) are shown. The prominent emission lines are marked. The forma-tion of dust between the two epochs is evidenced clearly from the rising of continuum towards longer wavelengths in the later spectrum of 7 March 07, while no dust signature is visible in the first spectrum.
uum level, and few weaker broad lines. The Brγ line is max-imum the 1rst of March, peaking at 3.4 above the continuum and then decreases markedly. The spectrum recorded the 13th of March is almost featureless, dominated by the dust continuum. The first AMBER data were secured the 28th of February, before the starting of the dust formation. The second, secured the 13th of March, probes essentially the dusty shell.
3. Semi-quantitative interpretation
The interferometric observables in the infrared domain provide a new insight on the dust shells formed around the novae that complements the information from the flux calibrated spectra. The modeling of the dust shell involves many parameters, rep-resenting the variable temperature and brightness of the source, the nature of the dust and the density law in the dust forming region - the visibilities per se do not allow to suppress or resolve all the degeneracies. As a consequence, it becomes necessary to estimate a few parameters using classical relations and velocity estimations in order to use them as a first guess in the fitting process.
3.1. First estimation of the basic parameters: classical relations
Munari et al. (2007a) measured a B magnitude of 4.1 and a V magnitude of 3.79 for V1280 Sco at the time of maximum vi-sual light (the 16th of Feb.). The temperature a few days before maximum was close to a F type star (Yamaoka et al., 2007), and a temperature of 5300K is also mentioned by Rudy et al. (2007). We assume that the temperature at maximum was about T0=7000K. Assuming a B-V∼0/0.3 (for an A or F spectral type),
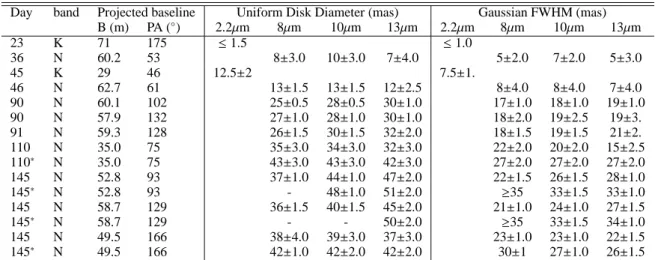
Day band Projected baseline Uniform Disk Diameter (mas) Gaussian FWHM (mas) B (m) PA (◦ ) 2.2µm 8µm 10µm 13µm 2.2µm 8µm 10µm 13µm 23 K 71 175 ≤1.5 ≤1.0 36 N 60.2 53 8±3.0 10±3.0 7±4.0 5±2.0 7±2.0 5±3.0 45 K 29 46 12.5±2 7.5±1. 46 N 62.7 61 13±1.5 13±1.5 12±2.5 8±4.0 8±4.0 7±4.0 90 N 60.1 102 25±0.5 28±0.5 30±1.0 17±1.0 18±1.0 19±1.0 90 N 57.9 132 27±1.0 28±1.0 30±1.0 18±2.0 19±2.5 19±3. 91 N 59.3 128 26±1.5 30±1.5 32±2.0 18±1.5 19±1.5 21±2. 110 N 35.0 75 35±3.0 34±3.0 32±3.0 22±2.0 20±2.0 15±2.5 110∗ N 35.0 75 43±3.0 43±3.0 42±3.0 27±2.0 27±2.0 27±2.0 145 N 52.8 93 37±1.0 44±1.0 47±2.0 22±1.5 26±1.5 28±1.0 145∗ N 52.8 93 - 48±1.0 51±2.0 ≥35 33±1.5 33±1.0 145 N 58.7 129 36±1.5 40±1.5 45±2.0 21±1.0 24±1.0 27±1.5 145∗ N 58.7 129 - - 50±2.0 ≥35 33±1.5 34±1.0 145 N 49.5 166 38±4.0 39±3.0 37±3.0 23±1.0 23±1.0 22±1.5 145∗ N 49.5 166 42±1.0 42±2.0 42±2.0 30±1 27±1.0 26±1.5
Table 2. Results from the conversion of the MIDI visibilities by means of geometric models. The quoted errors are at the 1σ level.
The lines indicated by an asterix, close to the data, present the extension of the model wherein we assume an additional unresolved source representing 10% of the total flux at t=110d and 15% at t=145d (keeping in mind that the total flux from the unresolved source is a lower estimate of the true flux of the appearing compact source). For further details please see the text.
we can estimate E(B-V) to 0.3 or slightly less, and AV to
0.9-1.1. As a cross-check, the galactic extinction law from Marshall et al. (2006), provides a K absorption coefficient AK=0.107 to
0.127 between 1 and 8kpc, scaling to AV=1.2-1.4 (assuming
AV/AK=11).
One can use the relationship between absolute magnitude and rate of decline (the so-called MMRD relations, della Valle & Livio (1995)) for getting an estimate of the absolute magnitude and the distance of the source. The estimation of the t2and t3
val-ues i.e. the time the nova took to fade by 2 and by 3 magnitudes respectively, gets complicated because of the sudden drop in the light curves that interrupted the regular fading trend as a conse-quence of the fast formation of dust. If we ignore dust formation and extrapolate the light curve to see when 2 magnitudes of fad-ing occurs, then 21 days appears as an appropriate estimate. For Av = 1.2, the MMRD relations yield D = 1.3 kpc for t2=21 days
and D = 1.7 kpc for t2 = 13 days, the shortest estimate allowed
by the dust forming event. Also, two rates of decline can be ex-tracted: one applicable from t=11d (maximum light) to t∼16d, with a fast decline of 0.24mag/day, and a much slower from this point to t∼21d, of less than 0.1 mag/day. The curve trend is then abruptly changed by the dust forming event.
In Naito & Narusawa (2007), the FWHM of the Hα emission on Feb. 5.87 UT is 400 km.s−1, and its absorption minimum is blueshifted by 480 km.s−1from the emission peak. Low
resolu-tion spectra obtained on Feb. 12.88 and 14.83 UT (Yamaoka et al., 2007) show Balmer lines with clear P-Cyg profiles and an expansion velocity of about 500 km.s−1. Munari et al. (2007a)
report that, on an average, the displacement of the P-Cyg ab-sorptions from the emission components is 595 km.s−1. The Brγ
line also showed during the initial days a marked P Cygni profile centered at about 575 km.s−1(Das et al., 2008). Thus, for the
es-timation of the size of the ejecta, we will adopt a velocity value of 500±100km.s−1.
4. Fitting the interferometric data with geometric models
In this section, we interpret the visibility curves via simple geo-metric models assuming a uniformly distributed or Gaussian-like
radially symmetric flux distribution. Table 2 displays the results of the fits at some chosen wavelengths.
4.1. The dust formation event
Before the dust formation event, the K band continuum is ex-pected to be dominated by free-free emission from the nova wind (Gehrz, 1988). We have a single K band visibility curve with AMBER at t=23d using two telescopes that tightly constrains the pseudo-photosphere size before or near the dust formation event. The K band visibility is 0.96±0.12 and the projected baseline is 71m. This implies a compact source that is unresolved given our large error bar at this date and a typical diameter smaller than approximately 1mas. This upper limit translates to a linear size of 1-2AU respectively for a corresponding distance value of 1-2 kpc.
The AMBER spectrum does not show any rising continuum on this date in line with the Mt Abu spectroscopic observations recorded two days earlier, as can be seen in Fig.4, although a small contribution from an optically thin, already extended dust shell in formation cannot be excluded at this date. We note also that the limited spectral resolution does not allow us to isolate the emission lines that are still observable at that stage of the outburst (see Fig.4), albeit with a weak impact (contribution of a few percents).
Rapidly, the dust forms a dust shell optically thick from the visible to the N band, and a uniform disk is a good first approxi-mation for the source (see 5). The MIDI visibilities on day 36 are relatively inaccurate, followed on day 46 by better constrained observations, in close agreement with the AMBER observations. On day 90, the MIDI spectrally dispersed visibilities seem better fit by a Gaussian model than by a uniform disk, although it is difficult to disentangle between these models given the accuracy of the measurements.
On t=110 day, a difficulty arises in interpreting the 35m base-line visibility curve which exhibits a slope that departs signif-icantly from a uniform disk or Gaussian model. In an attempt to solve this issue, we interpret this effect by introducing a new unresolved component representing about 10-15% of the flux. The residual of the curve is well fitted with a Gaussian with a FWHM of 27mas or a uniform disk of 43mas. This hypothesis is
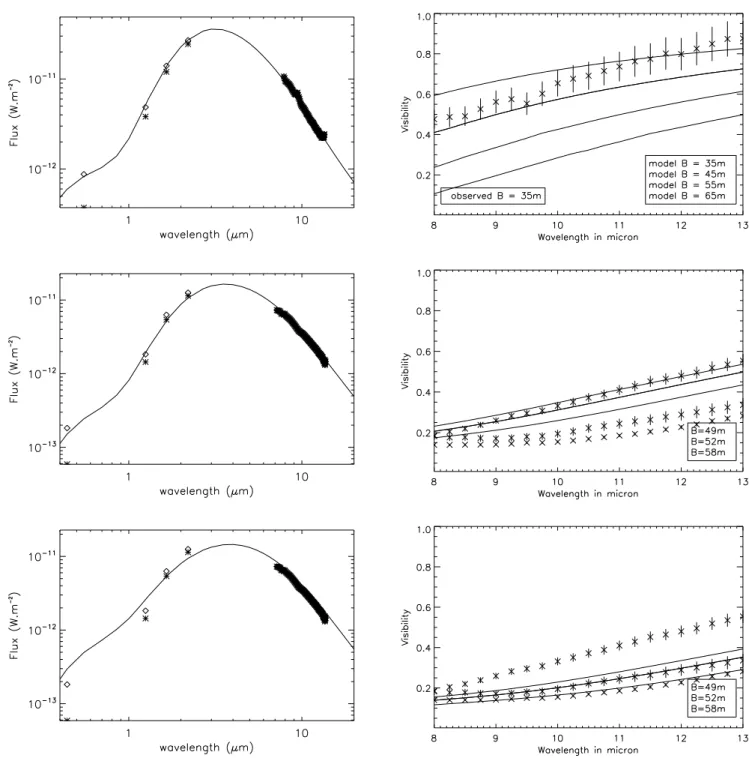
Fig. 6. From top to bottom, SEDs at left and visibilities on right recorded at day 36, 45 and 90 compared to the DUSTY models with
parameters described in Table.3. The SEDs are dereddened, assuming AV=0.9, changing the observed fluxes (stars) to the corrected
ones (squares).
validated in view of the three visibility curves secured at t=145d (see Fig.6) with baselines ranging from 49m to 59m. At this date the shell should be as extended as ∼50mas, and with these base-lines, the shell should be almost fully resolved. One can see that the three curves are not at the low level expected and converge to a level of V ∼ 0.15 at 8µm. From this level, and the slight differences between the visibilities from the different baselines (lower than error bars though), we can infer the presence of a new compact component of FWHM=13-17mas, contributing to ∼10-20% of the N band flux. An alternative interpretation of the t=110d single visibility curve would be possible, but the
pres-ence of a new dust shell is established beyond any doubt from the t=145d data.
4.2. The shell expansion and distance determination
From the angular diameters provided in Table 2, one can infer the expansion rate of the main shell by interpolating the points with a linear expansion curve. This can be done at several chosen wavelengths viz. at 8, 10 and 13µm; each of them is subject to slightly different errors and bias. The first observations at t=36d are very noisy and the observations at t=110d and t=145d suf-fer from contamination intoduced by the presence of the second
Fig. 7. Same as in Fig.6 for days 110 and 145. At these dates the presence of a second shell is suspected, and indeed no synthetic
visibility curves are found to agree within the full N band spectral range with the high SNR data. The last model is an alternative using a different power law dependence for the density distribution i.e. r−1.1and not r−2.as for the other models. For further details
see the text.
shell that has to be carefully taken into account. This leads to a large uncertainty of the curves. We have tested three meth-ods for determining the linear fit of the expansion rate based on three sets of data. The first one considers only the data points taken before t=110d in order to avoid the points affected by the appearance of the second shell. The second set includes all the visibility measurements, assuming simple uniform disk models, while the third data set uses the diameters of the main shell cor-rected for the presence of a compact source (indicated with an asterix in Table 2). The curves based on the second set show that the time of ejection is much before the discovery of the outburst:
this is unrealistic and shows that the data recorded at t=110d and t=145d must be corrected for the presence of a compact ad-ditional component. At 13µm, the curves based on the first data, and on the full corrected dataset agree fairly well, while at 8µm, there is a large discrepancy. This difficulty is related to the large error bars on the first measurement at t=36d.
The first conclusion is that the probable time of ejection is closer to the maximum of brightness than the date of discov-ery, with a computed mean date of te jec = 10.5 ± 7d for the
zero crossing of the expansion curve. The mean expansion rate is determined with an accuracy better than 10% at 0.35 ± 0.03
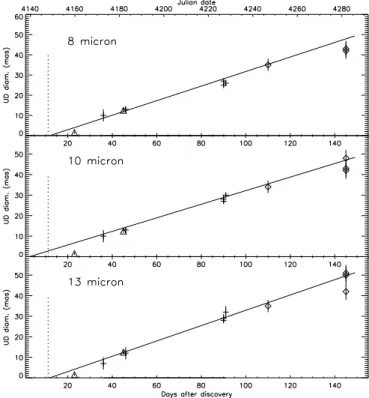
Fig. 5. Uniform disk (UD) diameters at 8µm (top), 10µm and
13µm (bottom) as a function of time, together with the best poly-nomial fits of a linear expansion model. The time of maximum light (t=11d) is shown as a dotted vertical line. The points are directly inferred from the visibilities using simple UD models (crosses), while the squares, representing the diameters mea-sured after t=110d are corrected from the presence of a compact, unresolved source. Taking this correction into account (and its potentially large associated error), one can see that the first dust shell originates from material launched a few days before the maximum light. The AMBER measurements at t=23d and t=45d are shown as triangles (these points are not included in the fitting process).
mas day−1. As often reported, the main source of error for the distance determination comes from estimates of the dust shell velocity. The distance inferred from the expansion, assuming a velocity of the dust shell of 500±100km.s−1is 1.6±0.4kpc. This value is in rough agreement with the estimates based on the MM RD relations.
4.3. Testing the spherical symmetry hypothesis
The resolved remnants of novae ejecta yield clues that nova shells often depart from spherical symmetry. This may point ei-ther to the fact that the eruption is intrinsically not spherically symmetric or that these large scale observations probe the in-teraction of the shell with its nearby interstellar environment. Recently, the spatially resolved observations the recurrent nova RS Oph have shown that the ejection was highly asymmetric, rapidly forming a nebula characterized by two prominent lobes and a dense equatorial waist (Bode et al., 2007; Chesneau et al., 2007; O’Brien et al., 2006). This spatial complexity was visible from the very beginning of the outburst (Chesneau et al., 2007). The sparse and time diluted VLTI observations provide lit-tle information on the shape of the source. No simultaneous use of three telescope was possible preventing closure phase spectra
to be recorded. None of the 12 MIDI differential phases departs significantly from zero, with an error bar lower than 5◦. This eliminates some geometries such as a binary signal with moder-ate flux ratio but does not provide any constraint on the shape of a centrally-symmetric flux source. The last set of visibili-ties recorded at t=145d provide an indication of departure from sphericity that seems significant with regards to the error bars. Three baselines were used, covering about 75◦with similar
pro-jected lengths. The baselines at PA=93◦and 129◦ can be fitted with the same double shell model, while another set of param-eters, involving a smaller shell is necessary to explain the level of the baseline at PA=166◦. However, a strong offset of this
vis-ibility curve is possible considering that this point was recorded at the end of the night with an airmass of 2 and in HIGH SENS mode (i.e with separated photometry), while the other two ob-servations records were performed using the SCI PHOT mode (i.e. with simultaneous photometry).
In conclusion, the hypothesis that the ejection might have been aspherical is not constrained by the VLTI data and in ab-sence of further information a spherical geometry will be con-sidered. As a consequence, it is not possible to apply the correc-tions proposed in Wade et al. (2000) for taking into account the asphericity of the source in the computation of the distance.
5. Fitting the data with
DUSTY
modelsThe use of uniform or Gaussian disks models has to be justified by a more physical model of the expanding dust shell. Uniform disks are probably the most appropriate to describe the optically thick dust shell, while the Gaussian distribution may fit better the latest stages when the shell dilutes and become optically thin. In this section we try to infer the parameters of the dust shell by using a spherical radiative transfer code.
DUSTYis a public domain simulation code solving the prob-lem of radiation transport in a circumstellar dusty environment by analytically integrating the radiative transfer equation in plane-parallel or spherical geometries (Ivezic et al., 1999; Ivezic & Elitzur, 1997). The code utilizes the self-similarity and scal-ing relation of the radiatively heated dust so that the shell is ef-ficiently characterized by its optical depth. This means that ab-solute values (e.g. luminosity and dust shell dimensions) are not uniquely determined by the transfer problem and must be in-ferred by external constraints - in our case, the recorded MIDI visibilities and spectra. The synthetic spectrally-dispersed visi-bility profiles throughout the N band (7.5-13µm) are generated using a set of 20 wavelengths and compared with the MIDI visi-bilities for each baselines. At t=45-46d, the 2.2µm K band wave-length is also included to account for the AMBER measurement. Some assumptions are implied for the numerical simulations with DUSTY:
– Spherical symmetry. This point is weakly constrained by our
observations as discussed in Sect.4.3.
– The dust shell is homogeneous (i.e. not clumpy).
– The source is point-like as viewed from the shell. This
as-sumption is probably hardly validated in reality, since the central source in the first moments of the outburst is a pseudo-photosphere surrounded by the screen of the ejected material, in which molecules and dust can form. This as-sumption is even more restrictive when considering the ef-fect of a complex density structure (i.e. multiple shells) in the emerging SED and visibilities (see Discussion).
– the temperature and the spectrum of the source is constrained
models, but free-free curves provided much better quality fits (see following section).
– the dust is made of amorphous carbon. There is no other real
option in absence of dust features in the MIDI spectra. The near-IR spectra exhibited some carbon lines suggestive of a CO nova (Das et al., 2007) that disappeared rapidly to be replaced by a featureless continuum.
– The grain size distribution follows the classical MRN
(Mathis, Rumpl & Nordsieck, 1977) relation: n(a) ∝
a−qfor a
min ≤ a ≤ amax. Only q was considered as
free parameter during the fitting process, while the values
amin=0.03µm and amax=3µm are kept fixed.
– the thickness of the dust shell (Rout/Rin) is mainly
con-strained by the visibilities. Inside this shell the density fol-lows a r−2 distribution as in a steady-state wind with
con-stant velocity. We performed many tests and the effects of changing the power of the density are difficult to evaluate: the effect is small for a thin shell and is relatively large for the latest stages.
5.1. Simulating a single shell
The parameters able to provide satisfactory fits to the data are shown in Table.2. The most complete set of observations was obtained at t=45-46d for which we have, in addition to the JHK photometry, both MIDI and AMBER observations yielding sim-ilar estimates of the shell size in K and N bands. This is a strong indication that the dust shell was optically thick and geometri-cally thin at that time.
The information extracted from this limited exercise can be summarized as follow:
– The central source SED must depart strongly from a
black-body. Often, unrealistically low temperatures were required to provide good fits using black-bodies, in line with the com-ments reported for the modeling of other novae using simi-lar SEDs (Harrison et al., 1998)4). Assuming that the
cen-tral source’s radiation is effectively converted into free-free emission appears as a good alternative as the inner zones of the ejecta completely absorb the flux from the hot WD and subsequently emit free-free emission (Gehrz, 1988). Indeed, free-free spectra significantly improved the quality of the fits. The temperature associated with free-free spectra ranges between 7500 to 10000K. This corresponds to the tempera-tures associated with regions which are ionized by hot cen-tral sources, like HII regions, planetary nebulae, Be star disks in which the gas temperature is usually close to 10,000K (see Banerjee et al. 2001). Similar quality fits are obtained when changing from a low temperature source SED to a higher one if one increases the optical depth so that the temperature of the source is not well constrained.
– No grain size distributions with values of q above 3 were
able to provide good fits to the SEDs5. This implies that the
distribution of sizes of the grains formed is weighted towards large grains, and this from the very beginning of the obser-vations. We find values of q ∼2.1 for the earliest dates that agrees well with the range found in Evans et al. (2005), but slightly larger values around q ∼3 seem necessary afterward. This suggests that processes decreasing the size of the dust
4 Note that in this paper the authors tried to improve the fits by using two blackbody curves at 9000K and 3000K in an attempt to split the source between the outburst core and its compact vicinity.
5 We do not consider the last model proposed for t=145d as a viable solution
grains were dominant just after their formation. This behav-ior is opposite to the the one reported in Evans et al. (1997, Fig.8)
– The very first moments of the dust shell formation were
caught by the VLTI interferometer when dust continuously formed. As a consequence, the thickness of the shell (i.e. Y=1+∆r/r) was constantly increasing. However, we note that the SED fitting is not much affected by this parameter Y; some family of solutions being found both for narrow (as low as ∼ 1.05) as for wide values of Y. However, the observed visibilities constrain tightly the values reported in Table.3. These large shell thicknesses are different than the narrow ones encountered for the modeling of a dust shell ob-served a long time after the outburst, whose value is set by the duration of the dust forming event and the internal veloc-ity dispersion of the ejecta.
– It was impossible to find solutions for all dates keeping the
luminosity of the central source unchanged. This is related to several factors: the temperature and SED of the central source are not well constrained at these stages and the lu-minosity in the DUSTY code determines the level of flux, but also the position of the inner radius of the shell. As such, it is an essential ingredient for the fitting of both spectra and visibilities. The difficulties encountered with this parameter illustrate the limits of the model (see Sect.5.4),
– As expected, single shell models have the highest
difficul-ties in accounting for the last visibilidifficul-ties recorded at t=145d although some models surprisingly are able to provide visi-bilities that mimic the plateau observed at the 0.15 level. One has to extend the shell thickness to unrealistically high values of Y which correspond to the outer radii reaching 30-40mas. This model probably bears some resemblance with reality in the sense that the inner radius and its vicinity accounts for the new shell while the outer parts of the shell provides the screening of the first shell.
We also note that the spectral shape of the MIDI visibilities recorded at t=36d and t=46d are not smooth whereas the later visibilities exhibit a behavior more in line with the models. The obvious explanation is that these measurements are very noisy as the source was close to the sensitivity limit of the 1.8m Auxiliary Telescopes. This argument is surely valid for the high visibilities recorded from 10µm to 13µm. Nevertheless, the quality of the data is slightly better in the short wavelength range, and the vis-ibilities recorded at t=36d are lower than expected by the model or by the trend of the expansion curves shown in Fig.5. A phys-ical interpretation can be tentatively proposed, in the form of an additional opacity from molecular bands of various species, that contributes to screen the central source differently depending on the wavelength, although the molecules responsible from such a signal inside carbon rich ejecta are not well defined. It is not possible to state precisely whether this signal is effectively seen here, but this potentiality must be investigated in the future. We also note that the smoothness of the high SNR visibility curves obtained after t=90d provide an upper limit on the clumpiness of the shell although this limit excludes only the presence of a few, bright and mas-scale dust structures in the shell.
5.2. Complex density profiles
From day 110 on, the simple single shell models are no longer able to account for the shape of the visibility curves while being still able to fit the SEDs. Changing the power of the density pro-file for the full shell does not bring any significant improvement,
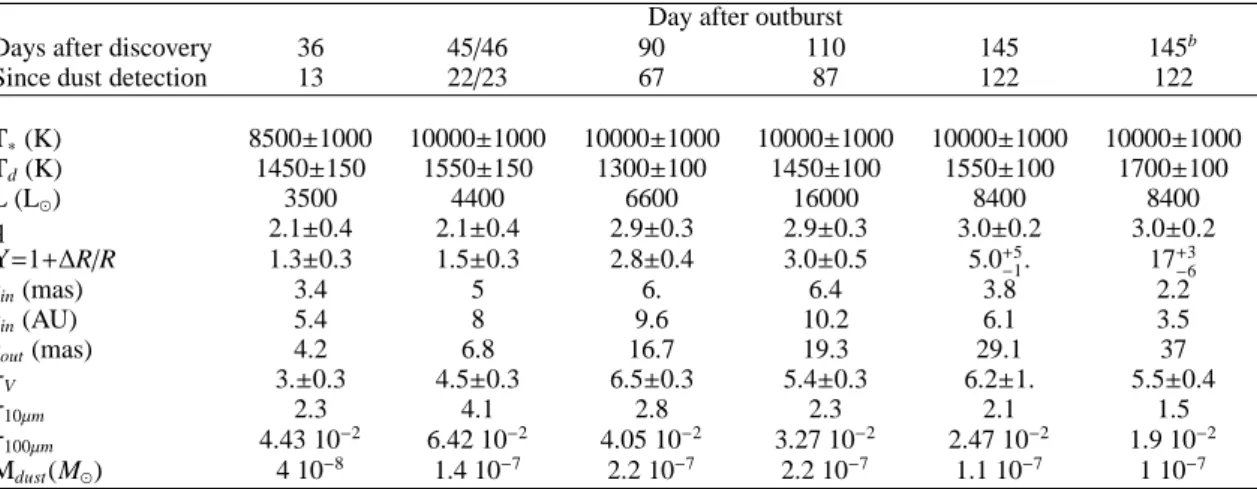
Table 3. Model parameters for V1280 Sco for the different epochs using a single dust shell. The parameters (and in particular the
luminosity) are scaled for a distance of 1.6kpc. A chronology of dust formation based on an approximate date of dust formation (t=23d) estimated from the light curve is also shown. For t=145d, two models are proposed which are indicated by designations 145 and 145b. The second one is more extended and illustrates the degeneracy between models with different shell thicknesses at
this stage which is related to the uncertainties in the velocity of the fastest ejecta (see text for discussion).
Day after outburst
Days after discovery 36 45/46 90 110 145 145b
Since dust detection 13 22/23 67 87 122 122
T∗(K) 8500±1000 10000±1000 10000±1000 10000±1000 10000±1000 10000±1000 Td(K) 1450±150 1550±150 1300±100 1450±100 1550±100 1700±100 L (L⊙) 3500 4400 6600 16000 8400 8400 q 2.1±0.4 2.1±0.4 2.9±0.3 2.9±0.3 3.0±0.2 3.0±0.2 Y=1+∆R/R 1.3±0.3 1.5±0.3 2.8±0.4 3.0±0.5 5.0+5 −1. 17 +3 −6 rin(mas) 3.4 5 6. 6.4 3.8 2.2 rin(AU) 5.4 8 9.6 10.2 6.1 3.5 rout(mas) 4.2 6.8 16.7 19.3 29.1 37 τV 3.±0.3 4.5±0.3 6.5±0.3 5.4±0.3 6.2±1. 5.5±0.4 τ10µm 2.3 4.1 2.8 2.3 2.1 1.5 τ100µm 4.43 10−2 6.42 10−2 4.05 10−2 3.27 10−2 2.47 10−2 1.9 10−2 Mdust(M⊙) 4 10−8 1.4 10−7 2.2 10−7 2.2 10−7 1.1 10−7 1 10−7
although we suspect that the solution may reside in a complex density law that would reflect the variations of the rate of dust formation with time. As shown previously, there is some evi-dence in the latest visibilities recorded that some N band emis-sion originates from more compact regions than the extended shell and we tried to model this by inserting a second shell in the DUSTY code. We first attempted to use a tabulated profile with two discrete shells but this kind of density profiles is not suited for the code. We also tried to assume a monotonic r−2 density profile with density enhancements of the kind used in Bl¨ocker et al. (2001). However, the monotonic density profile dominates the visibilities and the number of new parameters is large. We finally tried a third approach, still far from being self-consistent. The radiative transfer in the second (young) shell is first com-puted, and a SED and the visibilities are stored. The parameters of this shell are poorly constrained. The outcoming flux is then injected into the parameters in a second run in which the first extended shell is included although we stress that DUSTY takes into account only the shape of the injected SED. There is no way to constrain the parameters of this shell but we note that the parameters of the t=36d shell might represent a good approx-imation given the estapprox-imations of the compact source size. The visibilities generated are biased since the extension of the inner shell is not taken into account by the code in the second run, and the flux contribution of the first shell has to be carefully taken into account for computing the flux ratio between the two shells. The last option, used for the t=145d models, was to test differ-ent density profiles from r−3to r−1. A family of approximately
good models can be found and we propose one of them in the last column of Table.3. This example is an extreme case: the ve-locity implied by the extension of the outer radius is about two times the rate inferred from the Uniform Disk models and the temperature is very high. Moreover, the value of q is most prob-ably overestimated as the SED fit is obviously less satisfactory. Nevertheless, it is worth noting that the mass inferred for this shell is in close agreement with the first option. At some point in the evolution of the dust forming nova envelope, it is certain that the Center to Limb Variation (CLV) has evolved in a com-plex manner not accounted for by the simple models presented in this paper. Defining physically a ’second’ shell forming event might be an over-interpretation of the data. Given the amount
of open issues and the number of free parameters involved, the possibilities are almost infinite while the data remains fairly lim-ited. We did not try to investigate this point further - it deserves an extensive study which is not in the scope of the paper. 5.3. Mass of the shell
The DUSTY models can provide a good estimate of the mass of the shell and hence of the dust formation rate during the event. The mass in the circumstellar dust shell was computed for each of the models following the relation for a r−2 power-law dust
density distribution (Sarkar & Sahai, 2006):
Mdust = 4πR2inY(τ100/κ100)
where Rin is the inner radius of the dust shell (see Table 3), Y
is the relative shell thickness (1+∆R/R), τ100is the shell optical
depth at 100µm and κ100is the dust mass absorption coefficient
at 100µm. The value of κ100 depends on the size of the grains,
that varies in our models. We have used the values computed for amorphous carbon, that range between 58cm2g−1 for q=2.1
(mean size 0.006µm) to 66cm2g−1for q=3 (mean size 0.003µm).
One can also get an estimation (with large errors) of the dust formed per day in between each observation. From the first shell modeled, one gets an amount of 3.1 10−9M
⊙ day−1, while
be-tween t=36d and t=45d, it reaches 7.4 10−9M⊙day−1. Between
t=45d and t=110d, the dust formation rate is 1.8 10−9M ⊙day−1,
suggesting the dust forming process slowed down in that time interval, in line with the null forming rate estimated between t=90d and t=110d. Given the uncertainties of the data, the mod-eling and the date when dust began to form, these estimates have to be taken with some caution. The lower amount of mass found at t=145d is also less significant than the other estimates due to the difficulty in finding visibilities that match the spectral shape of the observations. Performing a modeling by means of two dis-tinct shells increases the amount of dust considerably.
It is probable that dust formation continued for several weeks before the rebrightening of the source in October-November 2007 (Munari et al., 2007b). If one takes a mean value of dust forming rate of 5 10−9M⊙day−1, and a canonical gas-to-dust
ra-tio of 150 (but this number can be much larger, see Gehrz (1988)) then a dust shell of 1 10−4M⊙is generated in about 130 days.
V1280 Sco could most probably have ejected a mass of material that exceeds this number during the 200-250 days of the dust shell presence.
5.4. Limitations of the model
The assumptions for a good application of the DUSTY code are not necessarily fulfilled by V1280 Sco. Aspects regarding the symmetry of the source have already been discussed in Sec.4.3. We concentrate here on the hypothesis that the central source is considered as a point. The study of nova V705 Cas (Evans et al., 2005), using the same code, lies well within the limits imposed by this criterion. Nova V705 Cas was observed 250 days after the outburst when the central source was very hot and compact as seen from a detached, spatially and optically thin shell. This is not the case for V1280 Sco in the earliest stages when the dust shell was very close to the central source whose photosphere is relatively cold and extended. The pseudo-photosphere is most probably surrounded by a diffuse free-free emission zone and farther away by a molecular atmosphere close to the dust forming region leading to a complex Center-to-Limb Variation profile. When the dust shell is optically thin, it is trans-parent to some emission coming from the internal regions that are not point-like and can be resolved by the interferometer, and which carry their own budget of correlated flux that is far from being taken into account in our models.
In addition, there is a more fundamental limitation to the use of the DUSTY code for the distance determination. We consider modeling a dust shell in rapid expansion. The central source is supposed to rapidly increase its temperature at constant bolo-metric luminosity. As discussed above, the radius of the shell is not defined in an absolute manner, but by setting a temper-ature for the central source. Intuitively, we could guess that as the shell expands its temperature will steadily decrease, but this is not observed as can be seen in Fig.3. This is the well-known ’isothermal’ behavior described in Evans et al. (2005, see ref-erences there-in) and it directly biases the shell parameters pre-sented in this work. The radius of the dust shell of V705 Cas is found to remain unchanged within the error bars between their epoch 1 (t=253d) and epoch 2 (t=320d) observations, while a 25% increase is expected by the natural expansion of the shell. This is due to the fact that the shell radius in our DUSTY models is set by the shell temperature and luminosity of the source and does not physically account for the dust facing the hot source (in particular any screening from the gas between the source and the dust). This internal inconsistency prevents us from hoping for a more reliable distance estimate using the model as long as the inner radius is not self-consistently determined in the model accounting for the source characteristics, the shell velocity and an accurate density law. We therefore consider the distance es-timates based on the Uniform disk models as the most accurate one.
6. Discussion
6.1. Dust shell expansion rate and distance estimation This is the first time that the dust shell of a classical nova is spa-tially resolved starting from the onset of the shell formation up to the point it becomes close to optically thin. This is a new and promising technique for providing dust-shell expansion rates, and thus distances, for interesting novae that are usually much fainter and almost featureless during the time that the dust shell is optically thick. The present data set can provide a direct
es-timate of the distance to V1280 Sco, a target for which a direct application of the MMRD relations is rendered difficult by the the dust formation event that seem to have occurred before the light curve dropped below the defined thresholds t2and t3.
However, the applicability of such observations must be discussed. The first point, already discussed in 4.3 is that the sphericity of the source is not established from our observa-tions. The second point is that while VLTI monitored the ex-pansion of the dust shell, the velocities used to infer the distance were measured from visible line measurements. It is not sure that these velocity measurements trace the material that formed dust considering the observational evidence that the filling fac-tor of the ejecta can be far from unity (Ederoclite et al., 2006). Gehrz (1988) provide arguments in favor of the use of the deter-mination of expansion parallaxes in the infrared. The dust forms preferentially in the densest regions of the ejecta, and may fol-low a different (sfol-lower) velocity law than the fol-low-density wind itself. Yet, the consistency of the P Cygni absorption positions detected in many lines in optical and near-IR implies that the ve-locity of the dust forming shell is probably well represented by this value, and the error bar quoted in this paper is a conserva-tive estimate. For the velocity of 575 km s−1reported in Das et
al. (2008), the distance scales to ∼1.9kpc. This upper estimate must probably be favored in our interpretation. Thirdly, uniform disks are a good approximation for describing the intensity dis-tribution as long as the shell remains optically thick, but simple models are no longer suitable when the shell grows and the op-tical thickness in the N band gets low. The data recorded when the shell was optically thick are best estimators of the distance despite their lower accuracy.
A distance estimation based on the dust expansion parallax has some advantages compared to that using the expansion of the fireball in the near-IR as reported in Lane et al. (2007b,a). The near-IR methods follows the fireball from its very first mo-ments to the point where the the free-free emission is no longer optically thick. What remains at this stage is a compact, op-tically thick, shrinking source and an extended free-free emit-ting halo, rapidly over resolved by the interferometric technique. Moreover, the time to react to obtain observations has to be fast, especially in the early stages of the outburst. In contrast in the mid-IR, the dust shell dominates the flux for a very long time, and the contribution of the hot core, even though not negligi-ble, has less influence on the result. Nevertheless, the near-IR free-free expansion parallax technique has the advantage of be-ing applicable to all novae and not only the ones that form dust. Our estimate for the time of ejection is subject to some un-certainty, but it seems probable that the material constituting the dust was launched after the beginning of the outburst, near the time of maximum light. It does not mean that material was not ejected earlier to this - onset of the eruption is evidenced by P-Cygni profiles seen almost as early as t0and which lasted at least
for 15 days thereafter: there was indeed a fireball expansion in the early stages. Why did dust not form in these early ejected lay-ers? The temperature of the pseudo-photosphere of the firewall is a key parameter, since it was probably getting colder near and after the peak of visible light. Also, the mass-loss rate was most probably not constant and might have peaked close to the opti-cal maximum: the dust formation rate might directly reflect this, although we can wonder whether the second event occurring at t=110d also reflected a sudden increase of the ejected mass.
6.2. Multiple dust formation events
The modeling using simple spherical shell models does not al-low to clearly conclude on the formation of a second shell from t=110d on, but the light curve and the visibilities recorded at t=145d support this hypothesis. Rawlings & Evans (2002) pro-posed that the stability and hence the ultimate fate of the grains is primarily determined by the degree to which they are annealed by the nova’s ultraviolet radiation field. Shore & Gehrz devel-oped this idea arguing that agglomeration of atoms by dust nu-clei proceeds kinetically through induced dipole reactions in a partially ionized medium. Ionization of a cluster increases once the ejecta become transparent in the ultraviolet which triggers runaway grain growth. We can wonder to which extent this mechanism intervenes in the formation of multiple ’shells’ (i.e. large variations of dust formation rate with time). In the case of V1280 Sco, signs of increase of the optical depth due to dust appears very early in the light curve, implying that, once nu-cleation had occurred, the physical conditions for grains growth (density and thus mass-loss rate and wind speed, temperature of the central source, and perhaps level of soft UV radiations) were optimum. The second shell must also have formed close to the central star and independent of the presence of the first shell. Therefore, its appearance can be considered as independent of the evolution of the first shell. Did the material in between the outbursting source and the dust forming region dilute below a level in which soft UV radiation emerged another time, trigger-ing a new dust nucleation? A more likely hypothesis is an in-crease of the mass-loss rate (for unknown reasons) or perhaps a change to more favorable chemical conditions (Pontefract & Rawlings, 2004) in conjunction with the hardening of the central source flux. If a 10-15mas new shell, due to a sudden increase of mass-loss rate, is observed at t=145d then this material was generated about 35-40 days before the observations (still assum-ing a velocity of 500km.s−1) i.e. around t=110d when the second light maximum occurred. We can then make the hypothesis that this second maximum is not only a consequence of the decrease of the expanding dust optical depth but is also related to an in-crease of the luminosity and mass-loss rate of the central source. One can note in Table.3 that the luminosity required to account for the observed data at t=110d is notably larger than at other epochs.
7. Conclusions
High spatial resolution observations of the very first moments of a nova outburst promise to provide invaluable information on the physical processes operating in the vicinity of the central remnant. The VLTI observations reported here, the first of their kind, show that spectro-interferometric observations can localize accurately the dust forming regions allowing a ’virtual’ in-situ study of the dust forming event.
These observations present interesting information on the dust shell formed around the classical nova V1280 Sco. But they still lack the minimum uv coverage needed to check the spheric-ity of the source. There was scope for the near-IR photometry and spectroscopic data obtained by Das et al. (2008) from this bright source to be complemented by intensive VLTI/AMBER observations. The source was bright enough during the 30 first days to be studied by VLTI with a spectral resolution of 1500 in H and K, providing potentially direct constraints on the spa-tial extent of the line forming regions and their kinematics (such as in Chesneau et al. (2007)). Our relatively recent involvement in this field and inadequate manpower prevented our team from
undertaking these potentially exciting observations - but scope exists for monitoring one or two bright novae per year by this facility. This field, and studies of a similar kind, should greatly benefit from the outcome of 2nd generation instrumentation ef-forts of the VLTI. The mid-IR instrument MATISSE (Lopez et al., 2006) is foreseen to recombine the light from 4 telescopes, providing in one shot six visibility measurements and three clo-sure phases that should provide at one go a detailed view of a dust forming shell.
Acknowledgements. The VLTI staff is warmly thanked for their intensive efforts
in efficiently operating the facility. By constantly communicating the latest ob-servational results to our team, they helped us to plan and understand the obser-vations. This research has made use of the AFOEV database, operated at CDS, France. We also acknowledge with thanks the variable star observations from the AAVSO International Database contributed by observers worldwide. The blog of the KANATA 1.5-m telescope at Higashi-Hiroshima Observatory, Japan has also provided valuable information for the planning and preliminary understanding of our observations. The research work at Physical Research Laboratory is funded by the Department of Space, Government of India.
References
Banerjee, D. P. K., Janardhan, P., & Ashok, N. M. 2001, A&A, 380, L13 Barry, R.K. Danchi, W.C., Traub, W.A. et al. 2008, ArXiv e-prints, 801, arXiv:
0801:4165
Bl¨ocker, T., Balega, Y., Hofmann, K.-H., & Weigelt, G. 2001, A&A, 369, 142 Bode, M.F., Harman, D.J., O’Brien, T.J. et al. 2007, ApJ, 665, L63
Chesneau, O., Nardetto, N., Millour, F. et al. 2007, A&A, 464, 119 Cassatella, A., Lamers, H.J.G.L.M., Rossi, C. et al. 2004, A&A, 420, 571 Das, R.K., Banerjee, D.P.K., Ashok, N.M. and Chesneau, O., 2008, MNRAS,
accepted
Das, R.K., Ashok, N.M., & Banerjee, D.P.K. 2007, Central Bureau Electronic Telegrams, 866, 1
Das, R.K., Ashok, N.M., & Banerjee, D.P.K. 2007, Central Bureau Electronic Telegrams, 864, 1
della Valle, M., & Livio, M. 1995, ApJ, 452, 704
Deroo, P., van Winckel, H., Verhoelst, T. et al. 2007, A&A, 467, 1093 Ederoclite, A., et al. 2006, A&A, 459, 875
Evans, A., Geballe, T.R., Rawlings, J. M. C., & Scott, A. D. 1996, MNRAS, 282, 1049
Evans, A., Geballe, T.R., Rawlings, J.M.C. et al. 1997, MNRAS, 292, 192 Evans, A., Tyne, V.H., Smith, O. et al. 2005, MNRAS, 360, 1483 Gehrz, R. D. 1988, ARA&A, 26, 377
Gehrz, R.D., Greenhouse, M. A., Hayward, T. L. et al. 1995, ApJ, 448, L119 Gehrz, R. D., Truran, J. W., Williams, R. E., & Starrfield, S. 1998, PASP, 110, 3 Harrison, T.E., Johnson, J.J., Mason, P.A., & Stringfellow, G. S. 1998, ASP
Conference Series, 137, 489
Ivezic, Z., Nenkova, M., & Elitzur, M. 1999, ArXiv Astrophysics e-prints, arXiv:astro-ph/9910475
Ivezic, Z., & Elitzur, M. 1997, MNRAS, 287, 799
Lane, B.F., Retter, A., Eisner, J.A., et al. 2007, ApJ, 669, 1150 Lane, B. F., Sokoloski, J.L., Barry, R.K. et al. 2007, ApJ, 658, 520 Lopez, B., Wolf, S., Lagarde, S. et al. 2006, Proc. SPIE, 6268,
Marshall, D. J., Robin, A. C., Reyl´e, C., Schultheis, M., & Picaud, S. 2006, A&A, 453, 635
Mathis J.S., Rumpl W. & Nordsieck K.H. 1977, ApJ, 217, 425 Millour, F., et al. 2007, ArXiv e-prints, 705, arXiv:0705.1636 Monnier, J. D., et al. 2006, ApJ, 647, L127
Munari, U., Siviero, A., Henden, A. et al. 2007, Central Bureau Electronic Telegrams, 1099, 1
Munari, U., Valisa, P., Dalla Via, G., & Dallaporta, S. 2007, Central Bureau Electronic Telegrams, 852, 1
Naito, H., & Narusawa, S. 2007, IAU Circ., 8803, 2
O’Brien, T.J., Bode, M.F., Porcas, R.W. et al. 2006, Nature, 442, 279 Petrov, R. G., Malbet, F., Weigelt, G. et al. 2007, A&A, 464, 1 Pontefract, M., & Rawlings, J.M.C. 2004, MNRAS, 347, 1294
Quirrenbach, A., Elias, N.M., Mozurkewich, D., et al. 1993, AJ, 106, 1118 Rawlings, J. M. C., & Evans, A. 2002, Classical Nova Explosions, 637, 270 Rudy, R.J., Lynch, D. K., Russell, R.W., Woodward, C.E., Liebert, J., & Cushing,
M. 2007, IAU Circ., 8809, 1
Rudy, R.J., Dimpfl, W.L., Lynch, D.K. et al. 2003, ApJ, 596, 1229 Sarkar, G., & Sahai, R. 2006, ApJ, 644, 1171
Sch¨oller, M., et al. 2006, Proc. SPIE, 6268, 19 Shore, S.N., & Gehrz, R. D. 2004, A&A, 417, 695
Tatulli, E., Millour, F., Chelli, A. et al. 2007, A&A, 464, 29 Wade, R. A., Harlow, J. J. B., & Ciardullo, R. 2000, PASP, 112, 614 Yamaoka, H., Fujii, M., & Naito, H. 2007, IAU Circ., 8807, 2
Yamaoka, H., Nakamura, Y., Nakano, S., Sakurai, Y., & Kadota, K. 2007, IAU Circ., 8803, 1