HAL Id: halshs-00565224
https://halshs.archives-ouvertes.fr/halshs-00565224v3
Preprint submitted on 5 Nov 2012
HAL is a multi-disciplinary open access
archive for the deposit and dissemination of sci-entific research documents, whether they are pub-lished or not. The documents may come from teaching and research institutions in France or abroad, or from public or private research centers.
L’archive ouverte pluridisciplinaire HAL, est destinée au dépôt et à la diffusion de documents scientifiques de niveau recherche, publiés ou non, émanant des établissements d’enseignement et de recherche français ou étrangers, des laboratoires publics ou privés.
The missing wealth of nations: Are Europe and the U.S.
net debtors or net creditors?
Gabriel Zucman
To cite this version:
Gabriel Zucman. The missing wealth of nations: Are Europe and the U.S. net debtors or net creditors?. 2012. �halshs-00565224v3�
WORKING PAPER N° 2011 – 07
The missing wealth of nations: Are Europe and the U.S. net debtors
or net creditors?
Gabriel Zucman
JEL Codes: F32, H26, H87
Keywords: Tax havens, International investment positions, Global imbalances
P
ARIS-
JOURDANS
CIENCESE
CONOMIQUES 48, BD JOURDAN – E.N.S. – 75014 PARISTÉL. : 33(0) 1 43 13 63 00 – FAX : 33 (0) 1 43 13 63 10 www.pse.ens.fr
CENTRE NATIONAL DE LA RECHERCHE SCIENTIFIQUE – ECOLE DES HAUTES ETUDES EN SCIENCES SOCIALES
THE MISSING WEALTH OF NATIONS:
ARE EUROPE AND THE U.S. NET DEBTORS OR
NET CREDITORS?
Gabriel Zucman
Paris School of Economics
∗October 25, 2012
†Abstract
This paper shows that official statistics substantially underestimate the net for-eign asset positions of rich countries because they fail to capture most of the assets held by households in offshore tax havens. Drawing on a unique Swiss dataset and exploiting systematic anomalies in countries’ portfolio investment positions, I find that around 8% of the global financial wealth of households is held in tax havens, three-quarters of which goes unrecorded. On the basis of plausible assump-tions, accounting for unrecorded assets turns the eurozone, officially the world’s second largest net debtor, into a net creditor. It also reduces the U.S. net debt significantly. The results shed new light on global imbalances and challenge the widespread view that, after a decade of poor-to-rich capital flows, external assets are now in poor countries and debts in rich countries. I provide concrete proposals to improve international statistics.
Keywords: Tax havens, International investment positions, Global imbalances JEL classifications: F32, H26, H87.
∗A detailed data appendix is available online at http://www.parisschoolofeconomics.eu/en/ zucman-gabriel/. All comments are welcome (zucman@pse.ens.fr).
†I am very grateful to my advisor Thomas Piketty for his continuous support and guidance. I thank the editor (Robert Barro), four anonymous referees, Jean-Edouard Colliard, Mihir Desai, Emmanuel Farhi, Nicolas Frémeaux, Lucie Gadenne, Pierre-Olivier Gourinchas, Philip Lane, Gian Maria Milesi-Ferretti, Richard Sylla, Daniel Waldenström, Edward Wolff, and seminar participants in various places. Paul Farello, Christopher Gohrband, Steve Landefeld, and Robert Yuskavage from the Bureau of Economic Analysis also provided helpful comments. Part of this paper was drafted while I was visiting NYU; I am
I.
Introduction
There are two puzzles in international investment statistics. The first is a set of sta-tistical anomalies. At the global level, liabilities tend to exceed assets: the world as a whole is a net debtor (Lane and Milesi-Ferretti, 2007). Similarly, the global balance of payments shows that more investment income is paid than received each year. Since the problem was identified in the 1970s, the International Monetary Fund has commissioned a number of reports to investigate its causes, and national statistical agencies have put considerable resources into improving their data. Yet despite a great deal of progress, large anomalies remain; many European securities, in particular, have no identifiable owner (Milesi-Ferretti, Strobbe, and Tamirisa, 2010).
The second puzzle is a theoretical challenge. Since the latter half of the 1990s, capital has been flowing from poor to rich countries. As a result, the rich world now appears to be a sizeable net debtor in the official statistics, dragged down by the U.S. and Europe. While the literature has put forward possible explanations for the U.S. net debt and the rise in China’s assets,1 the negative net positions of Europe and the overall rich world
remain largely unexplained. Despite this, many observers have grown accustomed to the view that external assets are now in poor countries and debts in rich countries. In the public debate, the view that “China owns the world” has become particularly popular. Should it be correct, the implications for policymaking and open-economy modeling would be far-reaching.
My paper challenges this view. The negative net foreign asset position of the rich world, I argue, is an illusion caused by tax havens. International statistics fail to capture most of the assets held by households through tax havens: they overlook the portfolios of equities, bonds, and mutual fund shares that households own via banks in Switzerland and other countries with strict bank secrecy rules. This coverage gap explains many of the long-standing anomalies in global data. My computations find that around 8%
1See Dooley, Folkerts-Landau, and Garber (2003), Bernanke (2005), Dollar and Kraay (2006), Engel and Rogers (2006), Caballero, Farhi, and Gourinchas (2008), Mendoza, Rios-Rull, and Quadrini (2009), Carroll and Jeanne (2009), Ma and Haiwen (2009), Obstfeld, Shambaugh, and Taylor (2010), Aguiar and Amador (2011), Song, Storesletten, and Zilibotti (2011), and Alfaro, Kalemli-Ozcan, and Volosovych (2011) among others.
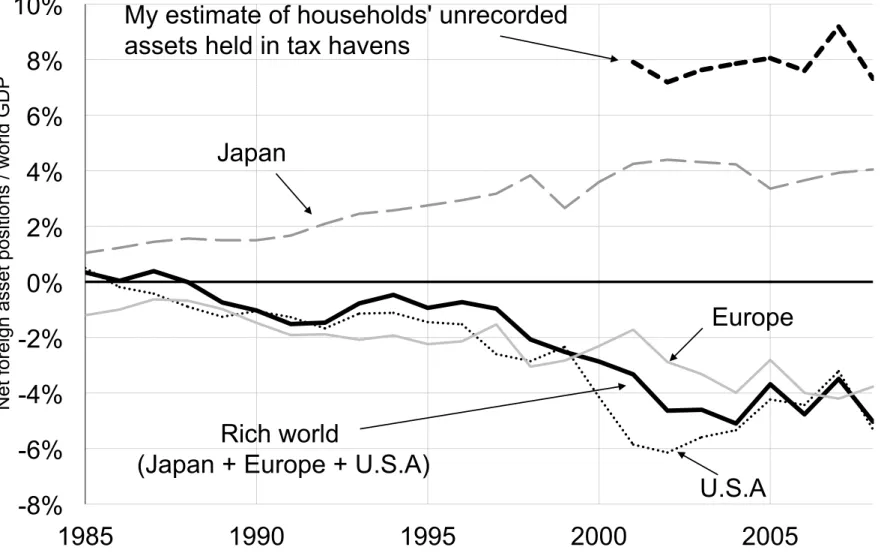
of households’ financial wealth is held through tax havens, three-quarters of which goes unrecorded. This stock of unrecorded assets is double the recorded net debt of the rich world (Figure I). Since a body of evidence suggests that most of the wealth in tax havens belongs to residents of rich countries, accounting for it turns the rich world into a net creditor. Despite a decade of global imbalances, therefore, external wealth is still probably in rich countries overall: China does not own the world yet. Back in the 1980s-1990s the rich world had a large positive net position; over the last decade it has eaten some of its claims away; but today poor countries are still repaying their debts to advanced economies. Taking a global perspective on external positions, the net foreign wealth of the rich world and the poor world seem to converge, as if output convergence went hand in hand with wealth convergence – a plausible yet far from systematic outcome in standard models.
These findings have direct implications for core issues in international macroeco-nomics. On the basis of plausible assumptions, accounting for the wealth in tax havens turns the eurozone, officially the world’s second largest net debtor, into a net creditor. It also improves the U.S. net position. Now, the net foreign asset position is a key state variable in dynamic macroeconomic models. Accurate net positions are essential to assess the merits of the different views put forward on the causes of global imbalances and they are important to monitor financial stability. A large body of literature has questioned the sustainability of global imbalances.2 If indeed the net positions of Europe and the U.S.
are higher than in the official statistics, the required international adjustment is smaller than commonly thought. Domestic imbalances and public finance issues may be more serious today for rich countries than global imbalances: rich countries taken as a whole are richer than we think, but some of their wealthiest residents hide part of their assets in tax havens, which contributes to making governments poor. So far, tax havens have been ignored by the literature that studies the evolution of top income shares around the world (Atkinson, Piketty, and Saez, 2011).3 My findings, therefore, also have implications for
2See Obstfeld and Rogoff (2005), Blanchard, Giavazzi, and Sa (2005), Gourinchas and Rey (2007), the papers in Clarida (2007), Hausmann and Sturzenegger (2007), Curcuru, Dvorak, and Warnock (2008), and Blanchard and Milesi-Ferretti (2009) among others.
this strand of research. My macro-based estimate of the funds held through tax havens could be used as a first step to include these funds into micro-based studies of income and wealth distributions.
The paper proceeds as follows. Section II begins with a brief primer on the activities that take place in tax havens and the statistical issues involved. Section III analyses a previously unused official dataset from the Swiss National Bank. A considerable amount of wealth is held unrecorded in Swiss accounts, and contrary to popular belief, this wealth mostly belongs to residents of rich countries. Section IV then presents a novel method to estimate the wealth in all the world’s tax havens, using anomalies in the aggregate portfolio stock data of countries (the key data source here is Lane and Milesi-Ferretti, 2007). My method is indirect and relies on data with known imperfections, so it is subject to some margin of error. Section V presents consistency and robustness checks, based on bilateral and flow data from the IMF, suggesting that the order of magnitude I find is reliable. The many datasets used in this paper all paint the same picture: households own a large amount of mutual fund shares through unrecorded accounts in tax havens. In Section VI, I propose scenarios as to how including the unrecorded assets in the statistics would affect published international investment positions, and I discuss the implications for global imbalances. The conclusion provides concrete proposals to improve the official data (Section VII). There are numerous intricacies in the financial activities of tax havens and the international statistics. The most important ones are discussed in the paper; the others are detailed in a comprehensive Online Appendix.
II.
Tax Havens and Their Implications for International Statistics
First, let’s look at the basic concepts that will be used throughout the paper. A country’s foreign assets and liabilities are recorded in its international investment position (IIP). The IIP is the stock equivalent of the financial account of the balance of payments: the
payments to approximate capital flight, and Dell, Piketty, and Saez (2007) who use Swiss tax data to put an upper bound on the amount of capital income earned in Switzerland by non-resident taxpayers. Tax data, however, are not an appropriate source in this case, because the bulk of income earned by foreigners in Switzerland does not have to be declared to Swiss tax authorities.
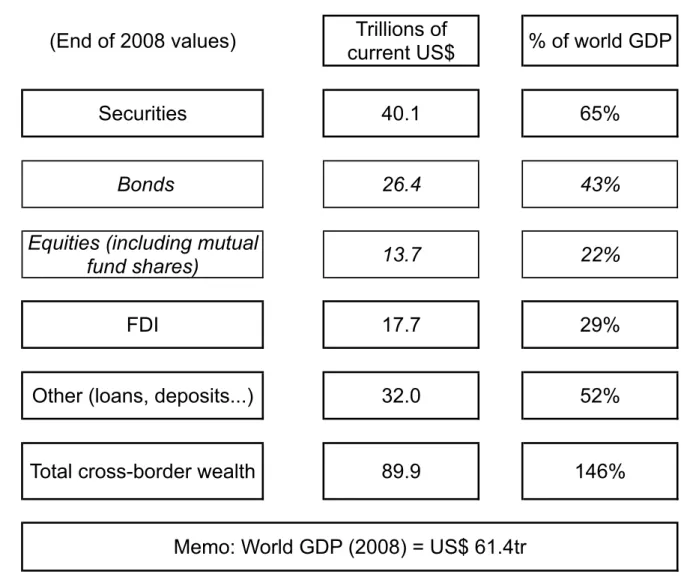
IIP shows the stock of existing cross-border investments at the end of each year, while the balance of payments shows the yearly flow of new investments. There are three broad categories of cross-border investments: direct investments (holdings of over 10%), portfolio securities (equities and bonds that do not qualify as direct investment), and other assets (mainly loans and deposits).4 At the end of 2008, as shown by Table I,
securities were the largest category: they accounted for $40tr out of $90tr.
Tax havens host numerous financial activities. About half of the world’s foreign direct investments are routed through tax havens such as the British Virgin Islands. Many investment funds and financial vehicles are incorporated offshore. Luxembourg is the second largest mutual fund center in the world after the U.S; a great deal of the world’s money market funds are incorporated in Ireland; and most hedge funds are in the Cayman Islands. Multinational corporations routinely use tax havens for treasury operations and group insurance (Bermuda is a leader here). Some of these activities have legitimate roles and are satisfactorily covered in the statistics.5 My paper focuses on one specific tax haven activity: personal wealth management, sometimes known as “private banking”. This activity is present in many but not all tax havens. Leaders include countries with strict bank secrecy rules such as Switzerland, the Cayman Islands, the Bahamas, Hong Kong, Singapore, and Jersey. Banks incorporated in these countries – which are often subsidiaries of large global banks – attract foreign individuals and provide them with investment advice and services. In the IIPs of countries, the personal wealth management activities of tax havens do not affect direct investments data, slightly affect “other assets”, but cause large, systematic errors in portfolio securities statistics.
II.A.
How Cross-Border Securities Should be Recorded in Principle
To see what errors occur in portfolio data, denote Aij the amount of securities issued by country j, owned by residents of country i 6= j. To measure Aij, the data collection system of each country i covers some agents directly and others indirectly (IMF, 2002).
4On the asset side of official IIPs, statisticians isolate a fourth category, reserve assets, which includes the portfolio securities and other assets held by central banks. In this paper, “securities” will always include the fraction of reserve assets invested in securities.
Financial corporations such as banks, investment funds, and insurance companies, are direct reporters. They provide data on their own holdings (the securities that are on their balance sheets) and on their clients’ holdings (the securities that are off their bal-ance sheets, but that they can observe). Governments and nonfinancial corporations above a certain size threshold are also direct reporters. By contrast, households are indi-rectly covered, for practical reasons. Their holdings are reported by financial companies. Trusts, personal wealth-holding companies, and other small nonfinancial corporations are indirectly covered as well; for the purpose of this paper, the best thing to do is to in-clude them in the household sector. We can therefore write Aij as the sum of the foreign securities owned by the directly covered agents (aij) and by households (˜aij).
All types of investors entrust their securities to domestic or to foreign banks for custody. Through to the 1960s, all securities existed in the form of paper certificates that were deposited in safe places such as bank vaults. Keeping their clients’ certificates safe was the custodians’ job. Today, paper has been replaced by electronic records, but investors still use custodian banks as book-keepers and for other services. Let’s denote the custodian’s country of residence with a superscript letter:
Aij = X k Akij =X k (akij + ˜akij) = [aiij + ˜aiij] | {z } onshore +X k6=i (akij+ ˜akij | {z } offshore )
To fix ideas, consider a portfolio of U.S. (j) equities held by a household living in France (i). This portfolio can either be entrusted to a French bank – in which case we will say that it is held onshore – or to an offshore bank, say in Switzerland (k).
Offshore banks provide investment advice and services just like onshore banks do. But they also provide opportunities to evade personal income taxes. In most non-haven countries, onshore banks automatically report the investment income earned by their clients to the tax authorities. Such third-party reporting makes tax evasion impossible. By contrast, in tax havens with strict bank secrecy rules, banks do not generally report information. Taxes can be collected only if taxpayers self-declare their income.
1993). The residence principle states that a security issued by the U.S. and held by a French resident through a Swiss bank must be recorded as an asset for France on the U.S. and a liability for the U.S. vis-à-vis France. The location of the custodian is irrelevant.
II.B.
Offshore Portfolios: A Blind Spot in Portfolio Securities Statistics
In practice, offshore custodian banks cause a blind spot in the portfolio assets statistics of countries. When French households entrust U.S. securities to Swiss banks, these assets ˜
ak
ij cannot be captured by surveying French custodians. They go completely unrecorded in the French IIP. This blind spot is well known among statisticians: Bertaut, Griever, and Tryon (2006, p. A67) discuss it in the context of the U.S. data reporting system, the ECB (2002, p. 8) in the context of the eurozone’s.
Household offshore portfolios do not appear on the IIPs of tax havens either. To compile Switzerland’s external accounts, the Swiss National Bank asks domestic banks to report on the securities that they hold in custody. Swiss bankers observe that they hold U.S. securities belonging to French residents. These securities are neither assets nor liabilities for Switzerland, so in keeping with the residence principle, they are excluded from Switzerland’s position.
Household offshore portfolios, however, do appear in the liabilities of countries’ IIPs. U.S. securities held by French savers are duly recorded as liabilities for the U.S. whether they are held in France or in Switzerland. Most of the securities issued by the U.S. are ultimately kept by the U.S. central securities depository, the final book-keeper where set-tlements take place. This centralization makes it relatively easy to estimate the amount of U.S. equities and bonds held by foreigners. (The country allocation of liabilities, how-ever, are distorted: U.S. securities held by French savers through Switzerland are wrongly attributed to Switzerland, because seeing through the Swiss banks is not possible.)
The failure to record household offshore portfolio holdings plagues countries’ portfolio data. An obvious solution would be to ask each tax haven k to provide information about the portfolios held by foreign households through their banks, the ˜ak
ij (k 6= i). No haven, however, discloses this information. No haven, except Switzerland.
III.
Offshore Wealth in Switzerland
Since 1998, the Swiss National Bank has published the value of the offshore portfolios in Swiss banks. A monthly survey of Swiss-domiciled custodians covers 95% of these holdings. The SNB conducts a full survey yearly. Portfolios are broken down by asset class and currency. The SNB also provides evidence as to who owns Swiss accounts. I am not aware of any other paper that uses this unique set of data to investigate the wealth held offshore. The outsized role that Switzerland plays in the offshore wealth management industry means that this one data source can do a lot to fill in the gaps in countries’ portfolio assets data. This Section analyzes what we learn from the Swiss case, before attempting to compute the amount of wealth held offshore globally.
III.A.
The Level and Composition of the Offshore Fortunes in Switzerland
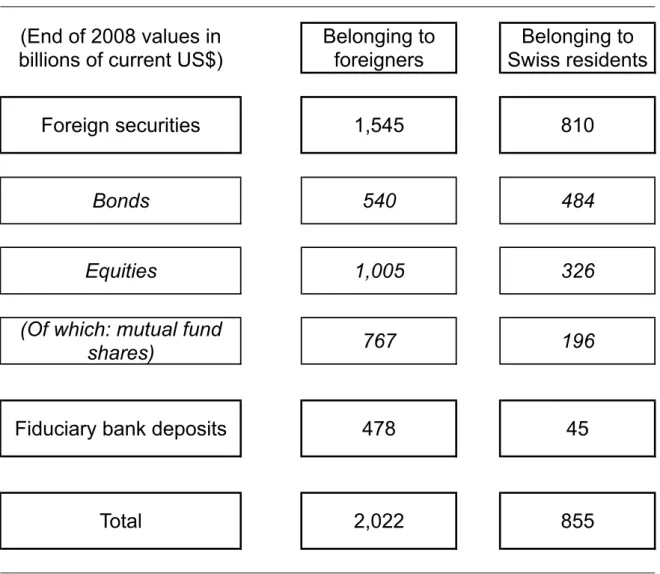
The first striking result, reported in the first column of Table II, is the huge amount of offshore wealth in Swiss banks. At the end of 2008 – when global stock markets were low – foreigners held through Switzerland portfolios of foreign (i.e., non Swiss) securities worth Ωs= $1.5tr.6 Once you add bank deposits (more on these below), the total offshore wealth in Swiss banks comes to more than $2tr – as much as China’s foreign exchange reserves.
For comparison, the second column of Table II shows the value of the assets belonging to Swiss residents in Swiss banks. They are much smaller. In 2008, only one-third of all the foreign securities in the Swiss banks vaults belonged to Swiss savers – two-thirds belonged to foreigners. This pattern epitomizes what offshore financial centers do: Swiss banks essentially help foreigners invest out of Switzerland, the banks acting only as conduits.7 In 2004 there was a survey of the custodial holdings in French banks. In sharp
6In the above accounting framework, Ωs(where Ω stands for offshore, and s for Switzerland) is equal
toP i6=s P j6=s(a s ij+ ˜a s
ij). Ideally we would like to exclude from the offshore portfolios Ω
s the portfolios
of foreign securities that belong to foreign direct reporters (P
i6=s
P
j6=sa s
ij), and we would like to include
the portfolios of Swiss securities that belong to foreign households (P
i6=sa˜ s
is). As discussed below, in
all likelihood both are relatively small, so that Ωs is a good proxy for the amount of wealth held in Switzerland that goes completely unrecorded in other countries’ positions,P
i6=s
P
j˜a s ij.
7One common misconception is that having a Swiss account means having Swiss francs or Swiss assets. In general, this is not the case.
contrast to the Swiss case, almost all the foreign securities in French banks belong to French investors (Gest and Dajean, 2005).
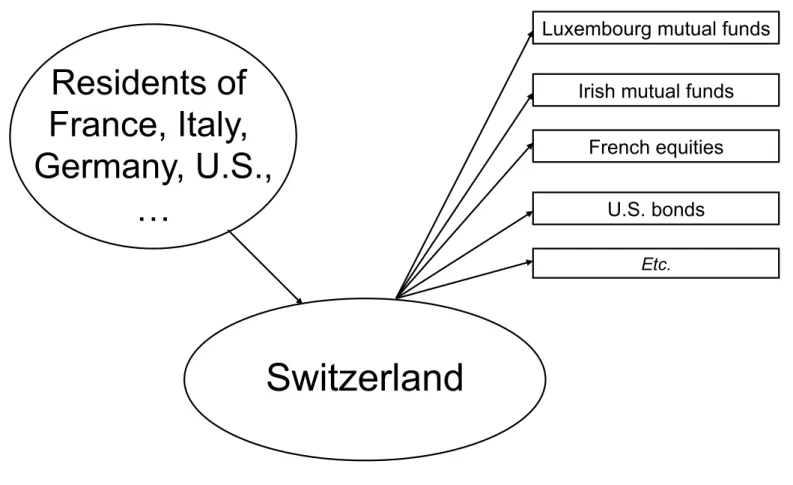
The second interesting result relates to the composition of the offshore portfolios in Swiss banks. Mutual fund shares account for one half, bonds for one third, and equities for the rest. The SNB does not provide statistics on the type of mutual funds that foreigners own (do they invest in bond funds? equity funds?). But we do know that out of the 8,000 funds registered for distribution in Switzerland, about 4,600 are incorporated in Luxembourg and 1,200 in Ireland.8 The data, therefore, reveal a clear
pattern, summarized by Figure II. On their Swiss accounts, foreigners do own some U.S. equities, but they mostly own Luxembourg and Irish fund shares (the funds, in turn, invest all around the world).
Investing in a Luxembourg fund through a Swiss account makes perfect sense for a French tax evader: Luxembourg does not withhold taxes on cross-border payments, so the tax evader receives the full dividend paid by the fund on his or her account, and French personal income tax can be evaded, since there is no automatic exchange of information between Swiss banks and the French tax authority. Conversely, a French person has to go through each step of the France-Switzerland-Luxembourg circuit to evade taxes. Investing in a Luxembourg fund through a French bank does not save on taxes. Investing in a Swiss mutual fund through a Swiss bank is also useless, because capital income paid by Swiss corporations is subject to a 35% advance tax withheld at source by Switzerland. The advance tax can only be refunded when taxpayers self-declare income in their home country. The tax does not apply to income credited to Swiss accounts but paid by foreign corporations, such as Luxembourg funds. This fact explains why the vast majority of the mutual funds distributed in Switzerland are incorporated abroad.
In all likelihood, the foreign securities held in Switzerland by foreigners belong to households. It makes little sense for foreign banks, insurance companies, or investment funds to entrust their non-Swiss holdings to Swiss custodians: doing so does not secure any tax or regulatory advantage. There is no evidence that Swiss banks provide significant
8See http://www.swissfunddata.ch. Most hedge funds are not registered, hence not covered by these statistics. Section V.A. below will specifically address the important case of hedge funds.
custody services for foreign corporations. There is, by contrast, considerable evidence from newspaper investigations, industry reports, and high-profile tax scandals that they offer extensive wealth management services to foreign individuals. Ωs is thus a good proxy for household offshore portfolios in Swiss banks.9
The foregoing discussion has centered on portfolio wealth. In tax havens, however, households can hold not only securities, but also bank deposits. Swiss banks provide a unique kind of deposit owned by households only, in the form of what are known as fiduciary deposits. Fiduciary deposits cannot be used as a medium of exchange: they are useless for corporations. Swiss banks invest the funds placed in fiduciary deposits in foreign money markets on behalf of their clients. Legally speaking, all interest is considered to be paid by foreigners to the depositors, with the Swiss banks acting merely as “fiduciaries.” Thus, fiduciary deposits are not subject to the 35% Swiss advance tax. As shown by Table II, in 2008 fiduciary deposits accounted for one-quarter of the total amount of offshore wealth in Swiss banks.
III.B.
Who Owns Swiss Bank Accounts?
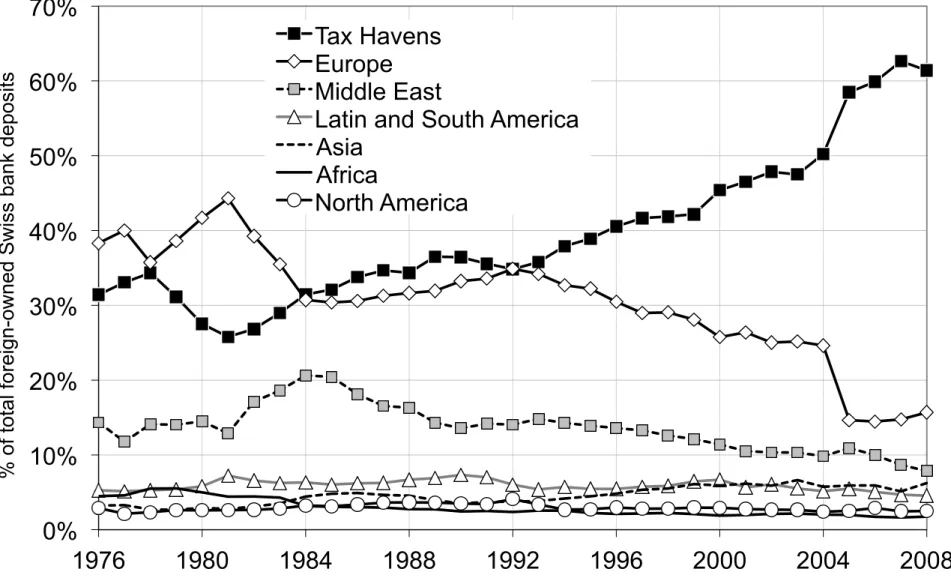
The last contribution made by the Swiss data is to provide unique evidence as to the likely owners of unrecorded fortunes in tax havens. Since 1976, the SNB has published a full country breakdown of the owners of fiduciary deposits.
Country breakdowns are puzzling at first glance. As Figure III shows, the SNB records a large and growing fraction of Swiss fiduciary deposits as belonging to tax havens, most notably Panama, Liechtenstein, and the British Virgin Islands. What happens? The SNB records such holdings because it does not see through sham corporations used by households. If a French saver opens an account in the name of a shell company incorporated in Panama, the SNB assigns the funds to Panama. Using sham corporations
9Note that the SNB provides a breakdown of Ωs by owner sector (private customers, commercial
customers, and institutional investors). But this breakdown is misleading: the SNB does not see through intermediate wealth-holding structures used by individuals with a Swiss account. The SNB counts the securities of a French individual who uses a sham Panamanian holding company as belonging to the foreign “institutional investors” sector. This is a first-order issue: few individuals have an account in Switzerland with their own personal address; most Swiss bank clients use intermediate wealth-holding structures (see Section III.B. below).
as nominal owners of Swiss accounts has a long tradition, dating back to at least the end of the Second World War (Schaufelbuehl, 2009). Once you understand the purposes that sham corporations serve, it becomes clear that most fiduciary deposits assigned to tax havens by the SNB belong to residents of rich countries, in particular to Europeans.
A sham corporation adds a layer of secrecy between the owner of a Swiss account and his holdings, making it harder for tax authorities to investigate cases of tax evasion. When tax evaders combine numerous sham corporations in multiple tax havens, foreign authorities have practically no way to find out who is the beneficial owner of a Swiss account. Sham corporations are less useful to residents of countries where there is no income tax or where tax administrations have no resources to investigate offshore tax evasion. Sham corporations also help Europeans evade taxes. The European Union has adopted the Savings Directive in a move to curb tax evasion: since 2005, Swiss and other offshore banks must withhold a tax on interest earned by European Union residents.10
But the Directive only applies to accounts opened by European households in their own name; sham corporations are a straightforward way of eschewing it.
Figure III shows that there is a clear negative correlation between the share of fiduciary deposits held by Europeans and the share of fiduciary deposits assigned to tax havens. European depositors have shifted their deposits to sham corporations over time. They reacted particularly strongly to the introduction of the EU Savings Directive in July 2005: between December 2004 and December 2005, Europe’s share of Swiss fiduciary deposits declined by 10 percentage points while tax havens gained 8 percentage points.11 Zaki (2010, p. 54) documents how Swiss bankers created sham corporations on a large scale during the summer of 2005 to help their European clients circumvent the Directive.
The U.S. Internal Revenue Service (IRS) provides additional evidence that rich coun-tries’ residents use sham corporations extensively. In 2009, the IRS released case studies of tax evasion by U.S. residents in a big Swiss bank.12 In almost all cases, U.S. tax evaders
10In July 2011, the tax rate was set at 35%. Tax havens keep one-quarter of the tax revenue and transfer the remaining three-quarters to the European country where the account owner is resident. This withholding tax allows tax havens to avoid automatic exchange of bank information, the EU standard.
11See Johannesen (2010) for an analysis of the reaction of Swiss bank deposits to the Directive. 12http://www.irs.gov/uac/Offshore-Tax-Avoidance-and-IRS-Compliance-Efforts.
owned their accounts through sham entities incorporated in Panama, the British Virgin Islands, and Hong Kong. Many of them had transferred their accounts to shell companies in the 1990s or 2000s. In many IRS cases, the sums involved are huge, attaining $100 million for a single family in a single bank.
Let’s assume that in 2004, before the EU Savings Directive, if a country owned 10% of the fiduciary deposits not assigned to tax havens, it also owned 10% of the deposits assigned to tax havens. Let’s also assume that Gulf countries do not use sham corpo-rations, which is plausible since they have no capital income tax. Then the rich world owned 62% of Swiss fiduciary deposits in 2004.13 Contrary to popular belief, there is no
indication that African dictators or rich Asian investors own the bulk of Swiss accounts.
IV.
An Estimate of the Global Offshore Wealth
Switzerland is not the only tax haven that offers wealth management services to foreign individuals. Just like in Switzerland, banks incorporated in the Bahamas, Singapore, and other havens with strict bank secrecy rules attract foreign individuals and provide them with similar private banking services – securities custody and investment advice.14 The
goal of this Section is to present a novel method to estimate the amount of wealth held by individuals through all the world’s tax havens. The method is independent from the official Swiss statistics, which will enable us to check its results against the Swiss data.
IV.A.
Using Anomalies in Countries’ Portfolio Securities Data
The method exploits the anomalies that the personal wealth management activities of tax havens cause in the portfolio securities data of countries. Take the typical investment revealed by the Swiss data: French residents who own Luxembourg fund shares through
13See Appendix, Table A26.
14The testimony of a former Cayman banker can be read in U.S. Senate (2001). Many of the large global banks have subsidiaries with private wealth management activities in Hong Kong, the Cayman Islands, and so on. Based on interviews with offshore wealth managers, the Boston Consulting Group (2009) estimates that about a third of the global offshore wealth is in Switzerland; 20% in Jersey, Guernsey, and Ireland; 20% in the Caribbean and the U.S.; 15% in Luxembourg; 10% in Singapore and Hong Kong.
their Swiss accounts. (In turn, the Luxembourg funds invest in U.S. bonds, German equities, and so on, but forget about the investments made by the funds: they are ir-relevant for the argument). These fund shares should be recorded as portfolio assets for France and liabilities for Luxembourg.15 In practice, France has no way to record assets.
Luxembourg statisticians duly record portfolio liabilities – they are aware that foreigners own shares of domestic funds.16 And Switzerland rightly records nothing on its balance sheet. Portfolio liabilities are bound to exceed assets globally.
The exact same argument applies when you replace France by any country i whose households use tax havens (say the U.S.), Switzerland by any tax haven k that hosts per-sonal wealth management activities (say the Bahamas), and Luxembourg by any country
j that attracts investments or where a lot of mutual funds are incorporated (say the
U.K.). Denote Lj the portfolio liabilities of a country j, Aij the true assets of country i on country j, and ˆAij statisticians’ estimates. Because of the personal wealth manage-ment activities of tax havens, there will be a fundamanage-mental anomaly in the portfolio stock data of countries:
Anomaly 1: More cross-border portfolio liabilities P
jLj than assets Pj
P
iAˆij will
be recorded at the global level.
Corollary of Anomaly 1: For the countries j in which holders of offshore accounts
invest, debtor-reported portfolio liabilities Lj will be greater than creditor-derived liabilities
P
iAˆij.
Tax havens are also bound to cause anomalies in flow data. First, statisticians usu-ally compute dividends and interest income by applying representative yields to stock
15In international investment statistics, mutual funds are treated as regular corporations, they are never made transparent. All mutual fund shares are classified as a type of portfolio equities (even the shares issued by mutual funds that only invest in bonds). This statistical convention can be seen as bizarre, but it is uniformly applied across the world. To clarify matters, I keep the word “equity” for regular portfolio equities and distinguish equities from fund shares.
16Note that the investments made by Luxembourg funds are also duly recorded: U.S. equities purchased by the funds will be recorded as portfolio assets for Luxembourg and liabilities for the U.S. Further, imagine that the funds in Luxembourg are in fact affiliates of German financial companies. In top of everything else, Luxembourg will record a direct investment liability and Germany an asset. The value of the direct investment will be the residual net worth of the funds (e.g., the value of the funds’ offices), which is very small compared to the funds’ gross portfolio assets and liabilities. Any error here does not affect the argument.
positions, because observed positions are considered more reliable than flows.17 If some
securities are missing from the stocks, then Anomaly 2 follows:
Anomaly 2: More cross-border dividends and interest will be paid than received
globally.
Second, offshore banks do not only provide custody but also brokerage services: they buy and sell securities on behalf of their clients. Take a U.S. individual who purchases U.K. equities from her account in the Bahamas. In principle, Bahamian statisticians will notice that the buyer is not a resident of the Bahamas, so in keeping with the residence principle they will not record any equity purchase.18 The U.K., by contrast, will duly
record a sale.
Anomaly 3: When offshore account holders are net purchasers of securities, more
securities are sold than purchased globally. (And more securities are purchased than sold when offshore account holders are net sellers).
Before purchasing equities from her Bahamian account, a U.S. saver must first send funds to the Bahamas. One way to send funds offshore is by means of a wire transfer. Such transfers cause a fourth type of anomaly.
Following the double-entry bookkeeping system used in balance of payments account-ing, a U.S.-Bahamas wire transfer must be recorded twice in the U.S. balance of payments: both as an “other investment” credit (funds flow from a U.S. bank to a Bahamian bank) and an “other investment” debit (a U.S. person purchases a Bahamian asset, namely a Bahamian bank deposit).19 In practice, a credit will be recorded – interbank flows of funds are easy to capture. But U.S. statisticians may fail to record the balancing debit, because it is challenging to identify which transfers, out of the trillions that occur every year, correspond to purchases of offshore deposits by households.
If statisticians fail to record a debit, then the U.S. balance of payments will exhibit negative “net errors and omissions”. If they rightly record a debit, the flow data will be
17See for instance BEA (2011, p. 42) in the case of the U.S.
18A practical reason why they will indeed not record a purchase is that transaction data are increasingly inferred from variations in observed positions – and statisticians do establish positions in keeping with the residence principle, as the Swiss data exemplify.
19In the financial account of the balance of payments, credits denote a reduction in assets or an increase in liabilities, while debits denote an increase in assets or a reduction in liabilities.
accurate but the positions will not. There will be a discrepancy between cumulated flows and stock positions. The discrepancy will show up as an “other change” in the statistics that attempt to reconcile flows and stocks as per the identity ∆Stocks = F lows +
V aluation + OtherChange.
Anomaly 4: In individual countries’ statistics, funds wired into tax havens cause
“net errors and omissions” or discrepancies between cumulated flows and stock positions.
But wire transfers are not the only way to send funds offshore. A U.S. person can for instance carry banknotes, gold, and diamonds overseas. Such transfers will not cause anomalies in balances of payments. They will go fully unrecorded in U.S. statistics. Funds legally earned are unlikely to be massively transferred this way but funds illegally earned may well be. Overall, at the global level some transfers of funds into tax havens go fully recorded, some are partially recorded, others not at all, depending on the source of the wealth held offshore and on national statistical practices – which, on that matter, widely differ across countries.
We can use Anomaly 1 to compute the value of the assets globally held by households in all the world’s havens provided we make two assumptions. On the asset side, we need to assume that the securities held by direct reporters (such as financial corporations and governments) and those held onshore by households are well measured globally (H1). Second, the global amount of recorded portfolio liabilities must be accurate (H2). Under these assumptions, the global gap between identifiable portfolio liabilities and assets captures the value of the portfolios held by households through all tax havens. In this paper, my estimate of the wealth in all tax havens is equal to the difference between globally identifiable portfolio liabilities and assets.
At first glance, this estimation method might seem trivial and crude. It is neither. It requires quite a lot of data, some of which have become available only recently and are assembled here for the first time. More importantly, although assumptions (H1) and (H2) are not fully verified in practice, they are reasonable starting points and the results are robust to relaxing them.
quite reliable. Securities markets are highly centralized. Most countries have a long-standing tradition of monitoring custodians, and custodians observe all the securities held onshore. There is usually no valuation issue: traded stocks and bonds have readily available market prices. That is why, in a reference article, Bertaut, Griever, and Tryon (2006, p. A67) write that: “In general, the data on U.S. liabilities are considered to be reasonably comprehensive [my assumption H2 in the U.S. case], as debt instruments tend to be issued by and bought or sold through large institutions that can be fairly readily identified and included in the data reporting network. U.S. foreign assets held by or through large U.S. institutions should also be well recorded [H1].”20
The relatively good quality of portfolio stock data extends to other leading countries. In response to a number of reports (IMF, 1987; 1992), the IMF has launched in the 1990s a program to harmonize collection methods and spread best practices across the world (IMF, 2002). Since 2008, in all leading economies portfolio asset data have been based on security-by-security surveys. These surveys collect information at the level of individual securities, allowing for extensive cross-checking and error spotting.
Some issues do remain. But as we will see, they are minor for the paper’s results. What they simply mean is that my method to compute the wealth in all the world’s havens can only give an order of magnitude – not an exact figure as in the Swiss case.
IV.B.
Data on Countries’ Aggregate Portfolio Securities
To compute the value of the global offshore portfolio using Anomaly 1, we need aggregate portfolio securities asset and liability figures for all countries. The key source is the August 2009 updated and extended version of the External Wealth of Nations dataset constructed by Lane and Milesi-Ferretti (2007), which covers 178 economies. In the database, portfolio position data come from published IIPs or in minor cases are derived by cumulating flows
20The authors then go on by describing the problem in which we are precisely interested in this pa-per: “However, for smaller U.S. investors, directly purchasing foreign securities abroad without using the services of a large, U.S.-resident institution is increasingly easy. Such acquisitions will not be cap-tured in the U.S. recording system but will most likely be recorded as liabilities by the counterparty country’s measurement system. Because all countries face this problem, cross-border assets are probably undercounted worldwide.”
and adjusting for valuation effects.21
There are three data challenges here: the External Wealth of Nations does not include data for all the world’s territories; I want to include the securities held by central banks (which are classified as “reserves”) in my portfolio assets total; and there are uncertainties on the holdings of Middle Eastern oil exporters. To address these challenges, there exist many studies to rely on, drawing on independent sources. By construction, my figures are in line with these studies, which makes me confident in their accuracy. When uncertainties remain, they can be quantified and they are small compared to my estimate of the global offshore wealth.
First, filling in the coverage gaps in the External Wealth of Nations database does not pose major difficulties. The only significant country not covered is the Cayman Islands, a large financial center where about 10,000 hedge funds are incorporated.22 But
the Cayman Islands’ Monetary Authority has been publishing data on the holdings of Cayman hedge funds since 2006. Based on this information, I reckon that the Cayman Islands had about $1.25tr in portfolio assets at the end of 2008, of which about $700bn were U.S. equities and bonds.23
Second, most countries disclose to the IMF what fractions of their reserves are held in the form of bank deposits versus bonds and other securities.24 Notable exceptions include
China and Taiwan. On average, central banks invest 75% of their assets in securities and 25% in bank deposits; I assume that the same holds true for those countries that do not provide data. However, Wooldridge (2006) suggests that the share of securities is probably higher in China, so I assume a 85% securities share for China. There is a $100-200bn uncertainty on China’s portfolio and a 30$bn uncertainty on Taiwan’s.25 This is
21Starting in 2001, the portfolio data for almost all the largest economies and financial centers come from published IIPs. That is why I only use post-2001 data in this research.
22For the other countries not covered, see Appendix Sections B.3 and B.4.
23Although there remains some uncertainty on the holdings of Cayman hedge funds, this does not affect my estimate of household offshore wealth, because I use the same method to compute the Cayman Islands’ assets as to compute its liabilities. If my assets estimate is $200bn too small, then my liabilities estimate is also $200bn too small, leaving the global assets-liabilities gap unchanged. See Sections A.2 and B.3.1 of the Appendix for more details on the Cayman Islands.
24The two key sources here are the IMF Special Data Dissemination Standard and an IMF survey of securities held as reserve assets, called SEFER.
negligible compared to my estimate of the global offshore wealth ($4,500bn in 2008). Lastly, there is little public information about oil exporters’ holdings. In principle, one could use counterpart country data – such as the Treasury survey of U.S. portfolio liabili-ties – to capture oil exporters’ assets. But oil exporters sometimes invest abroad through offshore banks; the U.S. securities that they hold through Swiss banks will wrongly be attributed by the U.S. to Switzerland.
To estimate oil exporters’ onshore assets, I start with their holdings of U.S. securities as recorded in the Treasury liabilities survey. I then make assumptions regarding the share of U.S. securities in their portfolio. The many studies recently published on the subject share two conclusions: the U.S. share is high and it has declined in the 2000s. The assumption for 2001 of a 70% share of U.S. assets and a regular decline of two percentage points per year fits the available estimates best. To simplify matters, I do not try to specifically estimate the value of oil exporters’ offshore assets; I include these in my globally unrecorded offshore wealth total. Although some uncertainties remain, available studies, official sources, and Swiss statistics suggest that oil exporters account for about 10% of my estimated total offshore wealth Ω.26
IV.C.
The Global Portfolio Assets-Liabilities Gap
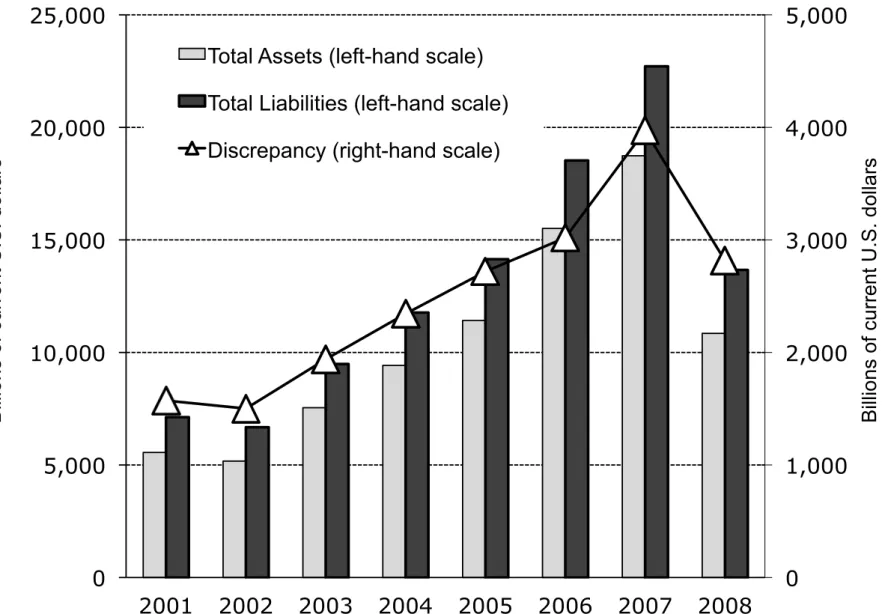
Exploiting the global database, Figure IV reveals a first striking result: each year, there are less securities assets than liabilities identifiable worldwide. In 2008, liabilities P
iLi equal $40tr, while assetsP
iAˆireach $35.5tr only. There is a $4.5tr gap Ω =PiLi−PiAˆi. More than 10% of all cross-border equities and bonds have unknown owners. Figures V and VI plot the discrepancy for equities (including fund shares) and bonds separately. Each year, 20% of all cross-border equities and fund shares have no identifiable owners; bonds are less affected.
Table III compares the portfolios that have no readily identifiable owners globally (Ω) with the offshore portfolios in Swiss banks (Ωs), as of the end of 2008. Both look strikingly the same, although they rely on fully independent data. In each case, equities
including fund shares account for two thirds, bonds for one-third. (And as we will see below, most of the globally missing equities are actually mutual fund shares, just like most of the equities held through Swiss offshore accounts). This fact suggests that the global portfolio assets-liabilities gap does reflect the assets held by households through tax havens. One third of the global missing wealth (Ω =$4,490bn) can be traced back to Switzerland (Ωs =$1,545bn), a finding consistent with industry reports estimating that about a third of the world’s offshore wealth is in Switzerland (e.g., Boston Consulting Group, 2009).
At the end of 2008, the global net financial wealth of households – households’ bank deposits, equities, bonds, and insurance contracts, net of debts – was about $74tr.27 By
my estimate, individuals held unrecorded portfolios worth Ω=$4.5tr in tax havens – that is, about 6% of their net financial wealth.
In tax havens households not only own portfolio securities but also bank deposits. Contrary to what happens for portfolios, offshore deposits do not go completely un-recorded in the international statistics. The major financial centers tell the Bank for International Settlements (BIS) how much deposits foreigners have placed in their banks. In principle, French statisticians can use the BIS data to estimate the value of French residents’ offshore bank deposits, which will then be recorded in France’s IIP as “other assets.” The IMF has been advocating the use of the BIS data by national agencies since the 1990s. Not all countries do so, however, and the BIS does not separate out corporate from household deposits.
In order to give a rough estimate of the global amount of household offshore wealth, I assume in the first column of Table III that 25% of it takes the form of deposits and 75% of securities, as is the case in Switzerland. In 2008, global offshore wealth then amounts to $4.5tr (securities) plus $1.4tr (deposits). The resulting $5.9tr total represents 8% of household financial wealth. Of this 8%, at most 2% (deposits) are recorded as assets in
27This figure comes from the work of Davies et al. (2011) who provide the first comprehensive estimate of the level and distribution of world wealth in 2000 based on an exhaustive exploitation of available national balance sheets. A report by Credit Suisse (2010) builds on the methodology developed by Davies et al. (2011) to provide yearly estimates for the 2000-2010 period, and finds $74tr for 2008.
countries’ IIPs.28
While this paper is the first in the academic literature to estimate the wealth held by households in tax havens, a number of studies have provided estimates before. The most detailed industry report puts the amount of household offshore wealth at $6.7tr in 2008 (Boston Consulting Group, 2009, p. 31). Cap Gemini and Merrill Lynch (2002, p. 11) put it at $8.5tr in 2002. The Tax Justice Network (2005) has a $11.5tr figure for 2005 and Palan, Murphy, and Chavagneux (2010, p. 5) write that “the global rich held in 2007 approximately $12 trillion of their wealth in tax havens.” My estimate, $5.9tr in 2008, is therefore at the low-end of the scale. Note that I focus on financial wealth only, whereas households can also use tax havens to hold works of art and real estate.29
V.
Consistency and Robustness Checks
My method to estimate the personal wealth globally held offshore is indirect, and as such subject to a margin of error. Future statistical improvements will make it possible to refine my estimate. In the meantime, this Section provides evidence that the order of magnitude I find is correct, robust to relaxing the key estimation assumptions, and consistent with independent flow data.
V.A.
Using Bilateral Assets Data to Decompose the Assets-Liabilities Gap
A basic objection to my estimation procedure is that the global portfolio assets-liabilities gap may reflect data deficiencies unrelated to tax havens. How can we be reasonably sure that the gap mostly reflects household offshore holdings? Because of one key reason: the wealth does not vanish randomly, but following a specific pattern that closely mirrors what the independent Swiss data show.
28Deposits are only partially recorded, because not all statisticians use the BIS data as inputs to their IIPs. And more importantly, the BIS data under-estimate the offshore deposits of rich countries’ households, because they do not see through the intermediate wealth-holding structures that the holders of offshore accounts use. The Swiss bank deposits held by French savers through sham Panamanian corporations are assigned to Panama in the BIS data. This is a first-order concern (see Section III.B).
29Whether these elements can explain the difference between my estimate and previous studies is a question that I leave for future research. Cross-border real estate, in particular, is an important asset class for households. I also disregard the wealth of individuals who live in tax havens.
Since 1997, the IMF has conducted a Coordinated Portfolio Investment Survey (CPIS), on a yearly basis since 2001. In 2008, the survey presents the bilateral portfolio holdings
ˆ
Aij of 74 countries on 238 debtors. It is rounded out by a survey of securities held as reserve assets and by international organizations. I use the bilateral data in the 2008 wave of the CPIS to investigate the source of the global portfolio assets-liabilities gap Ω. In its early years, the CPIS had important shortcomings. Initially, only 7 of the countries surveyed by the IMF conducted the security-by-security surveys required to accurately measure bilateral portfolio holdings. The majority of the entries in the CPIS were estimated by participating countries on the basis of ad hoc methods. Over the years, progress was made. In 2008, most leading economies conducted security-by-security surveys, including the U.S., the entire eurozone, and Japan. For these countries, the geographical allocation of assets is likely to be very accurate.30 Some problems still
remain. The U.S., for instance, does not currently count short positions as negative assets, so reported figures are slightly too high. There are some valuation issues: when partial repayment of a debt security is possible, as is the case for asset-backed securities, some custodians keep track of the original principal, others only of what is remaining. But as Section V.B. will show, these shortcomings cannot affect the main conclusions I draw from the analysis of the CPIS data.
To analyze the source of the global gap Ω we need bilateral portfolio assets data for all countries. I have therefore filled the coverage gaps in the CPIS. This is not problematic, because the CPIS has a very good coverage rate: it captures 86% of all cross-border securities in 2008.31 All the leading industrial countries and the large financial centers
participate – although the Cayman Islands only reports on its banks’ portfolio holdings, disregarding its large hedge fund industry. To reach a 98-99% coverage rate, we only need to add data on four non-reporters: China, Middle Eastern oil exporters, Taiwan, and the Cayman Islands’ hedge funds. We have reasonably good information about the investments these non-reporters make: we know that they invest in the U.S. a lot. To allocate some of the non-U.S. investments of CPIS non-reporters, I employ a gravity
30See for instance Bertaut, Griever, and Tryon (2006, p. A63) in the case of the U.S. 31See Appendix Table A1.
model of portfolio holdings.32 The online Appendix extensively discusses the raw sources
and methods used to fill in the gaps in the CPIS.
The CPIS follows the same conventions as other international statistics. The residence principle applies. Take an Italian saver who owns a share of a Luxembourg fund that in turn invests in U.S. bonds. In the CPIS, Luxembourg records a portfolio bond asset on the U.S., and Italy records a portfolio equity asset on Luxembourg... Unless the fund share is held through a Swiss account, in which case it cannot be observed by Italian statisticians.
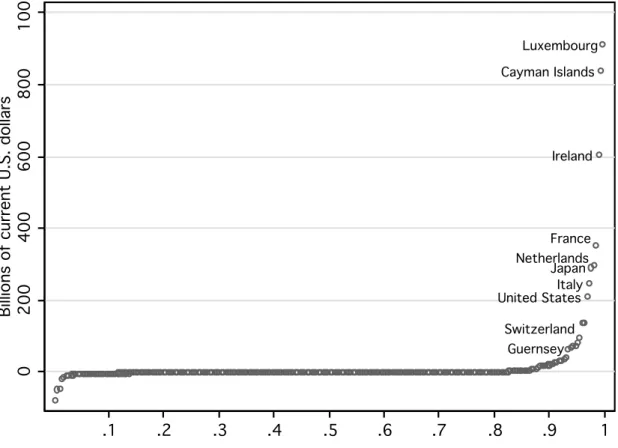
Figure VII decomposes the 2008 global portfolio assets-liabilities gap Ω using the extended CPIS data. Each dot is equal to the difference between the portfolio liabilities reported by a country j (Lj) and the sum of the assets on j identifiable worldwide (PiAˆij). The dots sum to $4,490bn, the global portfolio gap Ω. For 90% of the world’s countries, debtor-reported and creditor-derived liabilities match (Lj = PiAˆij). But for the three financial centers that host large mutual fund industries – Luxembourg, the Cayman Islands, and Ireland – there is a huge discrepancy.33 At the end of 2008, for instance,
Luxembourg had around Lj=$2tr in equity liabilities. Yet only PiAˆij=$1.1tr in equity assets on Luxembourg were identifiable worldwide: about $900bn of Luxembourg mutual fund shares had no known owner.34 Overall, claims on funds incorporated in Luxembourg,
Ireland, and the Cayman, account for 48% of the globally missing wealth Ω.
The missing wealth thus follows a clear pattern that mirrors what the Swiss data showed. We learned in Section III that foreigners own a great deal of Luxembourg and Irish fund shares through their Swiss accounts (Figure II). We now observe that many of such fund shares have no identifiable owners globally (Figure VII). Banks all over the world, and not only in Switzerland, sell Luxembourg and Irish fund shares to their
cus-32As shown by Portes and Rey (2005) and Lane and Milesi-Ferretti (2008), the gravity model fits cross-border portfolio flow and stock data well. Because I apply the gravity model to less than 5% of global assets, any error introduced by the model has negligible consequences.
33These discrepancies have previously been documented by Lane and Milesi-Ferretti (2007) and the ECB (2009) in the case of Luxembourg and Ireland, and suggested by Lane and Milesi-Ferretti (2011) in the case of the Cayman Islands, but my paper is the first to provide a consistent explanation for them. Section D.4. of the Appendix discusses the preliminary steps taken by the ECB to address the issue. Statistical agencies cannot do much until all tax havens disclose who owns the offshore portfolios in their banks (see Section VII).
tomers – simply because a considerable fraction of the world’s mutual funds are incorpo-rated in these two countries that do not withhold taxes on cross-border payments.35 The
specific pattern of anomalies in Figure VII can thus readily be explained by the fact that households own fund shares through unrecorded accounts in Switzerland, Singapore, and the Bahamas. It cannot satisfactorily be explained by other known issues with the data – including with the 2008 CPIS –, nor by my imputations for non-CPIS participating countries. There is admittedly some uncertainty on the holdings of China, oil exporters, and Taiwan, but no indication that these countries massively invest in Luxembourg and Irish funds.36
The large amount of missing claims on the Cayman can also be explained by the use of tax havens by individuals, although the mechanism is slightly different. Most of the funds incorporated in the Cayman are hedge and private equity funds. Shares of such funds are usually directly purchased by investors rather than distributed by Swiss and other banks. Because shares of hedge funds are not entrusted to custodian banks, it is hard for U.S. statisticians to measure U.S. claims on Cayman funds. At the end of 2008, the U.S. recorded just $35bn in assets on these funds while they had more than $1tr in foreign equity liabilities.37 In all likelihood a large amount of U.S. claims went unrecorded. For
U.S. savers, directly investing in Cayman hedge funds offers roughly the same potential tax evasion opportunities as holding Luxembourg fund shares through Swiss accounts. When filling tax returns, taxpayers can choose to report income or not, since there is no automatic exchange of information between Cayman hedge funds and the IRS.38
35One exception is that not many foreign funds are sold on the U.S. territory, because of restrictions put by the Investment Company Act of 1940. Statistics gathered by the European Fund and Asset Management Association (EFAMA) show that Luxembourg and Ireland are the two leaders for the incorporation of mutual funds in Europe. At the global level, Luxembourg comes second to the U.S. But the U.S. withholds taxes on payments made by domestic funds to foreigners, which explains why in tax havens individuals own Luxembourg rather than U.S. fund shares.
36It makes little sense for central banks or sovereign funds to invest in mutual funds (except in hedge funds and private equity funds) since they already pay wealth managers to design suitable investment strategies. The largest sovereign wealth fund, Norway’s, discloses its portfolio on a security-by-security basis: it has virtually no assets on Luxembourg, Ireland, and the Cayman Islands.
37See Department of the Treasury, Federal Reserve Bank of New York, and Board of Governors of the Federal Reserve System (2009, Table 30 p. 71)
38A Foreign Account Tax Compliance Act passed in 2010 seeks to strengthen information reporting. For more information on the taxation of hedge fund investors, see Sheppard (2008). I have no data on what fraction of offshore income goes undeclared in tax returns globally. In the U.S., the IRS estimates that personal income tax evasion through offshore accounts and hedge funds might cost up to $70bn
Why should we care that a considerable amount of Luxembourg, Irish, and Cayman fund shares have no identifiable owners? Because the funds in turn invest in U.S. equities and other securities. Since we do not know who owns a large fraction of the world’s mutual funds, we cannot know who ultimately owns a large fraction of U.S. equities.39
The missing claims on France, Japan, and other rich countries in Figure VII can be attributed to the fact that through their offshore accounts savers directly invest in French equities, Japanese bonds, and other securities issued by rich countries.40 Again this would be congruent with the Swiss data, which showed that households directly own equities and bonds in addition to their Irish and Luxembourg fund shares.
V.B.
How Known Issues with Available Data Affect My Estimate
My estimate that about 6% of household financial wealth is held unrecorded in all the world’s tax havens relies on two assumptions. First, global portfolio asset figures must accurately reflect the securities held by corporations and governments and those held onshore by households (H1); second, global portfolio liability totals must be accurate (H2). Here I briefly review the main known issues in countries’ aggregate portfolio data and discuss how relaxing the two assumptions affects the results.
On the asset side, asset-backed securities and short positions are sometimes imper-fectly recorded. These shortcomings, however, cannot explain the considerable amount of globally missing mutual fund shares. Another issue is that in the U.S., some hedge and private equity funds have been unaware of their reporting duties. This coverage gap probably explains part of the missing claims on the Cayman Islands. The Bureau of Economic Analysis and the Federal Reserve are working on improving their coverage of U.S. hedge funds. Looking forward, these data improvements will make it possible to identify which part of the missing claims on the Cayman Islands is due to reporting
annually (Gravelle, 2009).
39Along these lines, Section C.2. of the Appendix reckons that at least 15% of U.S. cross-border portfolio equity liabilities have no identifiable ultimate owner.
40In principle, these anomalies could also be attributed to problems in the 2008 CPIS and in my impu-tations. However, there is no particular reason why these problems should specifically cause anomalies for France, Japan, Netherlands, and the U.S., as in Figure VII. Note that France is also one of the lead-ing mutual fund centers in Europe along with Luxembourg and Ireland, and that many multinational corporations are headquartered in the Netherlands.
problems within the U.S. financial industry, and which part is household wealth going unrecorded. In any case, the officially reported net foreign asset position of the U.S. is currently underestimated.
Second, published liability figures may be overestimated. Take a French person who owns French equities via a Swiss bank. From the viewpoint of international statistics, these equities are not cross-border claims, but they will likely be recorded by French statisticians as liabilities for France. In this case, the use of offshore banks by households does not bias asset data downwards but liability data upwards. However, such round-tripping does not affect the paper’s argument. Too much liabilities are recorded globally, and the observed assets-liabilities gap still directly reflects household offshore portfolios. Liability figures, on the contrary, may be under-estimated. Take a French saver who owns U.S. equities via a Swiss bank. U.S. statisticians will not always be able to record these equities as U.S. liabilities. But these equities will not be recorded on the asset side of the French IIP either. So accounting for them would both deteriorate the U.S.’s net foreign asset position and improve France’s by the same amount. The wealth held in tax havens would be even greater than I have found.
In sum, available aggregate portfolio data do not always verify my two identification assumptions. In light of what we know today, however, there is no indication that my methodology substantially over- or under-estimates the wealth offshore. While future improvements in portfolio statistics will make it possible to refine my estimate, there is no particular reason to expect they could radically affect the order of magnitude I find.
V.C.
Consistency Between Flow and Stock Anomalies
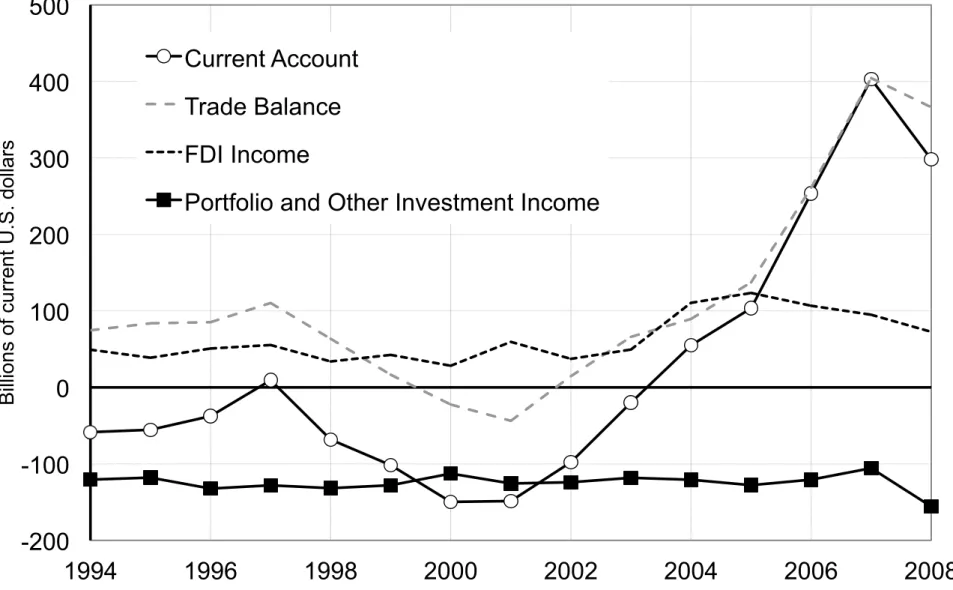
A last consistency check comes from the flow data. The global assets-liabilities gap Ω has its counterpart in the world balance of payments computed by the IMF independently from the present study. The IMF world balance of payments includes all countries’ reports plus undisclosed IMF estimates for all non-reporters. It displays two inconsistencies. First, more investment income is paid than received each year (Anomaly 2). In 2008,
the discrepancy amounted to D=$156bn.41 To see how this flow anomaly fits in with
my estimated stock anomaly, denote rΩ the yield on the missing portfolios Ω – that is,
the flow of missing dividends and interest divided by the stock of missing securities. A missing flow of $156bn implies a yield of rΩ=3.5%, consistent with the average yield on
recorded cross-border securities.42
Second, barring one exception in 1998, there are more securities sold than purchased globally (Anomaly 3). Again, this anomaly fits in well with the portfolio assets-liabilities gap Ω. To see why, denote It the net unrecorded purchases of securities, and V ALt the net capital gains on existing unrecorded portfolios. We can write the change in the stock of unrecorded portfolios Ω between t − 1 and t as Ωt− Ωt−1 = It+ V ALt. Table IV breaks Ω down as per this equation. A reasonable pattern emerges: steady inflows, negative valuation effects during equity bear markets, positive valuation effects during bull markets, and reasonable yields rΩ throughout the period.
One anomaly that is not systematic in the data is “net errors and omissions” in individual countries’ balances of payments. Over the 1970-2004 period, some countries have exhibited large net errors, such as Italy, Norway, or Russia (Lane and Milesi-Ferretti, 2007, Table 3 p. 243). But some EU countries and the U.S. have not. Does that invalidate my results? Not at all. First, only wire transfers are expected to cause net errors (Anomaly 4). Many other ways to send fund offshore are not – such as carrying banknotes overseas, granting a loan to a shell offshore company, and receiving wage on an offshore account.43 There is even no clear prediction as to whether wire transfers should cause “net errors” in all countries, because there is a great deal of heterogeneity in how wire transfers made by households are dealt with. Lastly, “net errors” reflect many issues unrelated to tax havens – such as differences in the timing of trade and financial transactions – that make them a poor indicator of the magnitude of capital flight.
41See Appendix Table A21. 42See Appendix Table A22.
43Section D.4 of the Appendix discusses five concrete case studies of transfers and how they should be recorded.
VI.
Implications of Tax Havens for International Imbalances
In 2008, globally identifiable portfolio liabilities exceed assets by about $4.5tr. The missing assets must belong to some countries. This Section proposes scenarios as to how accounting for the unrecorded assets affects international imbalances – both stock and flow imbalances, commonly referred to as “global imbalances.” The scenarios are thought experiments such as: “What is the true U.S. net foreign asset position if the U.S. owns 20% of the unrecorded wealth?”; as such, they are speculative. However, a number of robust qualitative findings emerge.
VI.A.
The Eurozone and the Rich World are Probably Net Creditors
As we have seen, about one-third of the missing assets can readily be attributed to house-holds with Swiss accounts, and the remaining two-thirds probably belong to househouse-holds with accounts in other tax havens. The SNB’s statistics suggest that more than half the offshore wealth in Switzerland belongs to Europeans. Although we do not know who owns the offshore wealth in the Cayman Islands and Singapore, surveys of wealth managers give some direction. For instance, the Boston Consulting Group (2009) estimates that 42% of all offshore wealth belongs to Europeans and 60% to residents of rich countries.
Table V presents scenarios as to how unrecorded assets affect the net foreign asset position of the eurozone, officially the world’s second largest net debtor. Accounting for the offshore wealth in Switzerland alone considerably improves the eurozone’s position. If in addition the eurozone owns 25% of the offshore portfolios in the world’s other tax havens, then it is balanced. If it owns 50% of all the unrecorded portfolios, it is in actual facts a sizeable net creditor. In all plausible scenarios, the eurozone shifts into the black. Table VI presents similar computations for the U.S. Accounting for unrecorded assets improves the U.S. net position, albeit by a smaller amount. If U.S. residents own 20% of all unrecorded wealth – say, 15% of the offshore wealth in Swiss banks and 25% of the other missing assets – then the net position of the U.S. is significantly better than in the official data: -12% of GDP on average over 2001-2008 as opposed to -18% in the data.
My benchmark scenario where the eurozone owns about half the unrecorded wealth and the U.S. 20% turns the overall rich world into a net creditor. This result is robust to alternative assumptions. Since unrecorded assets are double the recorded net debt of the rich world, the rich world shifts into the black as long as it owns more than half of them. Available Swiss data suggest that it is a lower bound, which is hardly surprising since residents of rich countries own 80% of recorded world wealth (Davies et al., 2011). Remember also that most of the unrecorded assets are Luxembourg, Irish, and Cayman fund shares. We have reason to believe that these fund shares belong in the main to Europeans (especially Luxembourg fund shares) and Americans (especially Cayman fund shares).44 Developing countries have offshore accounts too, but plausibly not more than
30% of all offshore wealth: about 10% for oil exporters and 20% for non-oil developing countries is a reasonable take in light of available evidence.45 Lastly, among rich countries,
Japanese residents do not seem to use tax havens extensively – they own less than 1% of Swiss bank deposits – plausibly because capital income is much less taxed in Japan than in other developed economies.46
VI.B.
Implications for Global Imbalances
If indeed the eurozone is a net creditor and the U.S. less indebted than in the official statistics, then the net foreign asset positions of countries are globally less dispersed than we think. Along the stock dimension, international imbalances are still quite small. How does that affect our understanding of the dynamics of global imbalances?
Because sufficiently comprehensive portfolio data are not available prior to 2001, we cannot estimate the wealth held unrecorded before 2001. But we do know that capturing
44Felettigh and Monti (2008) document that about half the foreign equity holdings recorded by Italy are in Luxembourg funds. The ECB (2009) considers that most of the missing assets on Luxembourg and Ireland probably belong to eurozone residents. Lane and Milesi-Ferretti (2007) document that Irish statisticians recorded five times more U.S. investments in Irish equities than U.S. statisticians did in 2004, so U.S. residents may own a significant fraction of the missing claims on Ireland.
45The hypothesis that Middle Eastern oil exporters own 10% of the globally unrecorded portfolios Ω implies total portfolio holdings for Middle Eastern countries well in line with the literature, see Appendix Table A8. Middle Eastern countries own 10% of Swiss bank deposits and non-oil developing countries 25%, see Appendix Table A26.
46In 2005, the OECD reports that the net personal tax rate on dividends was 22% in Germany, 32% in France, as opposed to 10% in Japan, and 18% in the United States.