Publisher’s version / Version de l'éditeur:
Technical Note (National Research Council of Canada. Division of Building Research), 1965-09-01
READ THESE TERMS AND CONDITIONS CAREFULLY BEFORE USING THIS WEBSITE.
https://nrc-publications.canada.ca/eng/copyright
Vous avez des questions? Nous pouvons vous aider. Pour communiquer directement avec un auteur, consultez la
première page de la revue dans laquelle son article a été publié afin de trouver ses coordonnées. Si vous n’arrivez pas à les repérer, communiquez avec nous à [email protected].
Questions? Contact the NRC Publications Archive team at
[email protected]. If you wish to email the authors directly, please see the first page of the publication for their contact information.
NRC Publications Archive
Archives des publications du CNRC
For the publisher’s version, please access the DOI link below./ Pour consulter la version de l’éditeur, utilisez le lien DOI ci-dessous.
https://doi.org/10.4224/20359186
Access and use of this website and the material on it are subject to the Terms and Conditions set forth at
Calibration of Some Willmore Seismometers
Ward, H. S.
https://publications-cnrc.canada.ca/fra/droits
L’accès à ce site Web et l’utilisation de son contenu sont assujettis aux conditions présentées dans le site LISEZ CES CONDITIONS ATTENTIVEMENT AVANT D’UTILISER CE SITE WEB.
NRC Publications Record / Notice d'Archives des publications de CNRC:
https://nrc-publications.canada.ca/eng/view/object/?id=6882eb3d-4cc0-4966-99d8-f20c9337d0c6 https://publications-cnrc.canada.ca/fra/voir/objet/?id=6882eb3d-4cc0-4966-99d8-f20c9337d0c6
453
DIVISION OF BUILDING RESEARCH
NOTlE
No.
'f
E
C
1HIN ][ CAlL
NATIONAL RESEARCH COUNCIL OF CANADA
PREPARED BY
H. S. Ward CHECKED BYTDN APPROVED ay NBH
DATE September 1965
PREPARED FOR
Inquiry and record purposes
SUBJECT
CALIBRATION OF SOME WILLMORE SEISMOMETERS
The six Willmore seismometers used for the measurement of wind-induced vibrations of buildings have been calibrated in the
past by an electrical method. It was decided to perform a calibration
of the same instruments through the use of a shaking table. The
Inspection Services Branch of the Department of National Defence very kindly offered the use of their equipment for the purpose of the calibration tests.
METHOD OF CALIBRATION
The shaking table was manufactured by the All American Co.
of Skokie, Illinois, U. S. A. The maximum possible motion of the
table was O. 150 in. peak to peak, and the lowest reproducible frequency
was around 2.5 cps. The 3 ft of the cradle of the seismometer were
centred on the shaking table by 3 locating marks, and the seismometers were securely locked to the shaking table and the cradle by a canvas belt (Figure 1).
The motion of the shaking table was monitored by fixing a previously calibrated.:!: 0.25 g Statham accelerometer (#10181) to the
table. As another check of the motion at the higher frequencies, sight
marks were placed on the shaking table and the seismometers, and a
telescope that could measure displacements within セ 0.001 in. was
2
-The seismometers were damped to approximately 0.6 of the critical value by placing a load impedance in parallel with the
seismometers, and the voltage output was measured across this load
impedance. The voltage outputs of the accelerometer and the
seismometer were recorded on a Sanborn recorder. A certain amount
of 60 cps noise was present in the output of the seismometers, and this was eliminated by passing the signal through a Kronhite band-pass filter with the low cut-off at 0.2 cps and the high cut-off at
approximately 35 cps. The frequency setting at the high end was
determined by finding the setting that did not attenuate the output of the seismometer when it was excited at 15 cps (the highest test frequency) .
Each seismometer was calibrated for three different values
of its natural period. For a given setting of the natural period the
seismometer was excited at frequencies lying in the range of 2.5 cps
to 15 cps. The first seismometer to be calibrated (#171766) was
te sted to 19. 2 cps, but the tele scope information showed that the mounting arrangement was beginning to show a resonance effect. Thus, for the remaining te sts the highe st frequency was 15 cps.
Upon completion of the shaking-table calibration, the relation between the number on the dial of the seismometer and its
natural period of vibration was investigated. This was achieved by
applying a dc voltage across the coil of the seismometer; the voltage was then removed and the re suIting undamped vibrations of the
seismometers were recorded. RESULTS
The results of the shaking-table tests are given in Table I.
The frequency of excitation was determined from the recording paper
which provided a timing line every 0.1 sec. With this value of the
frequency, the velocity recorded by the Willmore was estimated from the acceleration measurements of the Statham and the displacement
measurements of the telescope. For all but the highest test frequency,
the two values of the velocity at a given frequency agreed within 5 per
cent. In these cases, the average value of the two velocities was used
in the calculation of the calibration constants of the seismometer. In
the case of the frequencies above 15 cps, the accelerations were
greater than the design range of the accelerometer (0. 5 g peak to peak); the velocity obtained from the telescope was used for the calculation of the calibration constants.
3
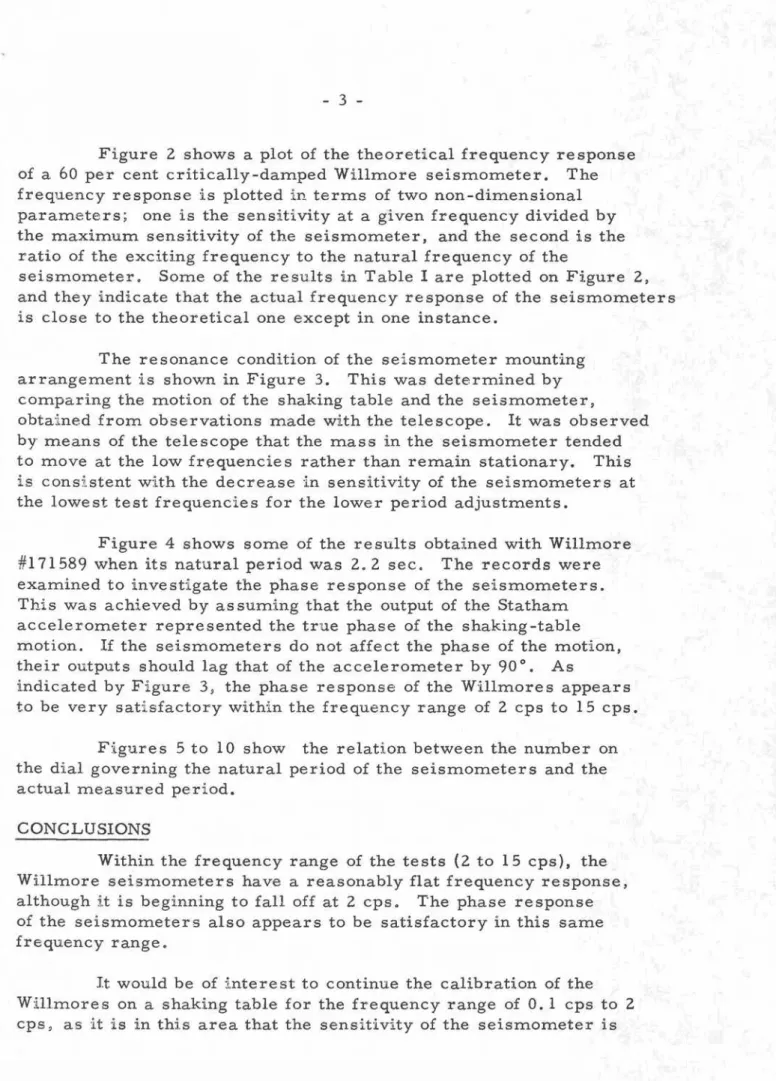
-Figure 2 shows a plot of the theoretical frequency response of a 60 per cent critically-damped Willmore seismometer. The frequency response is plotted in terms of two non-dimensional parameters; one is the sensitivity at a given frequency divided by the maximum sensitivity of the seismometer, and the second is the ratio of the exciting frequency to the natural frequency of the
seismometer. Some of the results in Table I are plotted on Figure 2,
and they indicate that the actual frequency response of the seismometers is close to the theoretical one except in one instance.
The resonance condition of the seismometer mounting arrangement is shown in Figure 3. This was determined by comparing the motion of the shaki.ng table and the seismometer,
obtained from observations made with the telescope. It was observed by means of the telescope that the mass in the seismometer tended to move at the low frequencies rather than remain stationary. This is consistent with the decrease in sensitivity of the seismometers at the lowest test frequencies for the lower period adjustments.
Figure 4 shows some of the results obtained with Willmore #171589 when its natural period was 2.2 sec. The records were examined to investigate the phase response of the seismometers. This was achieved by assuming that the output of the Statham accelerometer represented the true phase of the shaking-table motion. If the seismometers do not affect the phase of the motion, their outputs should lag that of the accelerometer by 900
• As
indicated by Figure 3, the phase response of the Willmores appears to be very satisfactory within the frequency range of 2 cps to 15 cps.
Figures 5 to 10 show the relation between the number on the dial governing the natural period of the seismometers and the actual measured period.
CONCLUSIONS
Within the frequency range of the tests (2 to 15 cps), the Willmore seismometers have a reasonably flat frequency response, although it is beginning to fall off at 2 cps. The phase response of the seismometers also appears to be satisfactory in this same frequency range.
It would be of interest to continue the calibration of the Willmores on a shaking table for the frequency range of O. 1 cps to 2 cps, as it is in this area that the sensitivity of the seismometer is
4
-decreasing.
ACKNOWLEDGEMENTS
The Division of Building Research would like to express its thanks to the Inspection Services Branch of the Department of National Defence and, in particular, to Mr. Dan Slade and Mr. Edward Jordan for their as sistance during this project.
TABLE I
CALIBRATION CONSTANTS OF THE WILLMORE SEISMOMETERS
Willmore Period, Damping
Number sec Resistor
10 30hms 3.2 4.8 6.7 9.7 9.8 12.5 14.5 19.2 Frequency (cps) 0.76 4 7.9 8.6 8.4 8.7 8.5 9.7 8.8 8.9 カッャエウOゥョセ sec -1 171766 0.92 8 2.7 5.0 8.4 9.7 14.7 Frequency (cps) 10.0 9.7 9.5 9.2 9.2 Calibration Constant
volts/ in. sec -1
2.5 5.0 8. 1 9.8 14.5 Frequency (cps) 1. 10 15 10.7 10.8 10.7 10.5 11.2 Calibration Constant volts/in. sec -1 2.8 4.8 8.3 9.8 14.5 0.85 4 7.0 7.5 7.8 7.6 8.0 171588 1. 29 8 2.8 5.0 8.4 9.8 14.5 8.8 9.2 9.3 9. 1 9.8 2:
6
5.2 8.3 9.8 14.5 2.04 15 10. 1 10.5 10.7 10.5 11. 1 2.2 2.6 5.0 7.7 9.7 14.7 0.88 4 6.8 7.4 8.2 8.2 8. 1 8.3 3.2 5. 1 7.7 9.6 14.7 171586 1. 05 8 8.6 9.2 9.0 9.6 9.2 2.7 5. 1 8. 1 9.8 14.7 \ 1. 15 15 10.5 10.4 10. 1 9.9 10. 1.
3.4 5.2 8.4 9.8 14.5 0.82 4 4.7 7.5 6.6 7.3 7.8 3.1 5.0 8.2 9.9 14.5 171770 1. 29 8I
9.2 9.2 9.4 8.7 8.9 3.4 4.9 7.9 9.8 14.5 2.14 15 9.9 10. 3 10. 1 10.0 10. 1 3. 1 5.0 8. 1 9.6 14.3 0.88 4 6.7 7.0 7.2 7.2 7.0 2.8 5. 1 8.3 9.6 14.5 171589 1.34 8 9:0 9.0 9.7 9.5 9.0TABLE I {continued}
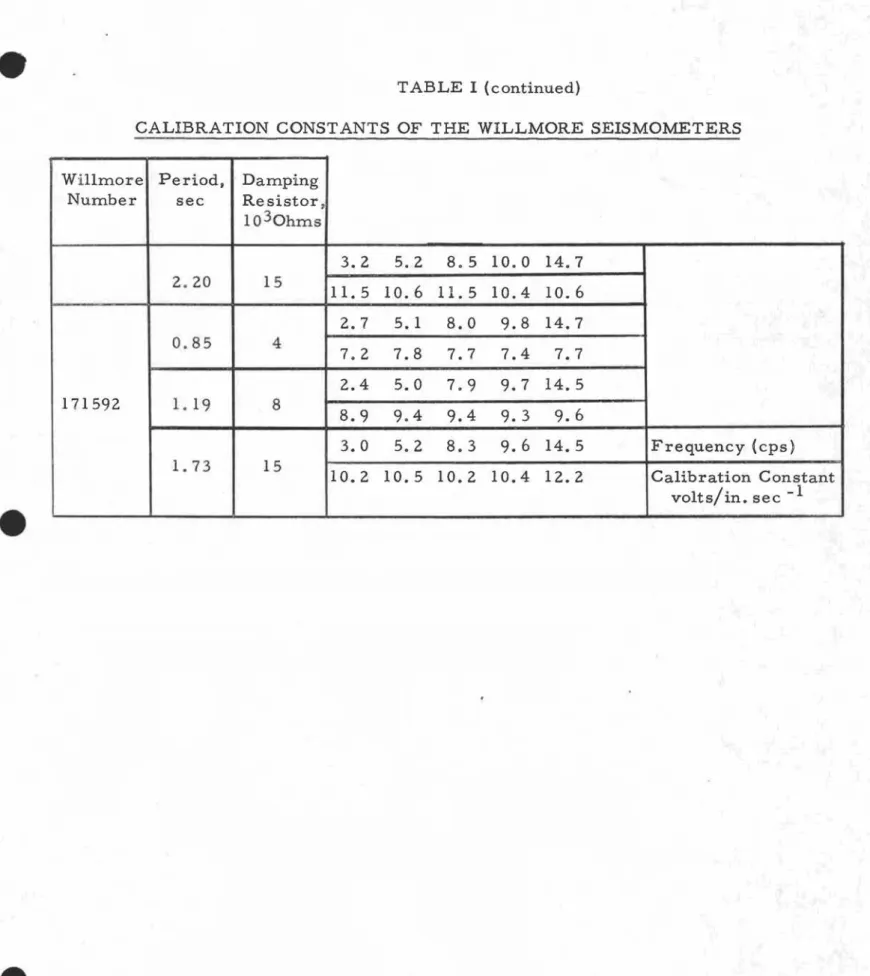
CALIBRATION CONSTANTS OF THE WILLMORE SEISMOMETERS
Willmore Period, Damping
Number sec Resistor,
10 30hrns 3.2 5.2 8.5 10.0 14.7 2.20 15 11.5 10.6 11.5 10.4 10.6 2.7 5. 1 8.0 9.8 14.7 0.85 4 7.2 7.8 7.7 7.4 7.7 2.4 5.0 7.9 9.7 14.5 171592 1. 19 8 8.9 9.4 9.4 9.3 9.6 3.0 5.2 8.3 9.6 14.5 Frequency (cps) 1. 73 15 10.2 10.5 10.2 10.4 12.2 Calibration Constant volts/in. sec- l
Strap Holding Cradle
&
Seismometer
Down to the Shaking Table
"'rT----t
t:::::::r--
C
ra
die
Location Holes In the Shaking Table
FIGURE
1
e
e
•
LO
(
1
:S
A-8-I1'1 0 i t . A ' 0>
0•
•
.-
•
. 0 0 o A A•
>
•
A A-!:
0.8
0 A V)I
I
Theoretical frequency response
z
Y.I. -
for a 60% critically-damped
V).
Willmore Seismometer
x
06
A«
.
0Willmore
171586
:E•
Willmore
171588
-
>
.-
0Willmore
171589
-
•
Willmore
171592
:: 0.4
t.Willmore
171766
.--
AWillmore
171770
V)z
LU V)0.
2
o
1
2
3
4
5
6
7
8
9
10
EXCITING FREQUENCY
. NATURAL FREQUENCY OF THE SEI SMOMETER
"1\STXセMRFI GURE
2
THEORETICAL AND MEASURED FREQUENCY RESPONSE CURVES OF THE
WILLMORE SEISMOMETERS
e
e
e
M
M・]]ZZZZ]セGセZ]M_
-.
.
-
.
--Peak-to-peak motion
of the Shaking Table
20
FQGiセKaBMS15
10
FREQUENCY (CPS)
5
V) LoU:z:
u
z
-V)0.05
a::: LoU....
LoU セセ
0.04
V) -LoU V) LL.0.03
0z
0-....
セ
0.02
セ <C LoU CL.o
0.01
....
I セ<
LoU CL.0
FIGURE
3
RESONANCE OF SUPPORT ARRANGEMENT OF THE WtLlMORES ON THE
SHAKING TABLE
e
e
e
Ot« \ I \ { \.t
0.5 Seconds-I_
I I I I0.04
0.02 -0.02-0.04
.t
0.5 Seconds"L
' I I Il-n
n
nn n
I-\
I-U
\J \JU
V
I-0.1 0.1 0.2 Q2 +0.4...--
a> -Z +0.2 I-0 -セI
<I
0::. a.J ...JV
g
-Q2 [V
V
V U,
-0.4 0.5 Secondsi
.t
I I ! I Vl セ +20 o > a.J 0:: +10 o :E ...J ...J::
...
o -10 I -: l セ セ -20 o +10o
-10I-"
n
n
n
f\
"
I-\J
\J
u \,jセ
u 4 01 I \ , " I 't -4 FIGURE 4EXAMPLES OF THE RESPONSE OF WillMORE 171589, WHEN ITS NATURAL PERIOD IS 2.2 SECONDS
-\0
....
セ,
Ifl dJ V I't\ CC q- III....
-.
•
••
•
N....
N 0 -LI'\....
r-S
....
\
0:: L.&J L.&J\
CQ==
0::0•
00 ::J==
\
z
...J...J ...J•
<:3=
\
Q u.. LI'\ 0•
\0l
L.&J Q 0:: 0 :;:I c.:> 0::,
L&.I u..0-•
1
N"""
035
Gooiセャ、
'-0
...
"
I IfIセ
q-:It
...
c
0 - 0 ...0 N ' 0...
0"-C 00\
LI\...
0 .-0...
...
\
0:: C L.a.I L.a.I\
a::l 0:::E
0 0 00 ::;):E
\
z
-J...
....J C<
;:
\
Q ""-0 '-0 '-0 0,
L.a.I Q 0:: 0 C ::;)I
Co:) 0:: LI.J 0 u..0-1
NGMMMMセMMMNNNNlNMMMMGMMMMNNjNNNMMMNlMMMMMGッ
q- C'f"\ N33S 'OOIH3d
\Q セ ,..., I If\ CIO セ
"'
10セ
0 0 - - - ' 0 _ ]Moセ N 0....
\Q 0 00Lt\\
...
....
0 0....
....
\
IX L.I.l 0 L.I.l IX\
c:a
セ 0:E
00='
...
Z...
...
3t
0 0<\
Q...
u.. 0 \Q L.I.l Q IX 0 :::) -0c.:>
IXl
u.. L.I.l 0-N mJ3S
GooiセS、
N セ\0
-
Ul I rf\ u:l oj;1
oo;::r -- 4 - 4 ' _ - 4 _____.,
N 4-e
I"-4I"-\
-
l"-e
-4-\
0::: LLJ LLJ 4 co 0:::\
:E
0 :::::J:E
4 00 Z ...J\
...J ...J 4 c(3:
\
Q u.. 00 0•
\0 Q\
LLJ0::: 0 :::::J•
,
(,,:) 0::: LLJ u.. 0.. 4,
4 N33S
GooiセS、
-e
'0
![[DOC] Cours Merise : le MCT avec exercices d’application | Cours merise](data:image/gif;base64,R0lGODlhAQABAIAAAP///wAAACH5BAEAAAAALAAAAAABAAEAAAICRAEAOw==)